The Expanding Landscape of Road Rage: A Systematic Review of Conflicts Involving Drivers, Pedestrians, and Micromobility
Road rage, characterized by aggressive behaviours among road users, has become a significant public health concern in urban transportation. This review, which shifts from a driver-centric to a multi-modal, systemic perspective, synthesized 135 empirical studies to examine road rage across multiple user groups, while also analyzing trends, contributing factors, and mitigation strategies. Studies were sourced from Scopus and included diverse road user types and methodologies, with experimental studies being the most common (39.3%), followed by observational (24.4%) and mixed methods approaches (20.7%). The research was mainly focused on China (32 studies) and the United States (16 studies), with 116 studies (85.9%) emphasizing driver behaviour. However, pedestrian (65 studies, 48.1%) and cyclist interactions (23 studies, 17.0%) are increasingly acknowledged. Environmental factors were the most frequently examined contributors (122 studies), with substantial statistical significance noted: 59.3% of effect sizes were large (≥ 0.5). Infrastructure modifications (64 studies) and education programs (46 studies) appeared as key intervention strategies, with 30 studies reporting successful outcomes. This review highlights the need for interdisciplinary approaches that include all road users and stresses the importance of standardized reporting, cultural factors, and rigorous evaluations to improve transportation safety.
Abbreviations
PRISMA: Preferred Reporting Items for Systematic Reviews and Meta-Analyses; GLMs: Generalized Linear Models;
CAX: Cycling Anger Expression Inventory; AI: Artificial Intelligence, ANOVA: Analysis of Variance; LPI: Leading Pedestrian Interval.
Introduction
Road rage is a serious and growing public health issue that extends well beyond individual acts of aggression. Its impacts place a significant burden on society, directly leading to traffic crashes, injuries, and fatalities. Besides the immediate physical damage, road rage damages psychological health, causing widespread anxiety, stress, and post-traumatic stress among drivers, pedestrians, and other road users. Moreover, it erodes community bonds by reducing public trust in shared spaces, discourages active transportation such as walking and cycling, and ultimately lowers the overall quality of life and safety in communities [1, 2, 3].
As micromobility devices, such as e-scooters and e-bikes, become more common, it is essential to address the specific vulnerabilities of these users. Their speed and agility in busy urban traffic often create conflicts with both pedestrians and motorists. The lack of clear regulations for these modes of transport further increases the risk of road rage incidents, underscoring the need to better integrate micromobility into urban transportation planning.
Defining Road Rage in Multi-Modal Era
Road rage, a significant public health concern in urban transportation, is reconceptualized in this review as a spectrum of aggressive and violent behaviours exhibited by any road user within a shared transportation system. Moving beyond the traditional driver-centric paradigm, this definition explicitly encompasses the full diversity of modern road users: drivers, pedestrians, cyclists, and micromobility users [4, 5, 6].
The literature shows this phenomenon as a continuum, not a single act. On one end are aggressive behaviours that increase collision risk. For example, jaywalking, while not an act of rage itself, is a key precursor, often triggering aggressive responses from drivers [7]. Similarly, aggressive driving is defined as a conscious decision to operate a vehicle selfishly and dangerously, driven by impatience or hostility [8]. Micromobility users also display their own forms of aggression, such as risky manoeuvres, including frequent, abrupt acceleration and deceleration or sneaking through traffic gaps in an intimidating way [9, 10].
At the end of the spectrum lies road rage proper, characterized by violent behaviours intended to cause physical or material harm [8]. For cyclists and micromobility users, conflicts are often defined by their subjective experience of feeling threatened or unsafe during interactions with larger vehicles, ranging from verbal aggression to collisions [11]. This inclusive, multi-modal definition provides the essential foundation for analyzing the complex interactions and systemic causes of conflict explored in this review [12, 13, 14].
Imperative for Multi-User Perspective
The traditional approach to road rage research, which has mainly centred on the psychology and behaviour of vehicle drivers, is fundamentally inadequate for addressing the realities of modern urban transportation. Today’s roads form a complex, shared environment where a variety of users must navigate a limited, often contested space. This driver-focused perspective fails to fully understand the range of conflict dynamics, overlooking the unique vulnerabilities, behaviours, and frustrations of non-driver users who can be both perpetrators and victims of aggression [15, 16, 17, 18].
The need for this expanded perspective is heightened by two key urban trends: (a) the significant increase in micromobility options (e-scooters, e-bikes) and (b) rising urban density. These factors have fundamentally changed how people interact on city streets, creating new and frequent conflict points. Zhang, et al. [19] showed that even specific infrastructure decisions, such as bus stop design and cycleway width, greatly affect passenger-cyclist interactions, illustrating how the built environment can either reduce or provoke conflict. Moreover, policies promoting sustainable transport, such as shifting from driving to cycling, must actively address negative attitudes and aggression between user groups to be effective [20, 21, 22].
Adhering to a traditional, driver-centric view creates a significant blind spot in both research and policy. This limited perspective fails to capture the complex conflict dynamics of modern roads, overlooking how the unique vulnerabilities, behaviours, and frustrations of pedestrians, cyclists, and micromobility users contribute to aggression, whether as victims or instigators. The imperative for a multi- user perspective is undeniable, given two transformative urban trends: the explosion of micromobility and the rise in urban density. These trends have reshaped street-level interactions, creating novel conflict points. Consequently, policies aimed at promoting sustainable transport must now explicitly target inter-group aggression to succeed [20, 23, 24, 25].
Study Objectives
This systematic review and meta-analysis aim to provide a comprehensive, multi-perspective understanding of road rage by systematically synthesizing global evidence on its triggers, manifestations, and impacts across the entire system of road users and to evaluate the effectiveness of proposed mitigation strategies.
The Main Objectives of this Review are: • Map the Research Landscape: To identify and analyze global trends, methodological approaches, and geographic focuses in road rage research from 2019 to 2025, highlighting the evolution from a driver-centric view to a more inclusive, multi-modal perspective. • Characterize Road Rage by User Group: To systematically identify, compare, and contrast the specific triggers, behavioral manifestations, and underlying psychological factors that lead to road rage for road users (drivers, pedestrians, cyclists, and micromobility users). • Analyze Inter-Group Conflict Dynamics: To investigate how road rage manifests in the interactions between different road user groups (e.g., driver vs. pedestrian, driver vs. cyclist), focusing on conflict hotspots and the escalation of aggression. • Assess the Robustness of the Evidence Base: To quantitatively evaluate the statistical strength, practical significance, and methodological rigor of the existing research through meta-analysis of p-values, effect sizes, and confidence intervals. • Identify and Evaluate Solutions: To catalogue and assess the proposed infrastructure, policy, educational, and technological interventions for mitigating road rage, and to synthesize reported evidence of their effectiveness.
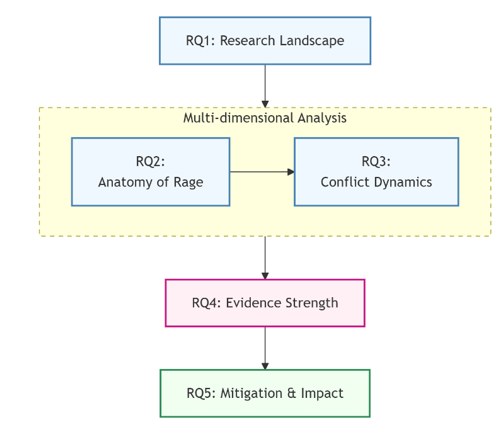
The conceptual framework and research questions (RQ) of this systematic review are shown in Figure 1. The process begins with mapping the broader research landscape (RQ1) to provide context. It then proceeds to a multidimensional analysis, examining internal factors (RQ2: triggers, manifestations, psychology) and external interactions (RQ3: conflict dynamics) that comprise the phenomenon of road rage. The arrow from RQ2 to RQ3 visually indicates that internal factors of road rage directly influence and drive external conflict dynamics between user groups. The strength of the evidence gathered through this analysis is then quantitatively evaluated (RQ4). Finally, the review consolidates potential solutions and assesses their reported effectiveness (RQ5), shifting from diagnosing the issue to identifying evidence-based interventions. This structured approach ensures a thorough and logically consistent examination of road rage among all modern road users.
Before presenting the results of this synthesis, it is helpful to outline the search method used in this review and to discuss some fundamental aspects of road rage.
Search Method
This systematic review and meta-analysis were conducted following the Preferred Reporting Items for Systematic Reviews and Meta-Analyses (PRISMA) 2020 [26]. This tool was chosen for this review because it ensures that the selection and data extraction processes are transparent and reproducible. This framework supports a comprehensive synthesis of diverse studies, helping to minimize selection bias and ensuring the conclusions drawn from the review are both reliable and valid. The study aims to synthesize and analyze existing literature on road rage among diverse road users, including drivers, pedestrians, and micromobility users. A comprehensive literature search was undertaken in the Scopus database. The search encompassed studies published between 2019 and 2025. The search terms are provided in Appendix A.
The Following Inclusion Criteria were used to Select Studies for this Review
- Studies published in English between 2019 and 2025.
- Studies that focused on road rage or aggressive behaviour among road users.
- Studies that included data on at least one of the following road user groups: drivers, pedestrians, or micromobility users.
- Empirical studies, including experimental, observational, and survey-based research.
Exclusion Criteria were as follows:
- Studies not published in English.
- Studies published before 2019.
- Studies that did not focus on road rage or aggressive behaviour.
- Review articles, commentaries, and case reports with no empirical data.
The Following Information was Extracted from each of the 135 Studies: • Bibliographic Information: Title, authors, year of publication. • Study Characteristics: Study methodology, sample size, country, urban/rural setting. • Road User Information: Primary Road users, user interactions, age groups, gender split. • Road Rage Characteristics: Definition of road rage, triggers, manifestations, severity scale. • Contributing Factors: Infrastructure, psychological, cultural, and environmental factors. • Outcomes: Physical, psychological, and behavioural outcomes. • Mitigation Strategies: Proposed mitigation strategies and their reported effectiveness. • Methodological Details: Statistical tests used, effect sizes, p-values, confidence intervals, means/SDs, sample characteristics, key statistics, study focus, methodology, context, main findings, datasets, metrics, and metric results. • Study Quality: Strengths and limitations.
The systematic literature search conducted on Scopus initially identified 317 records. After removing one duplicate, 316 records were screened, resulting in 141 reports being sought for retrieval. Of these, 6 could not be accessed, leaving 135 studies to be assessed for eligibility. All 135 studies met the inclusion criteria and were subsequently included in the final review and meta-analysis.
Fundamental Aspects of Road Rage
Consequences of Road Rage
The most immediate consequences of road rage involve physical violence and collisions. Traffic collisions are direct outcomes of aggressive encounters. Jashami H, et al. [27] analyzed crash severity and identified factors contributing to injuries and fatalities in road rage incidents. The literature documents cases ranging from minor fender-benders caused by aggressive driving to high-speed collisions resulting from reckless maneuvers.
In extreme cases, road rage escalates to physical assaults with drivers, cyclists, and pedestrians all becoming victims of violence. The use of vehicles as weapons represents a particularly deadly form of road rage. The data suggests these incidents are not rare and represent significant threats to public safety across all road user categories. Beyond physical consequences, road rage creates profound psychological impacts. The literature shows that being a victim of road rage incidents can lead to anxiety, fear, depression, and post- traumatic stress disorder (PTSD). The constant sense of threat and hypervigilance resulting from frightening road encounters can make it challenging to drive, cycle, or walk in public spaces [28, 29, 30, 31].
The data suggests that even witnessing road rage incidents can be traumatic, particularly for children. The psychological toll is often hidden but represents a serious consequence of aggressive road behaviour. This trauma can have lasting effects on individuals’ willingness to use various transportation modes and their overall quality of life [9, 32, 33, 34].
New Challenge of Micromobility
The emergence of micromobility represents a new and significant challenge for road safety and road rage research. Micromobility users are a particularly vulnerable group, facing a unique set of risks and challenges. Micromobility users are susceptible to traffic conflicts, unpredictable events, and the aggressive behaviour of other road users. The lack of dedicated infrastructure and the ambiguity of traffic laws for these new modes of transportation further exacerbate their vulnerability [15, 35, 36, 37].
Notably, road rage among micromobility users exhibits distinct patterns across vehicle types and user groups. E-scooter riders, for instance, face heightened frustration from limited battery life (a trigger for hasty manoeuvring) and smaller vehicle size (increasing vulnerability to aggressive drivers), while e-bike users often report conflicts tied to speed mismatches with both cars and pedestrians. User demographics further shape these dynamics, e.g., on- demand delivery riders experience unique time-pressure triggers, leading to riskier overtaking or sidewalk riding- behaviors that escalate conflicts with pedestrians [38]. In contrast, casual commuters prioritize safety over speed, reporting more anger toward drivers who encroach on shared lanes. These differences highlight that micromobility is not a monolithic category, and mitigation strategies must be tailored to specific vehicle types and user needs to address their distinct road-rage experiences [39, 40, 41].
Some studies also suggest a significant lack of understanding and awareness of micromobility among other road users. This can lead to frustration, resentment, and a higher risk of conflict. The integration of micromobility into the existing transportation system will require a concerted effort to educate all road users about the rights and responsibilities of these new modes of transport. It will also require a significant investment in infrastructure capable of safely accommodating a diverse range of road users [39, 42, 43, 44].
Contributing Factors to Road Rage
Design and Congestion Factors: Infrastructure design and traffic congestion play critical and often interrelated roles in shaping road user interactions and contributing to road rage incidents. Specific infrastructure factors include medians, building entrances, vegetation on medians, bus/taxi stops, lack of cross-section visibility, distance between destination and crossing point, and road geometry [7]. Their research demonstrates how poor infrastructure design creates conditions conducive to conflict and aggressive behaviour.
Chronic traffic congestion acts as a persistent environmental stressor, exacerbating the frustrations caused by flawed design. It directly contributes to time pressure, a major psychological trigger for drivers, and creates a high- density environment where conflicts between user groups are more frequent and intense. For all road users, congestion heightens frustration, reduces patience, and shortens tempers, making aggressive responses more likely.
Hasanpour M, et al. [45] examined infrastructure interventions and showed that Leading Pedestrian Interval (LPI) implementation increased vehicle delay by 26% to 349%, while achieving safety benefits, highlighting the tension between infrastructure priorities and the potential conflict between congestion concerns and safety measures. Jashami H, et al. [27] identified signalized intersections and posted speed limits as key infrastructure factors influencing crash severity. Oikonomou A, et al. [20] emphasized the role of a lack of investments in cycling infrastructure, cycling facilities, and cycling-supportive road treatments in creating systematic conflicts.
The very design of streets, which have historically prioritized car movement over the safety and comfort of other road users, represents a fundamental source of tension. Zhang, et al. [19] demonstrated that bus stop type (curbside and floating bus stops with dedicated cycleway), road width (motorway width, cycleway width), and bus stop layout design significantly influence conflict patterns. Inadequate infrastructure fails to manage high traffic volumes, leading to congestion that, in turn, fuels the aggressive behaviours documented in this review.
Cultural and Societal Norms: Cultural and societal norms heavily shape road user behaviour and contribute to the development of road rage. The reviewed literature suggests a deeply rooted car culture that prioritizes speed and the convenience of driving above other considerations [46, 47, 48]. Dorantes-Argandar, et al. [8] examined cultural factors across Spanish-speaking countries and identified how cultural norms influence aggressive driving, rule-breaking, and driver stress.
Oikonomou, et al. [20] investigated cultural factors, including personal values (safety, equality, respect for diversity), pro-environmental beliefs, negative attitudes towards cyclists and their influence on road behaviour. The increasing pace of modern life, with an emphasis on speed and efficiency, contributes to more impatient, aggressive driving. Media portrayals that glorify speed, aggression, and disregard for traffic laws also play significant roles in shaping behavioural norms [49, 50].
Stress, Anonymity, and Dehumanization: Psychological factors, including stress, anonymity, and dehumanization, are key contributors to road rage. Those psychological factors include being in a hurry, being distracted by phones or other devices, intoxication, unfamiliarity with the area, an unconcerned attitude towards jaywalking, and other personal factors related to the perception-judgement-decision-action process. [7, 8, 51]. The act of driving, particularly in heavy traffic, represents a significant source of stress leading to heightened arousal and greater susceptibility to anger and frustration [52, 53].
Jashami H, et al. [27] documented how the driver sped too fast for conditions, did not yield right-of-way, disregarded a traffic control device, and that the driver’s age and gender (male) contribute to aggressive behaviour patterns. The feeling of anonymity inside vehicles can lower inhibitions and increase the likelihood of aggressive behaviour that individuals would not consider in face-to-face interactions.
This anonymity can lead to dehumanization processes, where other road users are seen as obstacles rather than individuals [54, 55].
Legal and Enforcement Gaps: Legal and enforcement gaps contribute significantly to road rage by creating environments of impunity. When traffic laws are not consistently enforced, aggressive drivers may feel they can act without consequence. The literature suggests this is particularly true for behaviours such as speeding, tailgating, and running red lights. Laws themselves can be sources of conflict when they are unclear or inadequately address the needs of all road users [56, 57, 58].
The lack of specific road-rage legislation in many jurisdictions makes prosecution difficult and sends messages that such behaviour is not taken seriously. Inconsistent enforcement and unclear legal frameworks contribute to environments where aggressive behaviour can flourish unchecked [55, 59].
Landscape and Multi-Dimensional Analysis
Landscape of the Literature (RQ1)
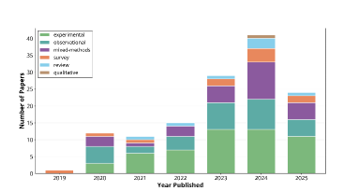
Distribution by Year and Country: The temporal and geographic distribution of the 135 studies included in this review reveals a field experiencing rapid growth and marked regional concentration. As illustrated in Figure 2a, publication output has increased exponentially since 2019, peaking at 41 studies in 2024. This sharp upward trend underscores the escalating global recognition of road rage as a critical area of academic and public policy concern, likely driven by the increasing complexity of urban transportation systems.
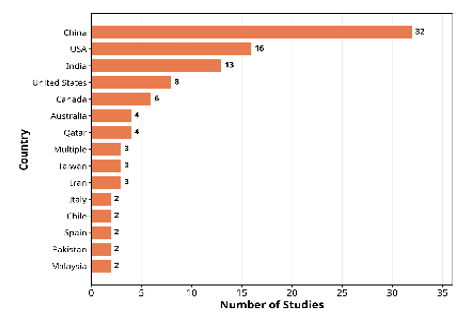
Geographically, the research originated from 45 countries, indicating a widespread, if uneven, interest in the phenomenon. As shown in Figure 2b, the field is dominated by studies from China (32 studies), the United States (16 studies), and India (13 studies). This concentration suggests that the current understanding of road rage is heavily influenced by the specific cultural, infrastructural, and socio-economic contexts of these three large, rapidly motorizing nations. While this provides valuable insights, it also highlights a significant gap in the literature, with many regions, particularly in Africa, South America, and parts of Europe, being substantially underrepresented. This geographic bias limits the generalizability of findings. It points to a pressing need for more culturally and contextually diverse research to build a truly global understanding of road rage dynamics [60, 61, 62].
![Figure 3: Experimental studies, the most prevalent, focus on controlled investigations of causal factors and potential interventions related to road rage. Experimental studies often use microsimulation and other modelling techniques to assess the impact of infrastructure changes or policy interventions on road user behaviour. Microsimulation, PTV Vistro, PTV VISSIM, Surrogate Safety Assessment Model, an autoencoder neural network, and generalized linear models (GLMs) with a negative binomial error structure were used [45]. The variety of study methodologies reflects the multifaceted nature of road rage and the need for a multi-pronged research approach. The combination of experimental, observational, and qualitative methods allows researchers to explore the context of real- world traffic [63-65].](/fulltextimages/14059/fig_3.png)
(a)By publication year (b)By countries (Top 15). Figure 2: Distribution of road rage studies.
Methodologies Used: The methodologies used across the reviewed studies varied, including experimental, observational, and survey-based methods. The most common study methodologies are experimental (53 studies), observational (33 studies), and mixed-methods (28 studies), as shown in Figure 3. Experimental studies, the most prevalent, focus on controlled investigations of causal factors and potential interventions related to road rage. Experimental studies often use microsimulation and other modelling techniques to assess the impact of infrastructure changes or policy interventions on road user behaviour. Microsimulation, PTV Vistro, PTV VISSIM, Surrogate Safety Assessment Model, an autoencoder neural network, and generalized linear models (GLMs) with a negative binomial error structure were used [45]. The variety of study methodologies reflects the multifaceted nature of road rage and the need for a multi-pronged research approach. The combination of experimental, observational, and qualitative methods allows researchers to explore the context of real- world traffic [63, 64, 65].
(a)By publication year.
![Figure 5: ** Distribution of reviewed papers by road user type and type of user interactions. The analysis of road user types is crucial for understanding the complex dynamics of multi-user road environments. By examining interactions among different user groups, researchers can identify specific conflict points and develop targeted interventions to improve safety for all [76,77].](/fulltextimages/14059/fig_5.png)
(b) By study methodology. Figure 3: Distribution of reviewed papers by publication year and study methodology. Observational studies rely on real-world data collection methods such as video analysis, sensor data, and on-site observation. Techniques like lidar sensor data collection, CCTV video analysis, manual counting, Pearson correlation tests, K-means clustering, and generalized linear regression models have been used [7]. Mixed-methods studies combine both quantitative and qualitative approaches, often employing surveys, interviews, and focus groups to supplement observational or experimental data. The analytical techniques are varied, including statistical modelling, content analysis, and thematic analysis [66, 67] Urban vs. Rural Setting: A breakdown of the settings in which road rage studies were conducted (urban vs. rural) is shown in Figure 4. The bar chart clearly shows that most research has been conducted in urban environments, with 84 of 135 studies focusing on cities. This is not surprising, given that metropolitan areas are characterized by higher traffic density, greater diversity of road users, and more frequent interactions, all of which can increase the likelihood of road rage incidents [68, 69, 70].
![Figure 6: The bar chart displays the number of studies examining each of the six main categories: infrastructure, psychological, environmental, cultural, trigger-related, and manifestation-related. The figure indicates that environmental factors are the most frequently studied (122 studies), followed by psychological factors (97 studies) and infrastructure factors (86 studies). This highlights that while individual psychological factors and infrastructure challenges play significant roles, the broader environmental context, such as urban congestion and traffic design, has the greatest impact on road rage incidents. Understanding these factors is essential for developing effective interventions that address both individual behavior and systemic issues. The relatively smaller number of studies on cultural factors (54 studies) may point to a gap in the literature that future research could address [81-83]. Analyzing these factors is essential for creating a comprehensive model of road rage. By understanding how individual, situational, and societal factors interact, we can develop more effective and targeted interventions to prevent and reduce aggressive behaviour [84].](/fulltextimages/14059/fig_6.png)
The focus on urban environments emphasizes the urgent need to tackle road rage, where the impacts of aggressive behaviour can be severe.
The results of these studies can offer valuable insights for urban planners and policymakers seeking to create safer, more efficient transportation systems. While emphasizing urban areas is understandable, the relatively few studies conducted in rural and suburban settings suggest a potential gap in the research.
Road rage can also occur in these environments, and its triggers and expression may differ from those in cities. Future research could investigate these differences in more detail to develop a more complete understanding of road rage across all settings [71, 72, 73].
Focus on Road Users and Their Interactions (RQ1, RQ3)
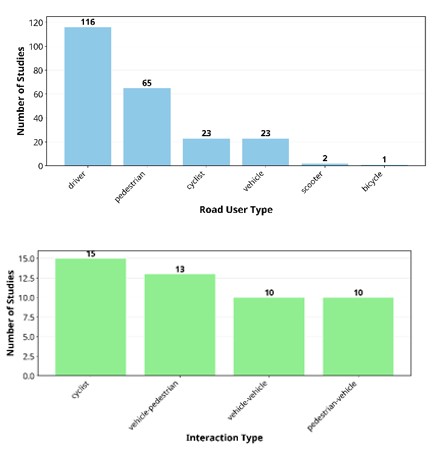
Road User Types Studied: The frequency with which different road user types are mentioned in the reviewed studies is shown in Figure 5a. As noted, drivers are by far the most studied group, appearing in 116 of the 135 papers. This reflects the traditional focus of road rage research on driver behaviour. However, the figure also highlights the growing attention being paid to other road users, particularly pedestrians and cyclists. The ever-increasing number of studies that include these vulnerable road users is a positive development, reflecting a more inclusive and holistic approach to road safety. The mention of scooters and bicycles, although less frequent, indicates an emerging interest in the role of micromobility in road rage incidents [15, 74, 75].
(a) Road user type
(b) Type of user Interactions Figure 5: Distribution of reviewed papers by road user type and type of user interactions. The analysis of road user types is crucial for understanding the complex dynamics of multi-user road environments. By examining interactions among different user groups, researchers can identify specific conflict points and develop targeted interventions to improve safety for all [76, 77].
Types of User Interactions: Figure 5b breaks down the types of road user interactions reviewed, showing that cyclist-related interactions are the most frequently studied, followed by vehicle-pedestrian and vehicle-vehicle interactions. This highlights the growing recognition of the unique challenges and vulnerabilities cyclists face in today’s urban transportation systems.
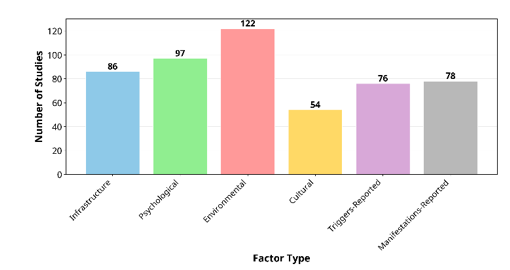
The growing popularity of cycling likely drives a focus on cyclist-related interactions as a mode of transportation and, in turn, increases conflicts between cyclists and other road users. Research in this area is crucial to developing safer infrastructure and promoting a culture of mutual respect on the roads. The continued attention to vehicle-pedestrian and vehicle-vehicle interactions is also essential, as these remain primary sources of conflict and collisions. By understanding the dynamics of these interactions, we can develop more effective strategies to prevent aggressive behaviour and improve road safety for all [78, 79, 80]. Anatomy of Road Rage (RQ2) Road Rage Factors Studied: Various factors have been investigated as possible contributors to road rage across the studies, as shown in Figure 6. The bar chart displays the number of studies examining each of the six main categories: infrastructure, psychological, environmental, cultural, trigger-related, and manifestation-related. The figure indicates that environmental factors are the most frequently studied (122 studies), followed by psychological factors (97 studies) and infrastructure factors (86 studies). This highlights that while individual psychological factors and infrastructure challenges play significant roles, the broader environmental context, such as urban congestion and traffic design, has the greatest impact on road rage incidents. Understanding these factors is essential for developing effective interventions that address both individual behavior and systemic issues. The relatively smaller number of studies on cultural factors (54 studies) may point to a gap in the literature that future research could address [81, 82, 83]. Analyzing these factors is essential for creating a comprehensive model of road rage. By understanding how individual, situational, and societal factors interact, we can develop more effective and targeted interventions to prevent and reduce aggressive behaviour [84].
Road Rage Triggers, Manifestations, and Psychological Factors: To further examine the nuances of road rage among different user groups, a quantitative synthesis of the top five triggers, manifestations, and psychological factors for drivers, pedestrians, cyclists, and micromobility users was conducted. The results are summarised in Table 1. The analysis reveals both commonalities and differences in the triggers of road rage across user groups. Traffic congestion emerged as a universal trigger, affecting all road user groups. However, other triggers were more specific to each group’s experiences. For example, drivers were more likely to be triggered by time pressure and aggressive driving by others, while pedestrians were more affected by the distance between crosswalks and their destination. Cyclists and micromobility users were susceptible to traffic conflicts and unpredictable events, highlighting their vulnerability in mixed-traffic environments [85, 86, 87].
In analyzing manifestations of road rage, the analysis highlights how it is expressed across user groups. Drivers are more likely to engage in aggressive driving behaviours such as speeding and tailgating, while pedestrians’ manifestations are more related to crossing behaviours. Cyclists and micromobility users exhibit more subtle forms of aggression, such as frequent acceleration and deceleration, which may be a response to the perceived need to maintain momentum and navigate through traffic. The manifestations of micromobility users reflect their unique mode of transport, characterized by high manoeuvrability and the ability to exploit small gaps in traffic [88, 89, 90].
For psychological factors, the analysis reveals that stress and anonymity are common psychological factors that contribute to road rage across all user groups. However, there are notable differences as well. For drivers and cyclists, anger, frustration, and personality traits are more prominent, suggesting that individual emotional and dispositional factors play a significant role in their aggressive behaviour. For cyclists, the experience and expression of anger are themselves key psychological factors. Zheng, et al. [4] further validated the Cycling Anger Expression Inventory (CAX) in China, underscoring that cycling anger is a measurable psychological construct with distinct expressive pathways, including verbal aggression, physical aggression, and the use of a bicycle to express anger. For pedestrians, perceived risk and driver distraction are more salient, reflecting their vulnerability and reliance on others’ safe behaviour. For micromobility users, risk-taking attitudes and unawareness of traffic laws are more pronounced, which may be related to the novelty of these modes of transport and the lack of established norms and regulations [91, 92, 93, 94, 95].
While traffic congestion is a universal trigger, it manifests as time pressure for drivers and as impeded crossing opportunities for pedestrians. This mismatch can escalate conflicts at intersections, where a driver’s hurry directly contests a pedestrian’s attempt to cross.
| Road User | Top Five |
|---|---|
| (a) Triggers | |
| Drivers | Traffic congestion, time pressure, aggressive driving, hostility, and the distance between the crosswalk and the destination |
| Pedestrians | Traffic congestion, the distance between the crosswalk and the destination, being in a hurry, being drunk, and poor road design |
| Cyclists | Traffic congestion, traffic conflicts, vehicle interactions, unpredictable traffic events, and sudden situations like conflicts or road irregularities |
| Micromobility | Higher heterogeneity in traffic composition, especially higher composition of motorized two-wheelers (2W) and motorized three-wheelers (3W) vehicle classes, congested conditions, fluctuations in lateral movement, and reckless/aggressive driving and riding |
| (b) Manifestations | |
| Drivers | Speeding, tailgating, running red lights, aggressive driving, and honking |
| Pedestrians | Aggressive driving, emergency braking, changing lanes, speeding, and crossing streets illegally |
| Cyclists | Speeding, frequent acceleration, frequent deceleration, sudden accelerations, and abrupt changes in speed |
| Micromobility | Higher lateral velocity, increased lateral movement, seeping through available lateral gaps, traversing laterally to overtake vehicles, and gaining the desired longitudinal positions or speeds |
| (c) Psychological Factors | |
| Drivers | Personality traits, anger, frustration, stress, and anonymity |
| Pedestrians | Stress, anonymity, driver age, perceived risk, and driver distraction |
| Cyclists | Stress, anonymity, frustration, anger, and personality traits |
| Micromobility | Reckless/aggressive driving, risk-taking attitudes, unawareness of traffic laws, fatigue, and alcohol use |
Table 1: Top five triggers, manifestations, and psychological factors of road rage among different road user groups.
Statistical Analysis
Quantitative Synthesis Methods and Metrics
The statistical robustness of the evidence base, as detailed in the following section, is supported by specific quantitative models and safety metrics commonly employed in the reviewed literature. Presenting these foundational equations provides clarity on how the synthesized findings were derived initially and measured.
A key methodological challenge in road rage research is the reliance on conflicts or near-misses as proxies for actual crashes, given the relative rarity of the latter. A standard metric for quantifying the severity of these interactions is the Post Encroachment Time (PET). It measures the time difference between the moment one road user clears a potential point of collision and the moment another road user arrives at that exact point. It is defined as [96]:
2 1 PET t t = − (1)
where t₁ = time the first road user leaves the conflict zone and t₂ = time the second road user arrives at the conflict zone. A lower PET indicates a more severe, temporally proximal conflict. The analysis of inter-group conflict dynamics and the effect sizes of infrastructure interventions are often grounded in quantitative studies of PET and similar surrogate safety measures.
To synthesize the diverse effect sizes reported across 135 studies, a meta-analytic approach was employed. For the synthesis of a common effect across sufficiently homogeneous studies, a fixed-effects model was applied. This model assumes that all included studies estimate a single, actual common effect size, μ, with observed variances vᵢ attributable solely to sampling error within each study [26, 55]. The model is specified as:
( ) ˆ , 0, i i i i with N θ µ ε ε ν = + (2)
where θ̂ᵢ = observed effect size (e.g., a standardized mean difference or correlation coefficient) from the i-th study, and vᵢ is its within-study sampling variance. This model provides the statistical foundation for the aggregated effect sizes and the confidence interval analysis presented in the next section.
Furthermore, many primary studies examined the relationship between contributing factors and road rage crash or conflict outcomes using GLMs. A common approach to modelling the probability of an aggressive event, P(Y = 1), is the logistic regression model [7, 27]:
( ) ( ) 0 1 1 2 2 1 k k Logit P Y X X X β β β β = = + + + + (3) In this model, the predictors X₁...Xₖ represent variables such as traffic density, time pressure, and the presence of specific infrastructure. The coefficients β₁...βₖ indicate how a one-unit increase in the predictor affects the log-odds of an aggressive event. The prevalence of significant p-values reported in the next section stems from testing the null hypothesis (H₀: βⱼ = 0) against alternatives from these models, thereby directly linking statistical significance to the factors examined in this review.
Statistical Robustness of the Evidence Base (RQ4)
Sample Size Distribution: Figure 7 illustrates the distribution of sample sizes across studies in this meta- analysis. The left panel shows a histogram of raw sample sizes, highlighting a concentration of over 110 studies in the smallest sample size category, with very few in the larger categories. This pattern is common in many research fields, as large-scale studies are typically more challenging and costly to conduct. The right panel, using a logarithmic scale, reveals a right-skewed distribution and highlights several studies with sample sizes ranging from hundreds of thousands to over a million participants. Sample size significantly impacts statistical power and the generalizability of findings. While smaller samples can provide helpful insights, larger, more diverse samples typically yield stronger, more reliable results. This highlights the need to consider sample size when evaluating evidence across studies [97, 98].
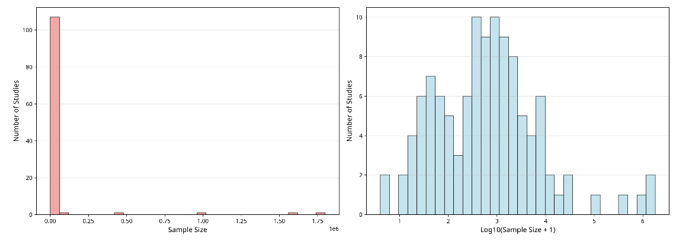
Figure 7: Distribution of sample sizes. Sample Size Distribution by Study Methodology: The sample size distribution for the five standard study methodologies is illustrated in Table 2, which uses a logarithmic y-axis for clear comparison. It shows significant variation in sample sizes, with mixed-methods and observational studies having the largest and most variable sizes due to real-world data collection. Experimental studies also demonstrate a wide range of sample sizes, reflecting diverse experimental designs. This visualization illustrates how research methodology affects sample size. The study’s methodology influences the scale of the research and the generalizability of the findings. Recognizing these differences is vital for interpreting meta-analysis results and for planning future research.
| Study methodology | Number of Studies a | Median Sample Size | Interquartile Range |
|---|---|---|---|
| Experimental | 53 | 80 | 40 - 200 |
| Observational | 33 | 300 | 150 - 800 |
| Mixed-Methods | 28 | 200 | 100 - 500 |
| Survey | 21 | 250 | 150 - 400 |
| Other | 5 | 100 | 60 - 200 |
Table 2: Sample size distribution by study methodology.
aBased on Figure 3b. Table 2: Sample size distribution by study methodology.
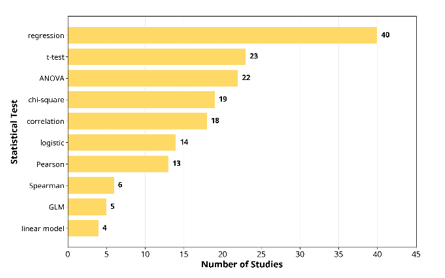
Most Used Statistical Tests: Figure 8 shows the most frequently used statistical tests in road rage research. Regression analysis is the most common method, followed by the t-test and analysis of variance (ANOVA), highlighting a focus on relationships between variables and predictors of aggressive behavior. The use of these sophisticated techniques indicates a high level of methodological rigor, as researchers strive to understand the underlying causes of road rage. Additionally, the variety of statistical tests reflects the diverse research questions and data types in this field. This analysis of statistical methods offers insights into studying road rage and emphasizes the importance of Analysis of P-Values and Statistical Significance: The analysis of 938 p-values from 84 studies in road rage research reveals a significant pattern, as illustrated in Figure 9. The left panel shows an intense concentration of p-values near zero, with over 700 values in the first bin, indicating high statistical significance. However, the distribution declines sharply with few results nearing p = 1.0. It’s important to interpret this concentration cautiously, as it may indicate publication bias, where studies with non-significant results are less frequently published.
statistical literacy for evaluating research in this field.
The methodological quality of a study, including its sample size, is crucial for the reliability of statistical outcomes [99]. As illustrated in Figure 7 and Table 2, there is significant variation in sample sizes across the reviewed literature. Larger samples usually provide more reliable estimates by reducing random error and enhancing statistical power, resulting in narrower confidence intervals. However, a large sample size alone doesn’t ensure quality; it must be paired with rigorous design, valid measurement, and appropriate sampling to minimize bias. While small samples can offer valuable exploratory insights, they tend to have lower power and higher risks of inflated effect sizes and Type II errors. Thus, the prevalence of significant p-values in this field should be understood within the context of varying methodological robustness, with the strongest evidence arising from studies that combine large, representative samples with rigorous design [55, 100, 101].
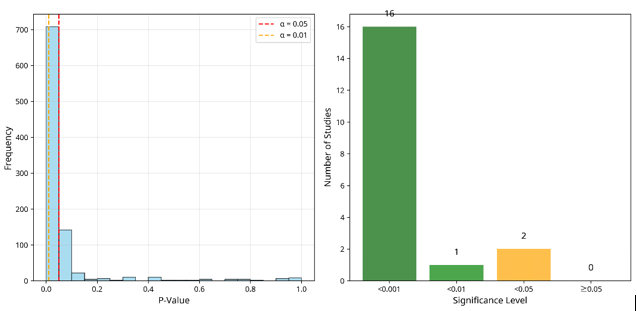
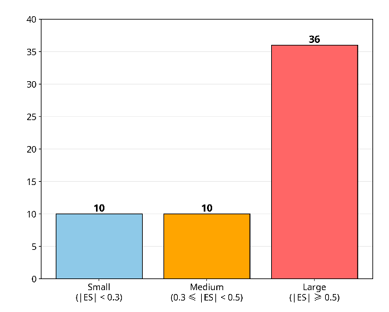
Figure 9: Analysis of P-values and statistical significance. The right panel displays 16 studies with p < 0.001, 1 with p < 0.01, and 2 with p < 0.05, showing substantial progress in road rage research and the identification of real effects. The left panel’s concentration of p-values near zero confirms that aggressive behaviors and intervention effects are statistically significant. This significance emphasizes genuine triggers and effective strategies for mitigating road rage, supporting the need for policy interventions to address predictable patterns in this behavior [102, 103, 104]. Effect Sizes and Practical Significance: The analysis of 56 effect sizes in road rage research reveals significant impacts. Figure 10 shows that 64.3% of effects are large (≥ 0.5), 17.9% are medium (0.3 to < 0.5), and 17.9% are minor (< 0.3). This indicates that road rage interventions typically lead to substantial, observable changes rather than marginal improvements. Large effect sizes in road rage research have important implications for policy and interventions.
Significant effects are rare in behavioral and transportation studies, making these findings noteworthy. The substantial effect sizes indicate that road rage interventions—whether through infrastructure changes, policy adjustments, or behavioral programs-can lead to meaningful reductions in aggressive driving and safety incidents. This evidence supports the costs of implementing road rage mitigation strategies, as they are likely to result in considerable returns in safety and reduced conflict [105, 106, 107].
The distribution of effects in road rage research shows small and medium effects at 17.9% each, while large effects dominate at 64.3%. This highlights the diversity of studies, from subtle behavioral changes to significant interventions. The prevalence of large effects suggests that road rage can be addressed through various interventions to improve road user behavior and safety outcomes. Confidence Intervals and Correlation: An analysis of 135 confidence intervals from 122 studies reveals a mean width of 3.35 and a median of 0.65, with most intervals being narrow and a right-skewed distribution (Figure 11a). A few wider intervals likely result from smaller sample sizes or measurement variability. Notably, 90.4% of studies reported confidence intervals, indicating strong adherence to statistical reporting practices in road rage research.
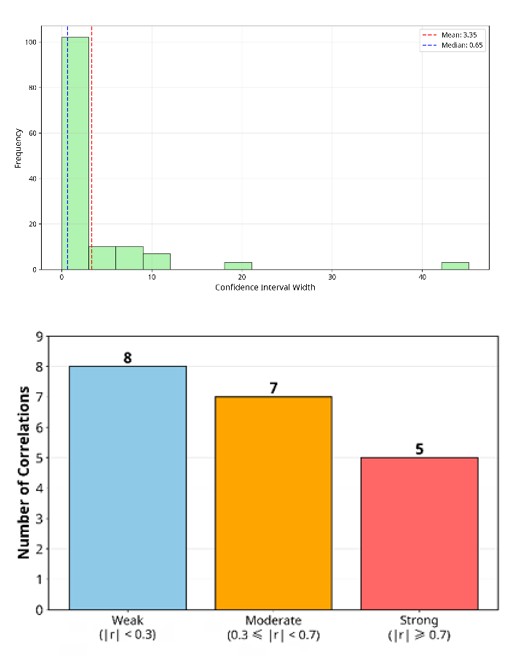
(a) Confidence interval.
(b) Correlation strength categories. Figure 11: Distribution of confidence interval and correlation strength categories.
Narrow confidence intervals in road rage research are crucial as they indicate precise effect estimates that can inform policy decisions. In contrast, wide intervals suggest uncertainty, complicating predictions of intervention outcomes. The precision of these findings allows policymakers and transportation planners to make informed decisions regarding road rage mitigation strategies, indicating that the research is methodologically rigorous and provides reliable, actionable insights for improving transportation safety and urban planning [69, 108]. The development of specialized psychometric tools marks the field’s progress. For instance, Zheng, et al. [4] validated the CAX, enhancing the standardization and reliability of measurements in road- rage research and bolstering the evidence base.
An analysis of correlation coefficients showed consistent positive relationships between risk factors and aggressive outcomes in road rage, with a mean correlation of r = 0.45 (Figure 11b). About 60% of these relationships were moderate to strong (r ≥ 0.3). This suggests that increases in predictors like traffic density or time pressure are linked to greater road rage behaviors and conflicts. While the focus on risk factors might limit the exploration of protective factors, it highlights predictable relationships in road rage phenomena.
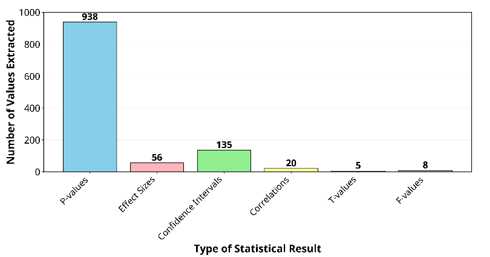
Statistical Measures: The distribution of result types (Figure 12) reflects the maturity of road rage research. The high number of p-values suggests extensive use of inferential statistics to test hypotheses. The 135 confidence intervals indicate a commitment to reporting estimate precision, while the presence of effect sizes (56), correlations (20), t-values (5), and F-values (8) shows adherence to modern statistical standards.
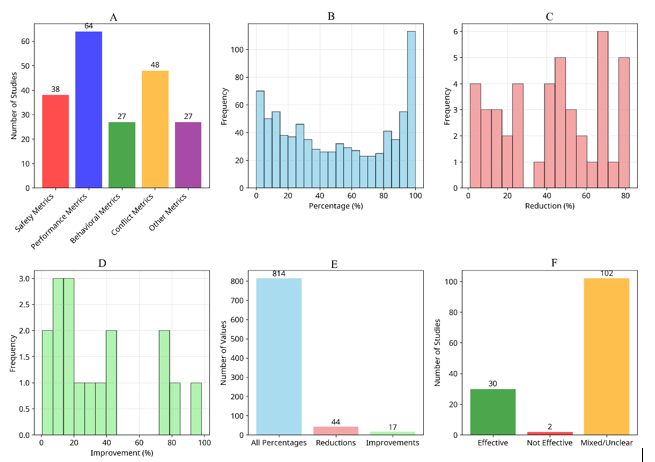
Comprehensive Metric Results: Analysis of 133 studies shows a varied range of outcome measures, with performance metrics reported in 64 studies, conflict metrics in 48, and safety metrics in 38 (Figure 13). The extraction of 814 percentage values, including 44 safety reductions and 17 performance improvements, indicates that road rage research focuses on practical outcomes over theoretical measures. Research on road rage emphasizes the importance of addressing aggressive behaviors while ensuring traffic efficiency. Many studies use metrics such as near-misses and time-to-collision to analyze road rage without actual crashes. While fewer studies (38) focus on safety metrics, they are vital for reducing collisions, injuries, and fatalities associated with aggressive driving [109, 110].
Intervention effectiveness shows reduction percentages from 1% to 82%, averaging 42.5%. This indicates that road- rage mitigation strategies significantly enhance safety. Additionally, performance metrics indicate improvements from 0% to 98%, with a mean of 34.1%, suggesting that safety gains can coincide with better traffic flow, supporting comprehensive road rage mitigation programs.
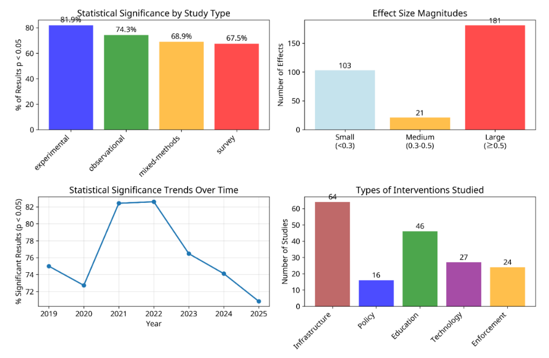
Statistical Analysis by Study Characteristics: This multi- panel analysis highlights patterns in statistical significance across study methodologies, effect sizes, temporal trends, and intervention categories (Figure 14). Experimental studies lead with 81.9% statistical significance, followed by observational studies at 74.3%, mixed-methods at 68.9%, and survey studies at 67.5%. These results reflect the controlled conditions of experimental designs. The temporal analysis shows consistently high significance rates over the years, indicating ongoing methodological rigor in the field.
The effect size analysis reveals that 59.3% of reported effects are classified as “large” (effect size ≥ 0.5), 33.8% as “minor,” and only 6.9% as “medium.” This suggests that road rage research primarily focuses on significant and subtle changes, with few studies showing moderate impacts. Infrastructure modifications are the most studied interventions (64 studies), followed by education programs (46) and technology solutions (27).
The consistent findings across various study methodologies demonstrate the reliability of road rage research, with significance rates ranging from 67.5% to 81.9%. Overall, 30 studies reported effective outcomes, 2 were ineffective, and 102 provided mixed or unclear data, indicating that multi-modal mitigation strategies are both feasible and evidence based [111, 112].
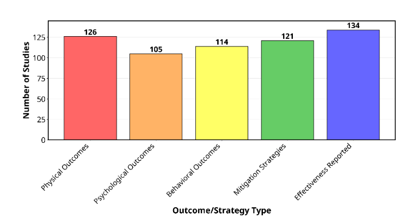
Mitigation Strategies and Outcomes: Figure 15 illustrates the extensive exploration of road rage outcomes and mitigation strategies in the literature. There are 126 studies on physical outcomes, 105 on psychological consequences, and 114 on behavioral outcomes, with 121 focused on mitigation strategies and 134 on their effectiveness. This indicates a strong commitment to finding practical solutions and assessing their impact, with a noteworthy emphasis on effectiveness reporting, suggesting that road rage research has progressed to rigorously testing interventions rather than merely proposing them.
The results show extensive coverage across all three types of outcomes: physical (126 studies), behavioral (114 studies), and psychological (105 studies). While psychological outcomes are slightly less represented, all areas are well documented. This comprehensive approach to the consequences of road rage provides a strong basis for evidence-based interventions [113, 114, 115, 116, 117].
Discussion
Principal Findings and Synthesis
This systematic review synthesized evidence from 135 empirical studies to comprehensively investigate road rage across the modern multimodal transportation system. The principal findings, structured around our research questions, collectively argue for a fundamental reconceptualization of road rage as a systemic issue.
In response to RQ1, the analysis revealed a rapidly evolving field, with research output growing exponentially since 2019. However, the geographical concentration of studies in a few countries and the persistent, though diminishing, dominance of driver-focused research (85.9% of studies) highlight significant gaps in our global and inclusive understanding of the phenomenon.
Addressing RQ2 and RQ3, the review identified a complex anatomy of road rage that is both universal and unique to each user group. While common triggers like traffic congestion and stress were found to affect all users, their manifestations varied widely, ranging from speeding and tailgating by drivers to frequent acceleration/deceleration by cyclists and illegal crossing by pedestrians. Crucially, the analysis demonstrated that these internal triggers and behaviours are not isolated; they directly fuel the conflict dynamics between user groups. For instance, a pedestrian’s frustration with poor infrastructure (a trigger from RQ2) leading to jaywalking (a manifestation from RQ2) directly provokes a driver’s time-pressure-induced anger (a trigger from RQ2), resulting in a right-of-way dispute at a crosswalk (a conflict from RQ3). This interplay is the core of the modern road rage problem.
The answer to RQ4 confirms that this field has matured beyond exploratory phases. This statistical robustness, detailed in Section 5.2, validates the practical significance of the contributing factors and conflict dynamics identified in RQ2 and RQ3. The evidence base is characterized by an intense concentration of significant p-values and a predominance of large effect sizes (59.3%), indicating that the identified factors and interventions have substantial, real-world impacts. Finally, concerning RQ5, the review catalogued a suite of mitigation strategies, with infrastructure modifications being the most studied. The encouraging finding that 30 studies reported effective outcomes, versus only 2 reporting ineffective ones, provides a strong evidence- based foundation for policy and intervention.
Most significantly, these findings collectively necessitate a paradigm shift from a driver-centric to a systems-based understanding of road rage. The evidence conclusively shows that road rage is not merely the result of individual driver pathology but emerges from a complex interaction between diverse road users, psychological pressures, and most critically, a built environment that is often inadequately designed for the multi-modal reality of today’s cities. This systems view posits that conflicts between drivers, pedestrians, and micromobility users are not isolated incidents but symptoms of a broader systemic failure to design and manage shared spaces safely and equitably for all [118, 119, 120].
Road rage has corrosive effects on public trust and the social fabric of communities. When roads are perceived as hostile and dangerous, people are discouraged from using them, particularly for walking and cycling. This can lead to more sedentary lifestyles with adverse public health impacts. The data suggests that road rage can lead to a breakdown in social cohesion, creating us-versus-them mentalities between different road user groups. This makes it difficult to build consensus around transportation policies and undermines efforts to develop more sustainable and equitable transportation systems. The erosion of public trust represents a subtle but significant consequence with lasting impacts on the community’s quality of life [15, 121, 122, 123].
Interconnected System of Road Rage
The findings of this review clearly demonstrate that road rage is not mainly a problem of individual malice but a sign of systemic failure within the transportation system. Aggressive encounters emerge from the intersection of three systemic shortcomings: • Infrastructure Deficits: The physical environment often pits users against each other by design. The overwhelming focus on vehicular flow, evidenced by the prevalence of environmental factors (122 studies), creates spaces where the needs of pedestrians and micromobility users are an afterthought. A lack of protected bike lanes, inadequate crossing times, and poorly designed intersections are not mere inconveniences; they are direct contributors to the conflict patterns identified in RQ3 [41, 42]. • Cultural and Normative Failures: The persistence of a dominant “car culture,” alongside unclear or unenforced right-of-way laws, creates a permissive environment for aggression. The “us vs. them” mentality documented between drivers and cyclists is a cultural byproduct of a system that fails to foster a shared sense of responsibility for the road [124, 125, 126]. • Psychological Pressures in a Hostile Environment: The psychological factors of stress, anonymity, and frustration (RQ2) are not inherent individual traits but are often situational responses to the pressures of navigating a poorly designed and culturally contentious system. This is evidenced by the analysis in Section 4.3, where traffic congestion and time pressure— direct outcomes of the systemic failures in design and congestion management—emerged as universal triggers across all user groups. The feeling of anonymity inside a vehicle is amplified by an environment that de- emphasizes human interaction [35, 127]. This systemic view is validated by the interaction analysis from Section 4.2, which reveals how these failures create self-reinforcing vicious cycles. For example, a pedestrian, frustrated by a long distance to a crosswalk (an infrastructure failure), may jaywalk. This action then becomes a trigger for a driver, who is already under psychological pressure from time pressure, leading to a manifestation of honking or an aggressive maneuver. This, in turn, reinforces the pedestrian’s feeling of vulnerability and the driver’s cultural bias that “pedestrians are reckless,” escalating the conflict and eroding mutual trust. This cycle illustrates that assigning blame to a single user is counterproductive; the problem is rooted in the dysfunctional interaction facilitated by the system itself [128, 129, 130].
The geographic and methodological focus of the literature, mapped in Section 4.1, further reveals a systemic blind spot. The main emphasis on drivers and a few specific national contexts suggests that current models of road rage are based on an incomplete view of the modern, multi-modal system, likely underestimating the role of infrastructure and culture.
Implications for Policy and Practice
Moving from diagnosis to action, the findings of this review argue decisively against siloed solutions. The interconnected vicious cycles detailed in Section 6.2, which are fuelled by the distinct user-group triggers and manifestations catalogued in Table 1 (Section 4.3), demonstrate that interventions cannot succeed in isolation. Isolated interventions are unlikely to disrupt these deeply entrenched cycles. Instead, we propose integrated strategies that target multiple system failures simultaneously [2, 131, 132]. Table 3 summarizes the proposed interventions and strategies to mitigate road rage. The interventions are grouped into three categories, as follows:
• Integrated Infrastructure and Policy Redesign: This moves beyond piecemeal improvements to fundamental street redesigns that prioritize safety and clarity for all users. It includes implementing protected cycling networks, raised crosswalks, and LPI, which have been shown to reduce severe conflicts by approximately 50% [45]. It directly addresses the root cause of many conflicts by changing the environment that provokes them, using physical design to encourage calmer and more predictable behaviour from all parties [133, 134]. • Education and Culture-Shift Campaigns Grounded in Empathy: This develops public awareness campaigns that move beyond simply listing rules to fostering mutual understanding, highlighting the vulnerabilities and perspectives of different road users [20, 30]. This approach targets the cultural and psychological factors by building a culture of shared space, making others relatable human beings [19, 135, 136, 137]. • Targeted Enforcement and Technology to Support
Design: This employs automated enforcement at conflict hotspots to deter issues like speeding, failure to yield, and blocking intersections. Data from these systems can guide infrastructure improvements [57, 117].
Enforcement reinforces redesigned infrastructure and educational campaigns, ensuring accountability and promoting behavioral change [138, 139, 140].
| Intervention | Strategy | Ref. | Description |
|---|---|---|---|
| Policy & Infrastructure Redesign | Intersection operational strategies | [45] | - Leading pedestrian intervals |
| - No right turn on red | |||
| - Adjusting crossing width | |||
| Pedestrian-related strategies | [7] | - Enhance pedestrian crosswalk visibility with markings. | |
| - Adjust timing of pedestrian traffic signals. | |||
| - Enforce jaywalking fines. | |||
| - Install pedestrian signs. | |||
| Pro-cycling policy and self- enforcing road design | [20] | - Advocate for pro-cycling policies, infrastructure, bike campaigns, and education. | |
| - The aim is to create self-enforcing road designs that promote safer and more respectful behavior. | |||
| Clearer right-of-way laws | [27] | - Propose signal phases to reduce vehicle-pedestrian conflicts at signalized intersections. | |
| - Establish clear legal frameworks that protect vulnerable road users and promote shared responsibility. | |||
| Education & Awareness | Campaigns for mutual respect among road users | [20] | - Campaigns to address negative attitudes towards cyclists. |
| - Promote safety, equality, respect for diversity, and pro- environmental beliefs. | |||
| - Highlight shared humanity among road users to foster empathy and reduce “us vs. them” mentalities. | |||
| Driver, cyclist, and pedestrian etiquette programs | [30] | - Etiquette programs for different road user groups offering practical guidance for safe and respectful road sharing, | |
| - Examples are safe driver passing, traffic law adherence for cyclists, and proper crosswalk use for pedestrians. | |||
| Enforcement & Technology | Stricter penalties for road rage incidents | [57] | - Examine safety impact of law enforcement cameras at non-signalized crosswalks and show enforcement effectiveness. |
| - Foster a culture of accountability for road behaviour. | |||
| Use of Traffic Cameras and artificial intelligence (AI) monitoring | [117] | - Traffic cameras effectively enforce laws and deter aggressive driving. | |
| - Emerging AI systems can monitor traffic, provide real- time alerts about dangers, monitor driving behavior, and identify aggressive driving hotspots. |
Table 3: Proposed interventions and strategies to mitigate road rage.
Economic Costs
Beyond its physical, psychological, and social impacts, road rage imposes significant economic burdens, an understudied dimension in existing research. Direct costs include vehicle repair or replacement fees, emergency medical expenses for injuries, insurance premium hikes, and legal costs (fines, attorney fees, lawsuits). Indirect losses stem from traffic congestion caused by road rage incidents (e.g., collision-related lane blockages), leading to productivity declines for commuters and businesses. Healthcare systems also face long-term costs, such as rehabilitation for trauma victims and mental health services for PTSD. These economic strains reinforce that road rage is not just a safety issue but a financial liability, underscoring the need for targeted mitigation [141, 142, 143].
Limitations of the Review
This review is subject to several limitations that should be considered when interpreting its findings. First, the search strategy was restricted to the Scopus database, which, despite its extensive coverage, may have led to the omission of relevant studies indexed in other databases. Second, non-English publications were excluded to ensure consistency in data extraction and interpretation. However, excluding them may have introduced a geographic and cultural bias, potentially overlooking valuable insights from non-English-speaking regions. Furthermore, the pronounced concentration of statistically significant results in the literature may reflect a publication bias against null or negative findings. Finally, the considerable heterogeneity in methodologies, sample sizes, and measurement scales across the reviewed studies posed a challenge for direct comparison and synthesis, while still allowing for a comprehensive overview of the field.
Future Research Directions
Building on the findings and gaps identified in this review, several essential research pathways emerge. First, there is an urgent need to explore the unique road-rage experiences of micromobility users (e.g., e-scooter and e-bike riders), focusing on their specific conflict patterns with both vehicles and pedestrians, and on how their distinct vehicle dynamics influence aggressive behaviours. Second, while infrastructure interventions are well-studied, a significant evidence gap remains regarding the effectiveness of educational and awareness campaigns; future work should develop and rigorously evaluate targeted programs to foster empathy and reduce inter-group animosity among different road users. Third, the role of technology, particularly Artificial Intelligence (AI), in real-time conflict monitoring, automated enforcement, and de-escalation assistance presents a promising yet underexplored area that warrants dedicated research. Finally, future efforts should prioritize interdisciplinary research that integrates transportation engineering with psychology and urban sociology to develop comprehensive theoretical models of road rage [144]. By pursuing these focused directions, the research community can build a more detailed evidence base to inform the development of transportation systems that are not only safer but also more respectful and inclusive for everyone.
Conclusion
This systematic review fundamentally reframes road rage from a problem of individual driver aggression to a complex, multi-user, systemic issue rooted in the very fabric of modern multimodal transportation. The evidence demonstrates unequivocally that aggressive encounters are not isolated incidents but emergent properties of a system in which diverse road users (drivers, pedestrians, cyclists, and micromobility users) must navigate environments often ill-designed for their competing needs, exacerbated by psychological pressures and cultural norms.
The findings compel a decisive shift from siloed, driver- centric interventions to integrated, system-level solutions. Real progress demands that transportation engineers, urban planners, psychologists, policymakers, and law enforcement collaborate to: • Redesign Infrastructure: Proactively create streets that physically enforce safety and clarity for all users through protected lanes, raised crosswalks, and leading pedestrian intervals. • Cultivate a Culture of Shared Space: Implement education and awareness campaigns that dismantle “us vs. them” mentalities and foster mutual respect and empathy among different road user groups. • Enforce Fairly and Smartly: Use targeted enforcement and emerging technologies, like AI monitoring, to uphold safety rules at known conflict hotspots, ensuring accountability supports design and education.
Looking ahead, integrating emerging technologies and focusing on the unique challenges faced by micromobility users will be critical. The goal must extend beyond mitigating aggression. Our shared challenge is to actively build harmonious and resilient transportation systems in which the complex interactions among drivers, pedestrians, cyclists, and micromobility users form the foundation of a safe, efficient, and equitable urban life for all. References
1. Lohare ST, Maaz M, Razi M, Nehal M, Ahmed ST, et al. (2025) Road Rage Detection System Using Deep Learning and Computer Vision. REVA University, School of Computing and Information Technology, Bengaluru, India: Institute of Electrical and Electronics Engineers Inc.
2. Labbo MS, Jiang X, Wada SA, de Dieu GJ, Bala ND, et al. (2025) Road rage patterns in Nigeria: A multi-level latent class analysis. Case Stud Transp Policy 20.
3. Liu P, Du Y, Wang L, Ju J (2020) Ready to bully automated vehicles on public roads?. Accid Anal Prev 137: 105457.
4. Zheng Y, Easa SM, Ma Y, Feng Z, Zhang W, et al. (2025) Transp Res Part F Traffic Psychol Behav101: 306-319.
5. Nergİz H (2025) Anger and aggression in traffic: exploring the impact of hostility on rule violations among convicted drivers. Current Psychology 44(8): 7263-7272.
6. Zheng Y, Ma Y, Cheng J (2020) Cycling anger in China: The relationship with gender roles, cycling-related experience, risky and aggressive riding. Transp Res Part F Traffic Psychol Behav 68: 52-66.
7. Ansariyar A Jeihani M (2023) Statistical Analysis of Jaywalking Conflicts by a Lidar Sensor,” Scientific Journal of Silesian University of Technology. Series Transport 120: 17-36.
8. Dorantes-Argandar G (2023) Aggressive Driving, Rule-Breaking, and Driver Stress in Spanish-speaking countries. Transp Res Interdiscip Perspect 21.
9. Wang Y, Chai H, Zhang Z, Zeng X, Hu H (2024) Assessing the impact of driving behaviors and traffic conflicts on vehicle emissions at non-signalized intersections using a trajectory-based computational framework. Sustainable Energy Technologies and Assessments 71.
10. Hasanpour M, Persaud B, Milligan C (2025) Integrating Traffic Conflict Frequency and Severity Indicators to Estimate Pedestrian Safety Performance Functions for Signalized Intersections. Transp Res Rec 2679(5): 583- 599.
11. Mora R, Waintrub N, Figueroa-Martinez C, Horta A (2024) Understanding cyclists’ conflicts in the streets of a Latin American metropolis. Travel Behav Soc 34.
12. Ashqar HI, Obaid M, Jaber A, Ashqar R, Khanfar NO, et al. (2024) I ncorporating driving behavior into vehicle fuel consumption prediction: methodology development and testing. Discover Sustainability 5(1).
13. Al-Hussein WA, Por LY, Mat Kiah MLM, Zaidan BB (2022) Driver Behavior Profiling and Recognition Using Deep-Learning Methods: In Accordance with Traffic Regulations and Experts Guidelines. Int J Environ Res Public Health 19(3).
14. Gong Y (2024) SIFDriveNet: Speed and Image Fusion for Driving Behavior Classification Network. IEEE Trans Comput Soc Syst 11(1): 1244-1259.
15. Kayisu AK (2024) Navigating Chaos: A Qualitative System Dynamics-based Analysis of Road Safety Challenges for Vulnerable Road Users in a Major Developing City (Kinshasa). WSEAS Transactions on Environment and Development 20: 1085-1097.
16. Narvaez AH, González LC, Wahlström J, López-Monroy
AP, Martínez-Reyes FM (2023) A Minimal Gated Multi- Modal Unit for Sensor Fusion in Insurance Telematics. IEEE Access 11: 93574-93586.
17. Gao J, He W, Liu H (2025) Multivariate Time Series Mamba for Aggressive Driving Behavior Prediction,” Jianghan University, School of Smart Manufacturing, Wuhan, China: Institute of Electrical and Electronics Engineers Inc pp: 714-719.
18. Dar MA, Ameen T, Ahmad A (2023) Pedestrian Conflict Yielding Behaviour at Uncontrolled T-Intersections: A Multinomial Logistic Regression Approach. Journal of The Institution of Engineers (India): Series 104(3): 763-777.
19. Zhang C, Du B, Shen J, Ma C (2023) Revealing safety impact of bus stops on passenger-cyclist interactions – Evidence from Nanjing, China. Travel Behav Soc 32.
20. Oikonomou A, Basbas S, Politis I, Nikitas A, Georgiadis G (2024) Cycling and non-aggressive driving in urban areas: What are the factors enabling them and how environment-friendly behaviour underpins their relationship?. J Transp Health 35.
21. Liu W, Gong Y, Zhang G, Lu J, Zhou Y, et al. (2024) GLMDriveNet: Global–local Multimodal Fusion Driving Behavior Classification Network. Eng Appl Artif Intell 129.
22. Luan X, Wen Q, Hang B (2025) Intelligent emotion recognition for drivers using model-level multimodal fusion. Front Phys 13.
23. Arun A, Lyon C, Sayed T, Washington S, Loewenherz F, et al. (2023) Leading pedestrian intervals – Yay or Nay? A Before-After evaluation of multiple conflict types using an enhanced Non-Stationary framework integrating quantile regression into Bayesian hierarchical extreme value analysis. Accid Anal Prev 181.
24. Liu T, Song X, Wang Y, Zou W, Shuai B, et al. (2025) Enhanced DACER Algorithm with Multimodal Q-value Distribution for Risk-Sensitive Stochastic Vehicle Environments. In: IEEE Intelligent Vehicles Symposium, Proceedings, Tsinghua University, School of Vehicle and Mobility, China, pp: 648-655.
25. Elhassy Z, Abou-Senna H, Shaaban K, Radwan E (2020) The implications of converting a high-volume multilane roundabout into a turbo roundabout. J Adv Transp 2020.
26. Page MJ, McKenzie JE, Bossuyt PM, Boutron I, Hoffmann TC, et al. (2021) The PRISMA 2020 statement: An
updated guideline for reporting systematic reviews. The BMJ 372.
27. Jashami H, Anderson JC, Mohammed HA, Cobb DP, Hurwitz DS (2024) Contributing factors to right- turn crash severity at signalized intersections: An application of econometric modelling. International Journal of Transportation Science and Technology 13: 243-257.
28. Yavuz MN, Ozen H (2025) Comprehensive Evaluation of the Impacts of Mixed Traffic Conditions on Urban Networks. IEEE Access 13: 73408-73429.
29. Gitelman V, Carmel R, Pesahov F (2020) Evaluating Impacts of a Leading Pedestrian Signal on Pedestrian Crossing Conditions at Signalized Urban Intersections: A Field Study. Frontiers in Sustainable Cities 2.
30. Wu F, Zhang Z, Han Z (2023) How Do Cognitive Interventions Impact Driver Aggressiveness in China? - A Driving Simulator Study. J Adv Transp 2023.
31. Zhao C (2025) Analysis of the impact of conflicts between right-turning vehicles and pedestrians at signalized intersections. In: Proceedings of SPIE - The International Society for Optical Engineering, Feng Z, Mikusova M, (Eds.), Chang’an University, China, 13575.
32. Pecman J, Šarkan B, Ližbetinová L, L’upták V, Loman M, et al. (2024) The Impact of Acceleration Style on Vehicle Emissions and Perspectives for Improvement Through Transportation Engineering Solutions. Archives of Automotive Engineering 104(2): 48-62.
33. Zhang Y, Ye B, Mubbala D, Du N (2024) Examining the Impact of Driving Styles of Automated Vehicles and Human Drivers on Driving Behavior: A Driving Simulator Study. Association for Computing Machinery, University of Pittsburgh, United States, pp: 214-219.
34. Usama N, Al-Wathinani AM, Goniewicz K, Babar S (2025) Impact of Driver Age and Behavior on the Effectiveness of ADAS in Cyclist Safety on Rural Roads: A Simulator Study. J Adv Transp 2025(1).
35. Wang Y, Zhao X (2023) Factors Influencing Driver’s Psychological Vulnerability Judgment When Sharing the Road With Driverless Vehicles. IEEE Access 11: 34880-34890.
36. Liu L, Xingkai M, Wu W, Xueran W, Mo Z, et al. (2024) Research on automobile driver’s safe evaluation technology. In: E3S Web of Conferences, Fan G, Wei M, et al. (Eds.), Ministry of Transport of the People’s Republic of China, Automotive Transportation Research Center, EDP Sciences, China.
37. Naqvi RA, Arsalan M, Abdul A, Rehman AU, Loh WK, et al. (2020) Deep learning-based drivers emotion classification system in time series data for remote applications. Remote Sens (Basel) 12(3).
38. Hsu CK, Lee TC, Wong KI (2023) Kinematic Characterization of Risky Riding Behavior of On- Demand Food-Delivery Motorcyclists in Taiwan. Transp Res Rec 2677(12): 543-559.
39. Huang L, Wu J, Zhang R, Zhao D, Wang Y (2021) Comparative Analysis & Modelling for Riders’ Conflict Avoidance Behavior of E-Bikes and Bicycles at Un-Signalized Intersections. IEEE Intelligent Transportation Systems Magazine 13(4): 131-145.
40. Sengupta A, Guler S, Gayah VV, Warchol S (2024) Evaluating the reliability of automatically generated pedestrian and bicycle crash surrogates. Accid Anal Prev 203.
41. Keler A, Denk F, Brunner P, Grigoropoulos G, Malcolm P, et al. (2021) Varying Bicycle Infrastructures- An Interconnected Simulator Study for Inspecting Motorist-Cyclist Conflicts. DSC Europe, pp: 193-194.
42. Keler A, Denk F, Brunner P, Grigoropoulos G, Malcolm P, et al. (2020) Varying bicycle infrastructures- an interconnected simulator study for inspecting motorist-cyclist conflicts. In: Actes (IFSTTAR), Kemeny A, Chardonnet JR, et al. (Eds.), Technische Universität München, Chair of Traffic Engineering and Control, Driving Simulation Association, Germany, pp: 193-194.
43. Shanshal D, Babaoglu C, Bener A (2020) Prediction of fatal and major injuries of drivers, cyclists, and pedestrians in collisions. Promet - Traffic and Transportation 32(1): 39-53.
44. Pan A, Zhang X, Nakamura H, Alhajyaseen W (2020) Investigating the Efficiency and Safety of Signalized Intersections Under Mixed Flow Conditions of Autonomous and Human-Driven Vehicles. Arab J Sci Eng 45(10): 8607-8618.
45. Hasanpour M, Persaud B (2022) Using microsimulation to investigate the optimal deployment of leading pedestrian intervals at signalized intersections. Traffic Safety Research 3: 22.
46. Lee YC, Momen A, LaFreniere J (2021) Attributions of social interactions: Driving among self-driving vs. conventional vehicles. Technol Soc 66: 101631.
47. Ma Z, Zhang Y (2023) Driving In Mixed Traffic: Will
Increased Penetration Rates of Automated Vehicles Change Driver Behaviors? HFES 67(1): 2152-2153.
48. Liu J, Wang Y, Liu Z (2025) Effects of median strip design in enhancing safety at uncontrolled midblock crosswalks: insights from a driving simulator experiment, In: SPIE - The International Society for Optical Engineering (Edn.), Feng Z, Mikusova M (Eds.), Chang’an University, China, 13575.
49. Debbarma T, Pal T, Duraisamy P (2025) Assessing Deep Learning Techniques for Human Driving Behavior Prediction and Analysis, In: SPIE - The International Society for Optical Engineering (Edn.), Kehtarnavaz N, Shirvaikar MV (Eds.), National Institute of Technology, India, 13458.
50. Ahmad S, Rogers J, Nelson M, Huang Y, Ajmera B, et al. (2022) Evaluating the mobility performance of autonomous vehicles at a signalized traffic intersection, In: SPIE - The International Society for Optical Engineering (Edn.), Zonta D, Glisic E (Eds.), NDSU College of Engineering, USA, 12046.
51. Khattak ZH, Lin Z (2023) Quantifying automated vehicle benefits in reducing driving stress: a simulation experiment approach. Frontiers in Future Transportation: 4.
52. Ma Z, Zhang Y (2024) Driver-Automated Vehicle Interaction in Mixed Traffic: Types of Interaction and Drivers’ Driving Styles. Hum Factors 66(2): 544-561.
53. He Y, Xiang D, Wang D (2025) Traffic safety evaluation of emerging mixed traffic flow at freeway merging area considering driving behavior. Sci Rep 15: 10686.
54. Ahmed J, Robinson A, Miller EE (2024) Effectiveness of signs for pedestrian-railroad crossings: Colors, shapes, and messaging strategies. J Safety Res 89: 141-151.
55. Nazir F, Ali Y, Haque MM (2024) Effects of sample size on pedestrian crash risk estimation from traffic conflicts using extreme value models. Anal Methods Accid Res 44: 100353.
56. Chen YF, Dong Z, Che K, Xiang ZT (2022) Cellular automaton model considering the effect of brake light and traffic light at the intersection. International Journal of Communication Systems 35: 12.
57. Li H, Zhang Z, Sze NN, Hu H, Ding H (2021) Safety effects of law enforcement cameras at non-signalized crosswalks: A case study in China. Accid Anal Prev 156: 106124.
58. Yeo J, Lee J, Jang K (2021) The effects of rainfall on driving behaviors based on driving volatility. Int J Sustain Transp 15(6): 435-443.
59. Lin PS, Keita Y, Rangaswamy R, Duran E, Kolla R (2025) Safety Effectiveness of R10-15a Static Signs, In: (Edn.) ICTD, Wei H (Ed.), American Society of Civil Engineers (ASCE), USA, pp: 360-372.
60. Amini RE, Yang K, Antoniou C (2022) Development of a conflict risk evaluation model to assess pedestrian safety in interaction with vehicles. Accid Anal Prev 175: 106773.
61. Kong D, Sun L, Chen Y (2022) Traffic dynamics around freeway merging area with mixed conventional vehicles and connected and autonomous vehicles. International Journal of Modern Physics C 33(10).
62. Novat NK, Kwigizile V, Oh JS (2025) Impact of Slip Lanes on Pedestrian Safety at Roundabouts Considering Autonomous Vehicles. Transp Res Rec 2679(3): 112- 126.
63. Zhao Y, Liang J, Chen L, Wang Y, Gong J (2022) Evaluation and prediction of free driving behavior type based on fuzzy comprehensive support vector machine. Journal of Intelligent and Fuzzy Systems 42(4): 2863-2879.
64. Khan SM, Chowdhury M (2021) Situation-Aware Left- Turning Connected and Automated Vehicle Operation at Signalized Intersections. IEEE Internet Things J 8(16): 13077-13094.
65. Adavikottu A, Velaga NR (2023) Analysis of speed reductions and crash risk of aggressive drivers during emergent pre-crash scenarios at unsignalized intersections. Accid Anal Prev 187.
66. Ansariyar A, Taherpour A, Yang D, Jeihani M (2024) Enhancing Pedestrian Safety by Providing A Lidar- Based Analysis of Jaywalking Conflicts at Signalized Intersections. Acta Scientiarum Polonorum, Administratio Locorum 23(2): 167-194.
67. Zhang S, Abdel-Aty M (2022) Real-Time Pedestrian Conflict Prediction Model at the Signal Cycle Level Using Machine Learning Models. IEEE Open Journal of Intelligent Transportation Systems 3: 176-186.
68. Golakiya H, Chauhan R, Dhamaniya A (2020) Mapping Pedestrian-Vehicle Behavior at Urban Undesignated Mid-Block Crossings under Mixed Traffic Environment - A Trajectory-Based Approach in Transportation Research Procedia. In: Ulengin F, Patil GR, et al. (Eds.), S. V. National Institute of Technology, Elsevier B.V, pp: 1263-1277.
69. Hussain MS, Bahrha G, Goswami A (2024) An integrated VISSIM-SSAM approach to predicting and mitigating pedestrian crashes and severity along urban crossings. Case Stud Transp Policy 15.
70. Oladejo O, Odeyale T, Ogunleye O (2024) Urban decay and traffic load on highway in Nigeria: a study of Ibadan–Oyo Road. Environ Dev Sustain 26(9): 23385- 23400.
71. Ghadirzadeh S, Mirbaha B, Rassafi A (2022) Analysing pedestrian-vehicle conflict behaviours at urban pedestrian crossings. Proceedings of the Institution of Civil Engineers: Municipal Engineer 175(2): 107-118.
72. Cao S, Sun Y, Zhang X, Yang M (2025) Intelligent connected adaptive signal control considering pedestrians based on the EXP-DDQN algorithm. PLoS One 20(6).
73. Yousaf A, Wu J (2023) Motorcycle-Riding Experience: Friend or Foe? Understanding Its Effects on Driving Behavior and Accident Risk. Sustainability, Switzerland, 15(13).
74. Seriani S (2025) Time–Space Analysis of Transport Infrastructures: A Pilot Study of Shibuya-Type Crossings for Signalized Intersections in Developing Cities. Applied Sciences, Switzerland, 15(3).
75. Luo Z, Mehrara M, Hummer J, Osafo-G, Pande A (2025) Pedestrian safety and efficiency at emerging alternative intersection designs with three-phase traffic signals. Innovative Infrastructure Solutions 10(1).
76. Ben O, Mokdad L (2023) Analytical Study for Vehicle Mobility Modeling. In: Ibrahimi K, El Kamili M, et al. (Eds.), Universite Paris-Saclay, Institute of Electrical and Electronics Engineers Inc, France.
77. Ali Y, Haque M, Mannering F (2023) A Bayesian generalised extreme value model to estimate real- time pedestrian crash risks at signalised intersections using artificial intelligence-based video analytics. Anal Methods Accid Res 38.
78. Tahir H, Haque M (2024) A non-stationary bivariate extreme value model to estimate real-time pedestrian crash risk by severity at signalized intersections using artificial intelligence-based video analytics. Anal Methods Accid Res 43.
79. Hussain F, Ali Y, Li Y, Haque M (2024) Revisiting the hybrid approach of anomaly detection and extreme value theory for estimating pedestrian crashes using traffic conflicts obtained from artificial intelligence- based video analytics. Accid Anal Prev 199.
80. Ankunda A, Ali Y, Mohanty M (2024) Pedestrian crash risk analysis using extreme value models: New insights and evidence. Accid Anal Prev 203.
81. Su Z, Woodman R, Smyth J, Elliott M (2023) The Relationship Between Aggressive Driving and Driver Performance: A Systematic Review with Meta-Analysis. Accid Anal Prev 183(2).
82. Zhang JZ, Lin HY (2021) Driving Behavior Analysis and Traffic Improvement Using Onboard Sensor Data and Geographic Information. Science and Technology Publications pp: 284-291.
83. Zhang G, Fan H, Chen T, Feng Y, Chen D (2024) Analysis of the Relationship Between Driver Emotions and Driving Behavior in Intersection Scenarios. Tianjin University, State Key Laboratory of Engines, Tianjin, China, pp: 1-6.
84. Pantangi SS, Fountas G, Anastasopoulos PC, Pierowicz J, Majka K, et al. (2020) Do High Visibility Enforcement Programs Affect Aggressive Driving Behavior? An Empirical Analysis Using Naturalistic Driving Study Data. Accid Anal Prev 138.
85. Zhang Y, Ling S, Awad E, Frank MR, Du N (2023) Driving Next to Automated Vehicles: Emergent Human-machine Cooperation in Mixed Traffic. In: Conference on Human Factors in Computing Systems Proceedings, Association for Computing Machinery, University of Pittsburgh, United States.
86. Sun Z, Yan Q, Liu Y, Fu Z, Yang L (2024) Fundamental Diagram and Stability Analysis of Mixed Traffic Considering Heterogeneous Car-Following Behaviors and Platoon Factors. Intelligent Transportation Infrastructure 3.
87. Hossain S, Maggi E, Vezzulli A (2024) Factors Influencing the Road Accidents in low And Middle- Income Countries: A Systematic Literature Review. Int J Inj Contr Saf Promot 31(2): 294-322.
88. Boyd T, Williams K, Lin PS, Chen C, Jelinska EB, et al. (2024) Understanding How We Can Make Commercial Driveways Safer: Exploratory Analysis through Case Studies. In: Wei H (Ed.), College of Engineering, American Society of Civil Engineers (ASCE), United States, pp: 59-69.
89. Lin HY, Zhang JZ, Chang CC (2023) Image Data Extraction and Driving Behavior Analysis Based on Geographic Information and Driving Data. Electronics 12(13).
90. Liu J, Chen X (2024) Analysis of pedestrian-two-wheeler conflicts at green light digital countdown signals: A random parameter ordered logit model approach. Accid Anal Prev 206.
91. Totkova Z (2024) Subjective assessment of traffic rules compliance in bulgaria: Role of personality and driving style. Transp Res Part F: Traffic Psychol Behav 106: 370-384.
92. Sheykhfard A, Haghighi F, Papadimitriou E, van Gelder P (2021) Analysis of the occurrence and severity of vehicle-pedestrian conflicts in marked and unmarked crosswalks through naturalistic driving study. Transp Res Part Of Traffic Psychol Behav 76: 178-192.
93. Ma J, Chen H, Cui Y, Zhang T (2024) The Predictive Role of Visual Attention Bias in Aggressive Driving Decisions among Violation Involved Drivers on Attitudes of Right of Way. Transp Res Part F Traffic Psychol Behav 107: 607-619.
94. de Winter JCF, Onkhar V, Dodou D (2025) Cross National Differences in Drivers Eye Contact and Traffic Violations: An online survey across 20 countries. Transp Res Part F Traffic Psychol Behav 109: 711-725.
95. Huo D, Ma J, Chang R (2023) The Development and Application of the Drivers’ Attitudes Of Right of Way Questionnaire (DARQ). Transp Res Part F Traffic Psychol Behav 94: 67-82.
96. Ansariyar A, Ardeshiri A, Jeihani M (2023) Investigating the collected vehicle-pedestrian conflicts by a LIDAsensor based on a new Post Encroachment Time Threshold (PET) classification at signalized intersections. Advances in Transportation Studies 61: 103-118.
97. Zhao X, Qi H, Yao Y, Guo M, Su Y (2023) Traffic Order Analysis of Intersection Entrance Based on Aggressive Driving Behavior Data Using CatBoost and SHAP. J Transp Eng A Syst 149: 6.
98. Yang H, Zhao X, Luan S, Chai S, 2024) A traffic dynamic operation risk assessment method using driving behaviors and traffic flow Data: An empirical analysis. Expert Syst Appl 249.
99. Sheykhfard A, Haghighi F, Papadimitriou E, Das S and van Gelder P (2024) Exploring the Influence of Signal Countdown Timers on Driver Behavior: An Analysis of Pedestrian Vehicle Conflicts at Signalized Intersections. Transp Res Rec 2678 (4): 865-880.
100. Liu R, Yu H, Ren Y, Liu S (2022) The Analysis of Classification and Spatiotemporal Distribution Characteristics of Ride-Hailing Driver’s Driving Style: A Case Study in China. Int J Environ Res Public Health 19(15): 9734.
101. Dey A, Das S (2024) Model for Predicting Lateral Shifts and Driving Style of Motorized Two-Wheelers. Transp Res Rec 2678(6): 972-988.
102. Carrasco LC, Coloma CC, Silvera MS, Campos FC (2021) Evaluation of road intersections in areas of high commercial activity through the identification of vehicle- pedestrian conflicts using the black spots methodology. In: Morales VMF (Ed.), Universidad Peruana de Ciencias Aplicadas, School of Civil Engineering, Institute of Electrical and Electronics Engineers Inc, Peru.
103. Maddu K, Potdar P, Deb M, Jena S (2025) Empirical assessment of saturation flow rate with dynamic PCUs at signalized intersections under mixed traffic conditions. Innovative Infrastructure Solutions 10(8): 379.
104. Banerjee A (2025) Investigating Crash Contributing Factors at Public Highway-Railroad Grade Crossings in Kentucky. In: Wei H, (Eds.), Western Kentucky University, United States, American Society of Civil Engineers (ASCE) pp: 94-107.
105. Feng M, Zhao J, Hou C, Nie C, Hou J (2025) Investigating the safety influence path of right-turn configurations on vehicle–pedestrian conflict risk at signalized intersections. Accid Anal Prev 211: 107910.
106. Liu P (2024) Machines meet humans on the social road: Risk implications. Risk Analysis 44(7): 1539- 1548.
107. Pu Q, Xie K, Guo H, Zhu Y (2025) Modeling crash avoidance behaviors in vehicle-pedestrian near-miss scenarios: Curvilinear time-to-collision and Mamba- driven deep reinforcement learning. Accid Anal Prev 214: 107984.
108. Santhosh D, Bindhu BK, Koshy BI (2020) Evaluation of pedestrian safety in unsignalized T and X – Intersections through comparison of the frequency and severity of pedestrian conflicts. Case Stud Transp Policy 8(4): 1352-1359.
109. Dixit A, Jain M (2024) Trajectory Data Driven Driving Style Recognition for Autonomous Vehicles Using Unsupervised Clustering. Communications on Applied Nonlinear Analysis 31: 715-723.
110. Berdoulat E, Deninotti J, Vavassori D (2021) Typology of aggressive and transgressive drivers. Accid
Anal Prev 162: 106404.
111. Hussain Q, Alhajyaseen WKM, Kharbeche M, Almallah M (2023) Safer pedestrian crossing facilities on low-speed roads: Comparison of innovative treatments. Accid Anal Prev 180: 106908.
112. Singh S, Ali Y, Haque MM (2024) A Bayesian extreme value theory modelling framework to assess corridor-wide pedestrian safety using autonomous vehicle sensor data. Accid Anal Prev 195: 107416.
113. Hussain Q, Alhajyaseen WKM, Pirdavani A, Brijs K, Shaaban K, et al. (2021) Do detection-based warning strategies improve vehicle yielding behavior at uncontrolled midblock crosswalks?. Accid Anal Prev 157: 106166.
114. Dutta M, Jena S, Korat B, Bhandari S, Lyngdoh GK (2024) Anticipated buffer time – An evasive surrogate safety indicator for risk assessment of unsignalized intersections under heterogeneous traffic and aggressive driving conditions. Accid Anal Prev 208: 107796.
115. Kumar M, Singh S, Pilania U, Aggarwal A (2022) High-Security Registration Plate Detection using OpenCV and Python. Manav Rachna University, Department of Computer Science, Faridabad, India, Institute of Electrical and Electronics Engineers Inc, pp: 835-839.
116. Wang Y, Zhang X, Nakamura H (2024) Left- Turn Lane Capacity Estimation based on the Vehicle Yielding Maneuver Model to Pedestrians at Signalized Intersections. Sustainability, Switzerland, 16(6): 2313.
117. Alobaidallah AM, AlQahtany A, Maniruzzaman KM (2025) Assessment of the Saher System in Enhancing Traffic Control and Road Safety: Insights from Experts for Dammam, Saudi Arabia. Sustainability, Switzerland, 17(8): 3304.
118. Shokry S, Tanaka S, Nakamura F, Ariyoshi R, Miura S (2020) Operational Performance Comparison between Conventional Intersections and Two Unconventional Alternative Intersection Designs (UAIDs) under Heterogeneous Traffic Conditions in Cairo, Egypt. In: Ulengin F (Ed.), Transportation Research Procedia. Yokohama National University, Graduate School of Urban Innovation, Elsevier BV, Japan, pp: 923-938.
119. Haiura IA, Iftene A (2024) Detecting Violence in Videos using Convolutional Neural Networks. In: Flearmoy J (Eds.), Procedia Computer Science, Universitatea Alexandru Ioan Cuza, Faculty of Computer Science, Iasi, Romania, 246: 2497-2506.
120. Sheykhfard A, Haghighi F, Fountas G, Das S, Khanpour A (2023) How do driving behavior and attitudes toward road safety vary between developed and developing countries? Evidence from Iran and the Netherlands. J Safety Res 85: 210-221.
121. Shen Z, Yu C, Su C, Ma W (2025) Increasing the capacity of signalized intersections with unconventional designs of shared right-turn lanes. Transportmetrica B 13(1).
122. Zhu Y, Ma Y, Chen S, Khattak AJ, Pang Q (2022) Identifying Potentially Risky Intersections for Heavy- Duty Truck Drivers Based on Individual Driving Styles. Applied Sciences (Switzerland) 12(9): 4678.
123. Jamal S, Newbold KB, Scott D (2023) Exploring Pedestrian Injury Severity by Incorporating Spatial Information in Machine Learning. Transport Findings.
124. Pešić A, Stephens AN, Newnam S, Čičević S, Pesǐć D, et al. (2022) Youth Perceptions and Attitudes towards Road Safety in Serbia. Systems 10(5): 191.
125. Lin A, Xu H, Chen Z (2025) Wearable AR System for Real-Time Pedestrian Conflict Alerts Using Live Roadside Data. Electronics (Switzerland) 14(1): 99.
126. Saha N, Motuba D (2023) Estimating the Impacts of AV and CAV and Technologies Transportation Systems for Medium, Long, and Buildout Transportation Planning Horizons. Future Transportation 3(2): 457- 478.
127. Piccardi L, Palmiero M, Guariglia P, Dacquino C, Cordellieri P, et al. (2021) Is the Risk Behaviour Related to the Ordinary Driving Violations?. Psychol Stud (Mysore) 66: 26-35.
128. Ahmed T, Lateef H, Ali A, Huang Y, Guo M (2025) Comprehensive Traffic Flow Optimization Strategies for Congestion at Roundabouts in Developing Countries. In: American Society of Civil Engineers (ASCE), Wei H (Ed.), NDSU College of Engineering, United States, pp: 102-114.
129. Kassim MAM, Hanan SAH, Abdullah MS, Hong CP (2021) Road accident proneness in Malaysia: A hypothesized model of driver’s demographic profiles, aggressive driving and risky driving. In: AIP Conference Proceedings, Rahim SZA, Saad MNM, (Eds.), Universiti Malaysia Perlis, School of Business Innovation and Technoprenuership, American Institute of Physics Inc, Malaysia.
130. Li Y, Zhang S, Pan Y, Zhou B, Peng Y (2023) Exploring the Stability and Capacity Characteristics of Mixed Traffic Flow with Autonomous and Human-Driven Vehicles considering Aggressive Driving. J Adv Transp.
131. Chauhan R, Dhamaniya A, Arkatkar S (2021) Driving behavior at signalized intersections operating under disordered traffic conditions. Transp Res Rec 2675(12): 1356-1378.
132. Li S, Li Q, Xu J, Zhang Y (2024) Simulation of cross- pedestrian flow in intersection based on direction fuzzy visual field. IET Intelligent Transport Systems 18(6): 1045-1067.
133. Ansariyar A, Jeihani M (2024) Investigating LiDAR Sensor Accuracy for V2V and V2P Conflict Detection at Signalized Intersections. Future Transportation 4(3): 834-855.
134. Espinoza-Molina FE, Ortega M, Sandoval Escobar KE, Vazquez Salazar JS (2024) An Integrated Approach to the Spanish Driving Behavior Questionnaire (SDBQ) in the City of Cuenca, Ecuador. Sustainability, Switzerland, 16(12): 4885.
135. Kushwaha AK, Shinde K, Kumar B (2024) Fuzzy Probabilistic Approach to Identify Driving Behavior of Two-Wheeler Drivers Under Mixed Traffic Conditions. IEEE Access 12: 76169-76179.
136. Momeni Rad FM, El-Basyouny E (2024) How COVID-19 impacted the temporal and spatial distribution of collision hotspots. Canadian Journal of Civil Engineering 51(6): 616-639.
137. Kubica ML (2022) Autonomous Vehicles and Liability Law. American Journal of Comparative Law 70(S1): I39-I69.
138. Dias C, Kharbeche M, Muley D, Kashem A, Fahed MA, et al. (2022) Are Professional Drivers more Aggressive than General Drivers? A Case Study from Doha, Qatar, in Procedia Computer Science. Qatar Transportation and Traffic Safety Center, College of Engineering, Qatar University, Elsevier BV, Qatar, pp: 16-23.
139. Wu Z, Misra A, Bao S (2024) Modeling Pedestrian Injury Severity: A Case Study of Using Extreme Gradient Boosting Vs Random Forest in Feature Selection. Transp Res Rec 2678(1): 1-11.
140. Dey KC, Rahman MT, Das S, Williams AM (2023) Left-turn phasing selection considering vehicle-to- vehicle and vehicle-to-pedestrian conflicts. Journal of Traffic and Transportation Engineering 10(1): 58-69.
141. Miani M, Dunnhofer M, Micheloni C, Marini A, Baldo N (2022) Young drivers’ pedestrian anti- collision braking operation data modelling for ADAS development. In: Transportation Research Procedia, Tira M, Maternini G (Eds.), Università degli Studi di Udine, Polytechnic Department of Engineering and Architecture, Italy: Elsevier BV pp: 432-439.
142. Liu J, Peng P, Hu X, Sun J (2024) Evaluation of drivers interaction ability at social scenarios: a process- based framework. Transportmetrica B 12(1).
143. Bai Ya, Luo W (2023) A Coordinated Allocation Method for Right-Turn Strategy at Signalized Intersections with Optimal Pedestrian and Vehicle Delays. J Adv Transp.
144. Easa SM, Zheng Y, Ma Y, Wang C (2023) Road User’s Rage: Review and Remedies presented at the ICP International Conference on Psychology.
- Validating Cognitive Models of Royal Navy Performance on Control Systems
- Comparing Standard and State-of-the-art Firefighter Coats on Postural Balance and Gait in a Live Burn Environment
- Investigating the Integration of Telemedicine into Clinicians Workflow: A Review of Methods
- Risk Assessment of Ergonomic Factors in a Textile Firm by RULA, REBA and Fine Kinney Methods
- Impact of Self-Esteem Training on Individuals with Disabilities Aged 17-30
- Effects of a Psychotherapeutic Pathway Based on Mindfulness, Acceptance and Commitment Therapy and Creative Contact with Nature in People with Mild Intellectual Disability