Validating Cognitive Models of Royal Navy Performance on Control Systems
The introduction of new items of supervisory control systems into the Royal Navy is supported by modelling to understand the future impacts and benefits. This paper describes work on one such supervisory system. It describes the review work and cognitive modelling technique that was developed and then validated. The results are presented and discussed. They support a general approach to cognitive modelling and more generally capability modelling.
Introduction
System development within the Royal Navy is accompanied, in the early stages, by substantial modelling programmes. These may involve human performance in the case of supervisory control systems where impacts on working practices need to be identified. This work was carried out when the introduction of automation was clearly about to influence team performance in many ways [1].
There is a substantial body of human performance work on error analysis [2] which may involve cognition. However, there is not an equivalent body of work to cover the temporal characteristics associated with perception and cognitive activities. In this supervisory control application [3]. The time to complete tasks could be related to workload, training and experience and hence it was critical to model the temporal characteristics.
It is important to note that while this work originated in a naval application, the task model associated with supervisory control can now be seen as aiding a wide range of non-naval tasks including word processing where the user is controlling the performance of a printer or other.
When designing the means of controlling an item or process via a supervisory system, it is critical to progress through at least two major stages:
- Construct a task description in order to understand the purpose of the task and the information flow and processing which enable the control to be enacted.
- Assign performance characteristics to the task to enable estimates to be made of the temporal or error characteristics of the task. The times taken to carry out tasks which can be fully specified defined in terms of physical movements are well documented [4]. However, when carrying out control tasks with cognitive components:
- There is no agreed process or set of performance data to support modelling the cognitive element within this temporal description.
- Activities may be carried out simultaneously which needs to be taken into account during the estimation process. A substantial review of the relevant research was out by D. Rumens of the EMI Laboratory [5].
The literature review study was carried out in parallel with a techniques study to investigate how the cognitive elements of a team’s tasks could be modelled. The modelling technique developed was referred to as using Activity Device Matrices (ADMs), see [Table 1,2]. The approach depended on the use of the information within the ADMs to assign times to the task descriptions and hence predict the time required for the completed series.
The Task Description
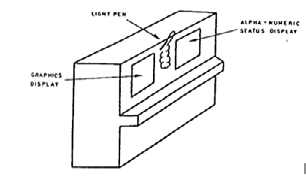
The system development which included this work included the use of equipment as shown in [Figure 1].
Sheridan provided a general introduction to the design of nuclear supervisory control systems while Tainsh summarised the user task control model as in [Figure 2].
The user’s tasks involve communicating via a computer- based system with the world remote from the command team. [Figure 2] shows the main communication links between the user, computer-based system and an object under control. These links enable the flow of information associated with the user’s control of objects and/or events remote from the control position.
In terms of process which enable information and knowledge to be communicated between the controller with the control device to the remote object in a series of transactions. These transactions enable the user to gain an understanding of the remote object(s) in terms of background and foreground objects and events.
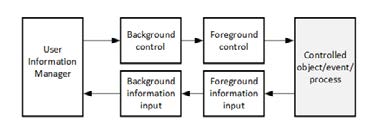
Foreground activities are distinguished from background in terms of importance to the user. They are the ones which have major attention which may be defined by characteristics such as setting up the system. In turn the background will be defined in terms of situation appreciation.
The information and knowledge management will contain knowledge of goals to be achieved by the management process, and the priorities that have been agreed prior to the operation where the capability is being deployed.
The tasks selected to be modelled included four procedures. The tasks selected were of different lengths and involved cognitive and perceptual-motor elements. They are specified in [Table 1].
Validation Method
The investigation was carried out on a Royal Navy simulator which was used to train supervisory control. The management of the trial was carried out by myself in conjunction with a senior member of the control systems team. A set of nine experienced operators were assigned to carry out the four tasks. They were carried out exactly as they would be carried out when at sea. The operators were briefed on the tasks to be carried out which were specified in accordance with Operating Procedures. Their work was monitored by a senior member of the system team as would be the case at sea.
The times for completion were recorded by myself and senior team member to enable accuracy to be checked.
Any questions from the operators were handled by the senior member of the team.
After the tasks were completed, there were discussions with all the team members to ensure that any lessons that could be learned were captured.
| Set of activities | Activity components (See ANNEX A for times) |
|---|---|
| A. Selecting light-pen and geographic display, deselecting light-pen | Selection of light-pen |
| Deselection of light-pen | |
| Selection/positioning of light-pen over display selection required. | |
| Injection/depression of light-pen | |
| Total number of components is 30 | |
| B. Selecting light-pen and geographic display features and completing setting up procedure, deselecting light-pen. | Selection of light-pen |
| Deselection of light-pen | |
| Selection/positioning of light-pen over display features required. | |
| Injection/depression of light-pen | |
| Total number of components is 52 | |
| C. Selecting light-pen and geographic display and initiating data analysis procedure on item bring controlled, deselecting light-pen. (Baker 1966) | Selection of light-pen |
| Deselection of light-pen | |
| Selection/positioning of light-pen over control item features required. | |
| Injection/depression of light-pen | |
| Total number of components is 50 | |
| D. Selecting light-pen and geographic display and completing data analysis procedure on controlled item, deselecting light-pen. | Selection of light-pen |
| Deselection of light-pen | |
| Selection/positioning of light-pen over control item features required in support of analysis process. | |
| Injection/depression of light-pen | |
| Total number of components is 91 |
Table 1: Set of tasks for the trial.
The Results
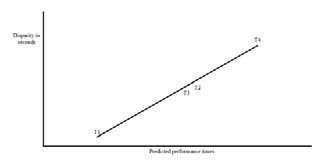
The mean times to completion were compared with the predicted times, and the disparity which is the difference between the observed and the predicted times plotted.
A regression model was fitted to the data assuming a straight line and the parameters estimated. In summary the predicted times were 40% greater in duration than the observed times for all tasks.
Conclusion
It is clear from the results that this technique can only yield indicative outcomes, however in a system development context, in its early stages, such guidance may be useful. Further, the accuracy and precision of the performance characteristics can be improved as the development progresses. This investigation shows that it is critical to calibrate initial estimates of time to complete a task against other known sources of evidence, and to check the validity of the estimates against additional data sources. One of the main advantages of this modelling technique is to enable an integrated view of the ergonomics contribution to the system capability, in a way that can be improved iteratively as the development progresses or in-service experience with the capability is acquired. This can prevent erroneous statements from being developed.
This technique has been used successfully over a number of decades in a wide variety of applications. It has enabled comparisons to be made on equipment selection and task design based on the information held in the ADMs. In turn these have supported modelling of system capability [1, 6, 7, 8, 9]. The ADMs are given in [Table 2,3].
| INPUT SEC | Sele- ction | Actu- ation | Desele- ction | Positioning | Control Action | Item, selection | Data Entry | |||||
|---|---|---|---|---|---|---|---|---|---|---|---|---|
| Static | Moving | Discrete | Conti- nuous | Discrete | Continuous | |||||||
| Digitiser | 0.49 | 0.5 | 0.43 | 4.5 | 5.5 | 0.9 | 4.5 | 1.83 | 5.5 | 1 | ||
| Isometric joystick rate | 0.38 | 0.4 | 0.29 | 3.1 | 4.6 | 1.25 | 3.5 | 2.3 | ||||
| Isotonic joystick rate | 0.8 | 0.6 | 0.38 | 4.4 | 5.3 | 1.5 | 5 | 2.4 | ||||
| Isotonic Joystick position | 0.47 | 0.6 | 0.38 | 4.5 | 5.9 | 2.5 | 5.1 | 3.4 | ||||
| Keyboard | 1.39 | 0.3 | 0.58 | 5.5 | 0.9 | 2.8 | 3.3 | 0.5 | 1.52 | 0.25 | ||
| Keypad | 1.17 | 0.35 | 0.51 | 4.8 | 7 | 0.8 | 2.9 | 3.5 | 0.82 | 2.42 | 0.42 | |
| Lightpen | 1.91 | 0.7 | 1.74 | 2.25 | 3 | 0.9 | 3.3 | 2.7 | 4.25 | 0.84 | ||
| Pushbutton force | 1.2 | 0.27 | 0.63 | 7 | 0.7 | 2.2 | 3.6 | 1.05 | ||||
| Pushbutton Touch | 1.33 | 0.3 | 0.63 | 4.5 | 0.9 | 2.2 | 3.8 | 1.45 | ||||
| Roller ball aided | 0.58 | 0.35 | 0.82 | 3 | 5.25 | 1.9 | 3.4 | 2.85 | ||||
| Rollerball position | 0.58 | 0.35 | 0.82 | 3.2 | 5.5 | 2 | 3.5 | 3 | ||||
| Rotary Control -switch | 1.13 | 0.8 | 0.43 | 9 | 1.5 | 2.5 | 7.1 | 1.55 | ||||
| Rotary control - thumbwheel | 1.26 | 0.9 | 0.43 | 3 | 1.7 | 4.52 | 10.7 | 2.2 | ||||
| Rotary control – continuous | 1.02 | 1.2 | 0.54 | 6 | 8 | 3.5 | 3.7 | 3.35 | ||||
| Speech interpreter word/phrase | 0 | 0.8 | 0 | 10 | 1.25 | 3.6 | 0.85 | 1 | 1.75 | 1.35 | ||
| Speech interpreter continuous | 0 | 0.8 | 0 | 15 | 2 | 4.5 | 1.25 | 0.8 | 2 | 0.33 | ||
| Tablet | 2.47 | 0.4 | 2.24 | 1.9 | 2.9 | 0.78 | 2.3 | 2.26 | 2.25 | 0.67 | 2.75 | 0.95 |
| Toggle switch | 1.5 | 0.25 | 0.68 | 7 | 0.65 | 2.75 | 9 | 1.15 |
Table 2: Activities in secs.
| OUTPUT SEC | Sele- ction | Detection | Appreciation | Word Compre -hension | Super- vision | ||||||
|---|---|---|---|---|---|---|---|---|---|---|---|
| Signal | Pictorial | Grap- hical | Tabular | Signal | Pictorial | Grap- hical | Tabular | ||||
| Character display | 0.48 | 0.25 | 0.59 | 0.93 | 0.79 | ||||||
| CRT Raster | 0.48 | 5 | 12.1 | 0.36 | 0.2 | 5 | 1.5 | 0.7 | 0.6 | 0.9 | 0.5 |
| CRT Cursive | 0.48 | 1 | 0.23 | 0.5 | 0.6 | 0.54 | 0.84 | 0.4 | |||
| Flat display | 0.48 | 0.23 | 8 | 3 | 0.7 | 0.8 | 0.99 | 0.82 | |||
| Headphone/ loudspeaker | 0 | 0.99 | 3 | 0.64 | |||||||
| Indicator Plain | 0.24 | 0.5 | 0.4 | ||||||||
| Indicator Message Display | 0.48 | 0.24 | 0.28 | 0.81 | 0.38 | ||||||
| Overlay front mounted | 0.48 | 1 | 0.4 | 0.43 | 0.8 | ||||||
| Overlay back projected | 0.48 | 0.2 | 0.08 | 1.9 | 1.5 | 0.42 | 0.47 | 0.82 | 0.55 | ||
| Projection Display/Large Display | 0.48 | 0.3 | 6 | 3 | 0.7 | 0.66 | 1 | 0.6 | |||
| Speech Synthesiser word phrase | 0 | 0.18 | 0.8 | 1.5 | 0.91 | ||||||
| Speech synthesiser continuous | 0 | 0.23 | 1 | 1.25 | 0.75 |
Table 3: Activities in secs.
References
-
Tainsh MA (2023) Modelling User contribution to Capability within a Supervisory Control System. Proceedings of CIEHF Annual Conference.
-
Kirwin B (1994) A Guide to Practical Human Reliability Assessment. Taylor and Francis, Uk
-
Karger DW, Bayha FH (1987) Engineered Work Measurement. Industrial Press Inc. New York.
-
EMI Electronics (1979) Ergonomics for Future Submarine Systems. Ergonomics Laboratory Memo No 476.
-
Baker JD, Goldstein I (1966) Batch versus sequential displays; effects on human problem-solving. Human Factors 8(3): 225-235.
-
Colquhoun WP (1975) Evaluation of Auditory, Visual and Dual-Node Displays for Prolonged Sonar Monitoring in Repeated Sessions. Human Factors 17(5): 425-437.
-
Damon RD, Farrell RJ, Hitt JD (1969) Effect of vibration om the operation of decimal input devices. Human Factors 11(3): 257-272.
-
Goodwin N (1975) Cursor positioning on an electronic display using light-pen, light-gun, or keyboard for three basic tasks. Human Factors 17(3): 289-295.
- The Expanding Landscape of Road Rage: A Systematic Review of Conflicts Involving Drivers, Pedestrians, and Micromobility
- Comparing Standard and State-of-the-art Firefighter Coats on Postural Balance and Gait in a Live Burn Environment
- Investigating the Integration of Telemedicine into Clinicians Workflow: A Review of Methods
- Risk Assessment of Ergonomic Factors in a Textile Firm by RULA, REBA and Fine Kinney Methods
- Impact of Self-Esteem Training on Individuals with Disabilities Aged 17-30
- Effects of a Psychotherapeutic Pathway Based on Mindfulness, Acceptance and Commitment Therapy and Creative Contact with Nature in People with Mild Intellectual Disability