Pushing and Pulling Tasks Practical Techniques and Criteria for Measuring and Interpreting Detected Forces Using Digital Versus Traditional Analog Dynamometers Suggestions for Implementing Standards
Objectives: The main objectives of the paper is to compare the measurement of forces during pushing/pulling tasks using digital and analog dynamometers, showing the advantages of the first device and to propose guidelines for measurement interpretation with special attention to practitioners needs. Methods: The paper includes procedures for comparing the reproducibility of analog and digital dynamometers and for determining relationships between measured forces and subjective evaluations using Borg CR-10 Scale. Results: Examples are presented of measurements carried out with digital dynamometers using the original methodology, illustrating advantages and limits. Inter/intra-observer validation tests confirm the advantages of digital over analog dynamometers. Comparisons between measured data and subjective force ratings are presented and confirm good correlations. Conclusion: The results confirm that digital dynamometers, using proposed original methodology, generate more accurate information than analog. The methodology may be useful for future revision of ISO Standard. Open issues are underscored to stimulate additional research.
Introduction and Objectives
Given the widespread need to measure the risk associated with all occupational hazards present in the workplace, as indicated by the European Committee for Standardization (CEN), the measurement of pulling and pushing forces in the manual transportation of loads must also be evaluated to determine if they cause biomechanical overload. This paper deals with the measurement of external forces in pushing and pulling tasks using dynamometers, paying special attention to the needs of practitioners involved in field measurements. Several alternative methods for estimating force during pushing/pulling are available, e.g., the direct measurement of muscle strength using EMG, studies of hand forces, three- dimensional awkward posture studies, etc [1, 2, 3]. Despite the indisputable validity of the methodologies proposed, and the interest they have aroused, this paper will not deal with them since they are not easily applicable in the field by users (health and safety officers, corporate practitioners, etc.).
The principles underlying the determination of (recommended) force limits have been extensively studied on the basis of well-proven experiences [4, 5, 6, 7, 8], therefore, this paper will not discuss them; moreover these principles are already embedded in the ISO Standards [9, 10, 11].
The paper will, instead, focus on practical aspects related to field measurements of external forces using dynamometers following the general principles of ISO 11228-2, in order to contribute towards developing optimized and practical evaluation procedures, with special reference to digital dynamometers; the aim is also to support the future revision of ISO Standard 11228-2.
This International Standard requires the measurement of the following forces: initial force, by detecting the peak force in the initial phase of the pushing/pulling task; and sustained force, i.e. the force exerted along the entire path of travel following the initial phase. Dynamometers are used to obtain these measurements, and there are numerous types on the market, some analog and others digital. Analog dynamometers may display the highest force measured until reset: without recording information along the whole path of travel, the determination of sustained forces is complex and often subjective due to the need to detect force levels by observing a needle (or numbers on a display), which are continuously oscillating.
Digital dynamometers work like analog ones, but they measure, and can store, forces even with very high sampling rates over the entire path of the pulling/pushing task; the data may also be transferred to a computer for subsequent processing. It is plausible that digital dynamometers, which can record all the forces exerted during pulling and pushing, offer a higher guarantee of reproducibility. However, to our knowledge, no results have been published in the literature comparing analog and digital dynamometers. ISO 11228- 2 measurement procedures were developed with specific reference to analog dynamometer; therefore, it is necessary to verify they can reliably be applied to digital dynamometers.
Another aspect to be considered is the decision as to when push-pull tasks must be measured. In ISO/TR 12295 [10] the Quick Assessment method is used (by asking a few questions) to determine if risk is absent/acceptable or critical. According to this approach, subjective perceptions of exertion are of the utmost importance: indeed, when the subjective perception of exertion in pushing/pulling is more than “light” (i.e. a rating of over 2 on the Borg CR-10 scale [12]) force measurements are essential. This was the main reason why we were interested in comparing subjective judgments with kgf force measurements along the entire path of travel.
Taking into account the above considerations, this paper aims to:
- Review our experience in conducting pushing and pulling measurements in the field using digital dynamometers, and present examples of the measuring procedure we have developed, which could be implemented in the specific ISO Standards,
- Compare analog versus digital dynamometers, demonstrating the advantages of the latter.
- Evaluate the correlation between measured forces and subjective ratings of exertion (Borg CR-10 Scale).
Methods
Development of Criteria for Evaluating Pushing and Pulling Forces with Digital Dynamometers
This evaluation methodology (summarized below) was put together thanks to our many years of experience measuring pushing and pulling tasks with digital dynamometers in field conditions [13]. Examples of the application and limitations of the methodology are reported in the Results section.
The measurements were carried out following ISO recommendations and implementation methodologies.
Summary of the Main ISO 11228-2 Recommendations: The ISO Standard, briefly summarized here, includes the following steps for measuring initial and sustained forces.
ISO 11228-2: methodology for the evaluation of initial and sustained phase forces and relevant risk assessment:
- Record pushing (or pulling) forces along a path of travel and repeat the measurement 4-6 times. Measure peak force in the initial phase.
- In the sustained phase: move the cart through a straight- line distance of 1 meter, at a constant velocity of 0.33 m/s, then record the force used to keep the cart moving and calculate the average force value.
- Determine the average force for the 4-6 repetitions, separately for the initial and the sustained phase.
- Plot at least three consistent curves. The curves are consistent when the initial and sustained forces differ from the average by no more than 15%.
- Determine the initial and sustained force as the average of the three consistent curves and use them for the risk assessment.
Determination of Biomechanical Risk: Biomechanical risk is assessed by comparing actual initial and sustained forces with the recommended forces for the working population, broken down by gender, according to the following Indexes [9].
- Initial Force Index (I.F.I) = Initial Force Measurement/ Recommended Initial Force [1].
- Sustained Force Index (S.F.I) = Sustained Force Measurement/ Recommended Sustained Force [2].
In the ISO standard force is expressed in Newton’s, in accordance with the international system. In this paper, reference is made to kgf, which is widely used in field measurements.
Methodology for the Evaluation of Data Obtained with Digital Dynamometer: The recommendations for correctly assessing push/pull forces, as described above, can be very difficult to apply especially when paths of travel are uneven or bumpy. Based on our experience in the use of digital dynamometers in field conditions, the following methodology was developed and applied, as illustrated below, also using graphs obtained by means of a computer. The methodology involves:
- Depicting the forces derived from the repetition of measurements along the same route by graphs, overlapping them to facilitate their comparison to find three consistent measurements.
- Making a preliminary qualitative consistency evaluation of the repeated measurements, before seeking quantitative consistency (measurements falling within the limits of a 15% difference). This procedure could be defined as the “preliminary data cleaning” of force measurements, and is repeated along the same path; this is essential for selecting force curves to be used in the subsequent quantitative evaluation of consistency.
- Depicting an average curve representative of the recorded force measurements obtained for the same path (using only the qualitatively consistent curves): this average curve makes it easier to determine the start of the sustained phase, identified, when possible, as the time corresponding to the lowest force value following the highest one.
- Lastly, determining the quantitative consistency present when the force curves differ from the average by less than 15%. To obtain a reference value for calculating the percentage deviation, the average force for the entire series must be calculated separately: i.e. for the peaks of the initial phase and for the sustained phase. Examples of the application of the procedure are presented in detail in the Results paragraph, with reference to specific cases.
Comparison Between the Performance of Analog and Digital Dynamometers
If the dynamometers are calibrated correctly, the collection of point force data with an analog or digital dynamometer will be superimposable without showing any differences in accuracy between the two models. The dynamometers used for the measurements carried out in this work have calibration certificates issued by the manufacturer and by a laboratory certified by Accredia, according to the specific standards UNI 10127-2 and UNI-EN 6789:2017. The reproducibility tests performed, therefore, do not concern the accuracy with which the dynamometer detects the forces, but rather the human error in interpreting the forces measured by the two dynamometers, mainly due to how the dynamometer itself highlights the measurements, and how easily the operator can read and interpret them. The following methodology was used to study reproducibility in the reading of measurements. Repeated measurements were performed by two operators (OP A and OP B) with analog and digital dynamometers (for the latter after only rough qualitative data cleaning), both with a sampling rate of 100 Hz, on 32 pushing and pulling tasks using wheeled carts filled with loads of different weights, as detailed here:
Type and Dimensions of Carts
- 120-litre plastic bin, 2 wheels, containing unsorted waste (max. 13-15 kg), glass (max. 28-30 kg) or sanitary waste (max. 36-40 kg): 8 evaluations.
- 240-litre plastic bin, 2 wheels, containing unsorted waste (max. 26-30 kg), glass (max. 55-60 kg) or sanitary waste (max. 71-75 Kg): 8 evaluations.
- 360-litre plastic bin, 4 wheels, containing unsorted waste (max. 40 kg) or unsorted sanitary waste (max. 108-110 kg): 6 evaluations.
- 550-litres metal bin, 4 wheels, containing metal scrap: 4 evaluations.
- 1100-litre plastic bin, 4 wheels, containing unsorted waste (max. 120 kg) or unsorted bulky waste (max. 330 kg): 6 evaluations. Distance Covered: 7.5-15 Meters. Surface Conditions: Asphalt Pavement.
Each operator repeated the same measurements, under the same conditions, twice using the analog dynamometer and twice using the digital device, following ISO 11228-2. A total of 128 measurements were performed.
The analog dynamometer was tested first, and then the same operations, under the same conditions, were repeated with a digital dynamometer. Measurements were recorded in succession from the lightest to the heaviest load.
In addition, 100 pushing/pulling tasks were measured by two different operators in similar worksites with the same carts, loads and paths as those reported above, using digital dynamometers only (with a sampling rate of 1000 Hz), after verifying qualitative consistency.
Correlation of Force Measurements with Subjective Effort Ratings (Borg CR-10 Scale)
Perceived effort should be rated separately for the initial and the sustained phases. However, in the course of our research (which included an initial set of 76 push/pull tasks and a second set of 114), interviewees struggled to come up with two distinct strength ratings using the Borg CR-10 (12) scale for the initial and sustained phases, expressing only one overall score.
The force measurements recorded with the digital dynamometer (along a path, thus including peak and sustained phases) were compared with the subjective ratings obtained via the Borg Scale. Hence, two columns of paired data were obtained: one indicating subjective effort expressed on a Borg CR-10 scale (“x” being the independent variable) and the other indicating force in kgf, depicting force as the average and the 75th percentile, along the entire path (“y” being the dependent variable). A regression analysis was applied to these data, as a descriptive statistical function, to estimate the relationships between two sets of values, in search of associations.
Results
Results Obtained from An Original Methodology for Processing Pushing and Pulling Forces Measured with a Digital Dynamometer
The methodology that was developed and implemented by the authors is illustrated below, and includes measurements and examples.
Examples of Forces Measured with Digital Dynamometers and Qualitative Data Cleaning after Uploading to A Computer: The curve in Figure 1A) shows the force applied when pushing/pulling a cart in an ideal push/pull task: in this case the initial and sustained forces can be easily identified. In field conditions, the measurement curves show significant deviations from the ideal situation. In example 1, Figure 1B) shows four sets of force measurements, repeated along the same path (as suggested in ISO 11228-2 for determining consistent curves) in a push task carried out on smooth asphalt. In this case the measured forces are characterized by limited fluctuations. However, the force required to push or pull a load may vary considerably depending on how uneven the surface is, the type of floor or ground, the type of wheels, and other variables. In example 2, Figure 1C) shows force measurements along a path over an uneven surface, with significant force fluctuations. In this case evaluating consistent curves and pinpointing the initial and sustained forces may be more complex.
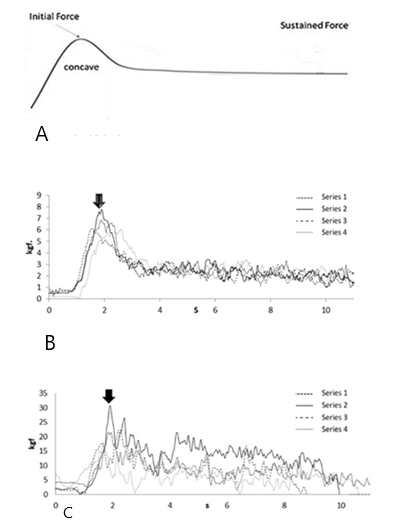
Figure 1: Graphs showing examples of force measurements when pulling. The black arrow indicates the highest peak force detected in the initial phase. A) Theoretical/ideal case. B) Example 1: Push/pulling on even surface (smooth asphalt) with moderate force fluctuations. C) Example 2: Push/pulling on uneven surface with significant force fluctuations.
First Qualitative Consistency Evaluation of Force Curves Repeated for the Same Path: Examples of qualitative consistency assessments are shown in Figure 2, where the graphs, relating to examples 3 and 4, represent the situation before and after seeking qualitative consistency. More difficult to explain than to observe, it is simply a matter of visually comparing the curves relating to the force measurements and eliminating the anomalous curves. Examples of the application of this methodology for the purposes of qualitative cleaning are illustrated in detail below, with reference to the results reported in Figure 2, namely:
- Only measurements performed correctly in accordance with ISO 11228-2 were used.
- 4 measurements were taken on the same path, endeavoring to start recording at the very beginning of the push/pull action and continuing to record the measurement for its entire duration.
- The dynamometer data was uploaded to a computer and the measurements were compared (with one series of data for each recorded force curve, in paired columns).
- The data obtained was depicted graphically, eliminating any series with obvious artifacts or execution errors (e.g. Figure 2, part A, series 1) thus obtaining qualitatively consistent curves.
- Taking only qualitatively consistent series, the start of the force curves was located at the point where the curve for the initial phase begins to rise (e.g. Figure 2, part B): in the graph the values for the force measurements recorded before the initial phase and the anomalous curve (series 1) are eliminated.
- Initial Force peaks were aligned. It is preferable to discard non-aligned force curves if the operator cannot use an alignment program (e.g. Figure 2, part C, series 1).
- Any forces lower than 0.5 kgf were eliminated from the data set, thus avoiding the risk of including technical anomalies, or noise.
- If necessary, any recordings with negative values were transformed in positive: the data must include only positive force measurements, indicated separately for pushing and pulling.
Hopefully more complex programs will soon be developed that are better able to represent the overlapping measurement curves, plotted along the same path, for example, by normalizing the curves as a function of duration. In the meantime we have created a spreadsheet for representing the data, allowing to clean them qualitatively and quantitatively and to proceed then at the final risk assessments: it can be downloaded free of charge from: http://www.epmresearch.org/a57_free-software-in-english. html (Figure 2)
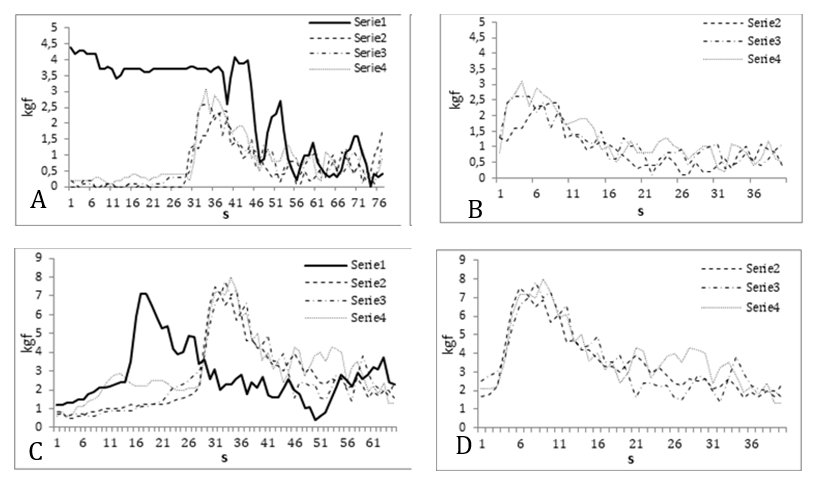
Figure 2: Graphs depicting force curves, along the same path, obtained from 4 overlapping recordings: first qualitative search for consistency. In Examples 3) and 4), series 1 has been removed from Figures 2, A) and C), thus producing two new graphs in the same Figure 2 but- B) and D) – which are now qualitatively clean. A) Example 3: Four successive readings along the same path of travel: Series 1 not consistent due to technical execution error. B) Example 3: Result of the first qualitative search for consistent curves. C) Example 4: Four successive readings along the same path of travel: Series 1 not consistent for early peak. D) Example 4: Result of the first qualitative search for consistent curves: if series 1 can be aligns, it should not be eliminated.
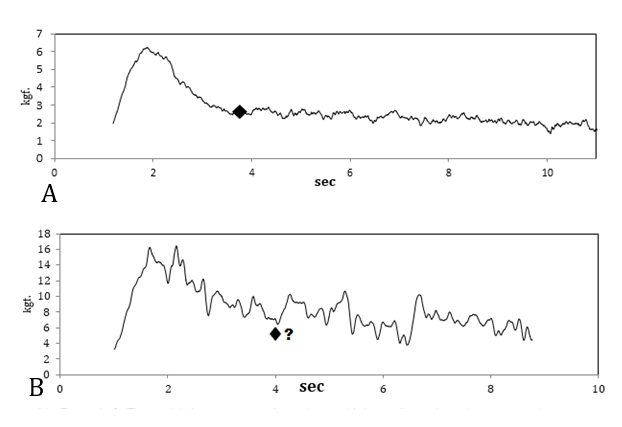
Identifying the Start of the Sustained Phase: By graphically depicting the average curve, representative of the measurements (after qualitative cleaning) for the path of travel, it is easier to determine the start of the sustained phase. In the case of pushing or pulling along a smooth path, the start of the sustained phase can be identified as the time corresponding to the lowest force value immediately following the highest value (marked with a rhombus in the graph in Figure 3, first part that represents the average curve of example 1, showed in Figure 1B). More complex is the identification of the start of the sustained phase for pushing or pulling over rough terrain, that represents the average curve of example 2 showed in figure 1C (Figure 3, second part). If it is difficult to find this point, make a “common sense” decision, or proceed as indicated in the next paragraph dedicated to methods for evaluating forces, where the initial and sustained phases are no longer distinguishable.
Quantitative Consistency Assessment (ISO 2007): Going back to the examples in figure 1, the four sets of recordings have already been “qualitatively cleaned”, i.e., the four curves are consistent with each other, at least qualitatively. It now remains to determine whether they are also quantitatively consistent, i.e., if they differ from the average by no more than 15%. Taking the initial phase and the sustained phase +separately, the percentage differences of each series are calculated versus the corresponding total average. The results for example 1 of figure 1 are shown below (with % deviations from the mean for the series measured along the same path in brackets):
- Initial force (kgf): mean peak = 4.81; series 1 peak = 4.99 (3.6%); series 2 peak = 5.03 (4.6%); series 3 peak = 4.7 (2.3%); series 4 peak = 4.53 (5.9%),
- Sustained force (kgf): mean = 2.16; series 1 mean =2.11 (2%); series 2 mean = 2.17 (0.5%); series 3 mean =1.99 (7.9%); series 4 mean = 2.36 (9.3%).
Since all the percentage differences for all four sets of curves are within 15% of the total average, the four curves are considered to be consistent, also quantitatively.
The results for example 2 of figure 1 are different: unlike example 1, pushing the load over uneven ground generates considerable fluctuations:
- Initial force (kgf): mean peak = 23.20; series 1 peak = 18.11 (21.9%); series 2 peak = 30.69 (32.3%); series 3 peak = 22.53 (2.9%); series 4 peak = 21.41 (4.7%),
- Sustained force (kgf): mean = 9; series 1 mean = 5.72 (36.5%); series 2 mean =14.13 (57%); series 3 mean = 8.04 (10.7%); series 4 mean =8.13 (9.8%).
In example 2, described above, the curves for series 1, and especially series 2, differ considerably from the average for all four curves taken together, differing much more than the recommended 15%, unlike series 3 and 4 where the difference is around 10%. Based on a quantitative analysis, series 1 and 2 should therefore be eliminated from the calculation of the initial and sustained force measurements for this path. In this case, ISO 11228 would, strictly speaking, call for additional measurements to be repeated, until three consistent measurements are obtained. In addition to evaluating the average force values, as per the ISO Standard, a parallel evaluation of the 75th percentile was also carried out, assuming that, without excessively flattening the results as averaging would do, it might better predict disorders caused by biomechanical overload (this assumption needs to be verified by epidemiological studies).
Limitations of the Proposed Methodology when the Initial and Sustained Phases are not Evident (Over Rough Terrain or Along Paths with Turns, etc.): A new proposal Figure 4 shows examples of measurements for pushing/ pulling relatively full 4-wheeled carts over different types of “rough” terrain (sand, fine gravel, cobblestones, dirt road, etc.).
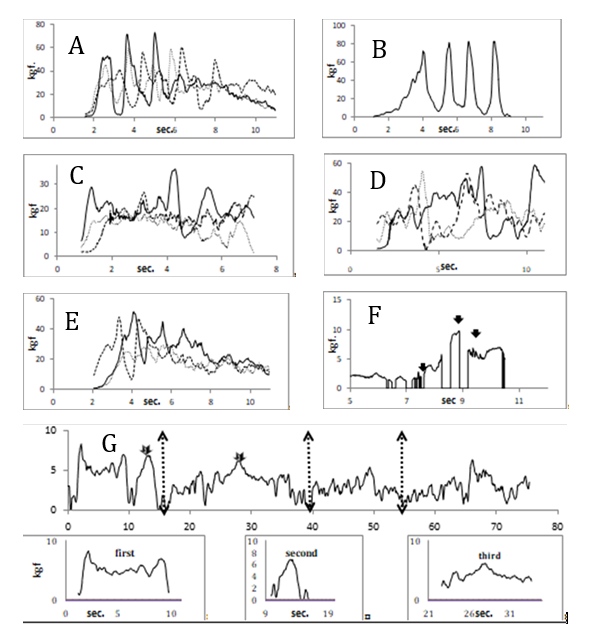
Figure 4: Examples of representative force curves measured over uneven and rough surfaces such as gravel, sand, cobblestones etc. with 4-wheel, relatively full carts. Maximum peak and sustained forces (50th and 75th% percentiles) are calculated over the entire path. A) Cart pulled over fine gravel: Overlapping consistent path curves (no.3), Maximum peak=kgf72; average=kgf25; B) Cart pushed over grass: Average curve Max peak=kgf82; average=kgf15.2; 75th%ile=kgf39.2. C) Cart pushed over cobblestones: Overlapping consistent path curve (3) maximum peak=kgf36.3; average=kgf16; 75th%ile=kgf18.8. D) Cart pushed over sand: Overlapping consistent path curves (3) Maximum peak=kgf59; average=kgf21; 75th%ile=kgf29. E) Cart pushed over dirt road: Overlapping consistent path curves (no.3) Maximum peak=kgf51; average=kgf17.5; 75th%ile=kgf23.3. F) Cart pulled over bridge with steps Average curve Max peak=kgf17; average=kgf2.2; 75th%ile=kgf4.2. G) Forces measured using a digital dynamometer along a path with five turns. Identification of initial and sustained forces.
All the measurements, depicted graphically, were obtained with a digital dynamometer; the first observation that can be made is that there is no initial phase followed by a typical sustained phase. It should be noted that, in all of these situations, the consistency of successive measurements, based on the principle of deviating less than 15% from the mean, is not really applicable. Similar graphs were obtained from paths of travel over grass (Figure 4B) or with steps (Figure 4F). In particular, with regard to pulling a load over a surface with steps, the graph shows that when a step is encountered, the cart actually comes to a stop (force exertions drop to 0 kgf): at each step there is a very short initial phase and an equally short sustained phase. Other specific cases include pushing/pulling carts along paths with turns: Figure 4G shows forces measured along a path with multiple turns (indicated by arrows, illustrating the entire 80-sec path). It can be seen that just before entering into a turn the cart slows down and there is a significant reduction in the amount of force exerted, followed by a recovery and a new peak, which can be considered as representative of a new initial phase that starts when the turn is completed. In situations such as these (which are very frequent in hospitals, for example, when transporting stretchers) the problem arises when it comes to choosing criteria for calculating the representative initial force and sustained force along a path with different types of turns followed by straight sections. Figure 4G also shows three turns, extrapolated from the total path of travel. For these, which could be considered as stand-alone paths, it is often difficult to locate the initial peak force and beginning of the sustained phase. To conclude, all the examples shown through graphs in Figure 4 are characterized by a random series of peaks. This can be explained by the unevenness of the terrain: a new peak exertion force is created every time a surface irregularity is encountered (cracks, steps, bends, etc.). The ISO standard does not specifically address how to deal with the assessment of these conditions: therefore, the following alternative solution was adopted:
- consider the path measurement as a single path without breaking it down into initial and sustained,
- record only the curves with qualitative consistency (since quantitative consistency cannot be assessed),
- look for the highest peak over the entire path of travel (to be taken as the maximum force exerted, instead of the initial force),
- Calculate both the average value and 75th percentile again over the entire path.
Results of Inter and Intra-Observer Reproducibility Tests Comparing Analog and Digital Dynamometers
The results of the T-test for analyzing intra- and inter- observer reproducibility were obtained by examining 32 pulling tasks (128 measurements). The test is statistically significant with p>0.05. The results of intra-observer tests are reported below: Analog dynamometer:
- initial force- op A: p=0.95 (df 31); op B: p=0.24 (df 31)
- sustained force- op A: p=0.3 (df 31); op B: p=0.63 (df 31) Digital dynamometer:
- initial force- op A: p=0.49 (df 27); op B: p=0.70 (df 28)
- sustained force- op A: p=0.99 (df 27); op B: p=0.19 (df 28) The results of inter-observer tests are reported below: Analog dynamometer:
- Initial force- op A/op B: p=0.003 (df 31)
- Sustained force- op A/op B: p=0.021 (df 31) Digital dynamometer:
- Initial force- op A/ op B: p=0.846 (df 28)
- Sustained force- op A/ op B: p=0.270 (df 28) The data shown above indicate that both analog and digital dynamometers satisfy intra-observer reproducibility requirements with p>0.05.
The results for inter-observer reproducibility are different: while reproducibility appears substantially satisfactory with digital dynamometers, this is not the case for analog dynamometers, with reference to both the initial and the sustained phase (p<0.05).
The results seem to confirm what was expected, namely that digital dynamometers, which record forces along the entire path, may offer the possibility of presenting results as print-outs that can be checked immediately, whereas with analog dynamometers, the average sustained phase is obtained by observing a fluctuating needle or fluctuating numbers!
Intra- and inter-observer reproducibility drastically improved when digital dynamometers were used, after “cleaning” the data according to the methodology indicated above. Based on a further sample of 100 observations of pushing/pulling tasks, made by two independent operators using digital dynamometers following only the procedure described above, the intra- and inter-observer p-values were equal to 0.91 and 0.86, respectively: decidedly good outcomes.
In spite of the limitations of the investigation, the results indicate a better performance for digital dynamometers especially in inter-observer tests. Additional and more extensive investigations could help support our findings. The users (health and safety officers, corporate practitioners, etc.) will always be able to use analog dynamometers in accordance with ISO 11228-2, but the results of the risk assessment, especially in relation to the sustained phase, might be less reliable, with consequent impacts on the outcome of the risk assessment.
Comparisons Between of Push/Pull Measurements and Subjective Force Ratings Using the Borg CR-10 Scale [12].
For reasons of space only the 75th percentile results are reported here, however, the 75th percentile also produced better results in terms of the significance of relationships between the two variables.
Figure 5 shows a summary of the measurements performed by two different groups of operators on two different samples, one comprised of 76 paths of travel (part A) and the other of 114 (part B). The workers were interviewed and asked to express their judgment of the force exerted just after executing the pulling or pushing task, using the Borg CR-10 scale; they were shown a page containing both descriptive words referred to force (mild, moderate, strong, etc.) and the corresponding numbers from 0 to 10. Each subjective judgment (ranked from 0 to 10 over the entire path) therefore corresponds to a consistent measurement of the pushing or pulling force (expressed in kgf) to represent the average measurement for the path).
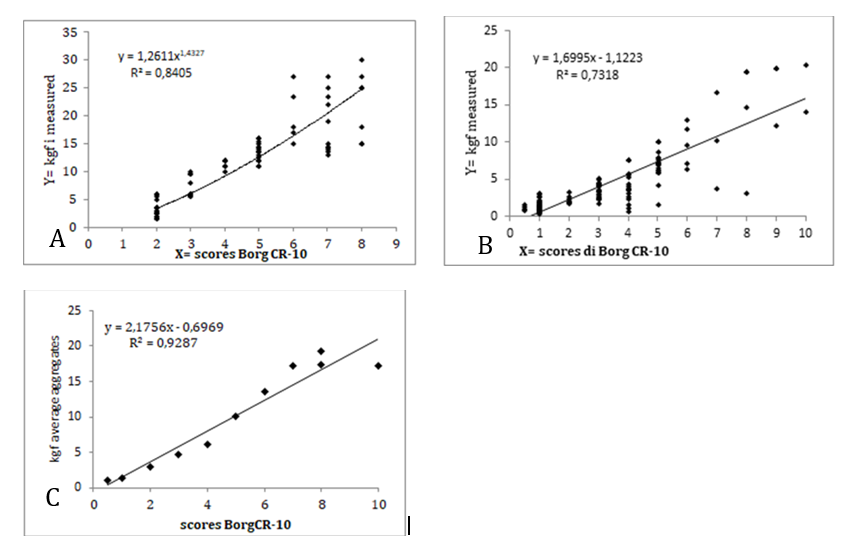
The distribution of data points is shown with the best descriptive function: the power function (Figure 5 part A) or the linear function (Figure 5 part B) and the corresponding R2, which measures the percentage variation of the dependent variable explained by the variation of the independent variable. In the example (part A), the finding R2=0.84 means that 84% of variations in the dependent variable correlate with variations in the independent variable; in the measurement reported in part B), R2= 0.73. To avoid data dispersal, the force measurements (in kgf) were grouped around each individual Borg CR-10 score (Figure 5, part C). Each individual Borg CR-10 score (x axis) was matched with the average score for all measured forces, in kgf, corresponding to that Borg CR-10 score (y axis). After merging the data collected from the two teams described in Figure 9 parts A) and B), the regression was again analyze and found to produce a highly significant regression line: R2= 0.928 (Figure 5, part C).
These results prove that there is a close correlation between the subjective judgment of applied force (an overall assessment that does not distinguish the initial phase from the sustained phase) and the force, measured in kgf, and thus help to give predictive value to the subjective perception. This correlation is also very useful for analyzing the “quick assessment” strategy, proposed in the ISO/TR 12295 (10), especially when it is not possible to use a dynamometer to measure force for the purposes of risk assessment.
Discussion and Open Issues
Our long-term practical experience in evaluating pushing and pulling tasks have led us to suggest the applications shown here. We have summarized the latest available information deriving from the specific ISO Standard and also taken into account demands for practical solutions for evaluating the interesting and more precise force measurements now provided by digital dynamometers. We have also highlighted some new perspectives and uncertainties that might warrant future investigation. Some of most relevant aspects are discussed below.
Measurement Frequency Content and Optimal Acquisition Rate
The curves depicting systematic measurements of pushing and pulling tasks using the same dynamometer indicate two typical trends:
- curves without significant force oscillations in the case of pushing and pulling over flat/smooth surfaces (Figure 1),
- curves with significant force oscillations in the case of pushing and pulling over rough ground (e.g., stone floors, gravel, potholes, as in Figure 4) where the curves seem to reproduce the characteristics of the ground: the more uneven the ground, the wider the oscillations.
For example, every time the wheels of the cart encounter a pothole, rough surface, or cobblestones, they slow down (or even stop) the cart’s motion and generate a very short peak force (high and fast) to overcome not only the inertia, but also the minor obstacle. The wheels are also unable to remain straight and end up being pushed every which way, generating asymmetrical and also very frequent peak forces.
One might debate how to interpret these oscillations and if the values represent real forces or rather are affected by erroneous or adulterated measurement. Since the fluctuations become more frequent and show greater amplitude the rougher the terrain, we argue that fast-rising peak forces basically reflect the physical phenomena. Similar results were obtained from measuring pushing and pushing forces using digital dynamometers with sampling rates of 100 Hz and 1000 Hz.
This whole discussion, which highlights emerging problems associated with carrying out this type of assessment, also hopes to encourage the manufacturers of dynamometers to adapt their devices to the study of pushing and pulling, including the evaluation of force measurements (e.g. allowing the user to directly evaluate peak force and sustained force, when applicable, or for “cleaning” the data to eliminate erroneous or adulterated measures).
Evaluation of Pushing and Pulling Forces Over Rough Terrain and Other Special Cases
The ISO Standard procedure is not always applicable for pushing and pulling tasks over rough terrain and in other situations where the initial peak and the sustained phase may not be clearly defined. In such cases, the suggestion is to calculate the peak force, the average value, and the 75% percentile along the whole path.
All the above suggestions, which may imply modifications of the present ISO criteria, deserve further discussion. There is no question that there are still open issues to be looked into, such as how to analyze push/pull forces over slopes, or those required to stop a cart once in motion, or how to measure forces when using only one upper limb, etc. which the length of this paper does not allow for.
Conclusion
- Preliminary results of inter- and intra-observer reproducibility tests have confirmed the advantages of digital versus analog dynamometers.
- The ISO standard was developed with specific reference to analog dynamometers. Based on many years’ experience, practical suggestions for the evaluation of measurements obtained with digital dynamometer are offered in this paper as a possible contribution towards the future revision of the Standard.
- For normal push/pull force measurements along a relatively smooth path, indications are given for determining peak force and sustained force based on digitally stored data, in compliance with ISO criteria.
- Force curves obtained when pushing/pulling over rough ground are characterized by frequent force oscillations that seem to reproduce the characteristics of the ground. New criteria are proposed for evaluating the risks posed by such situations.
- Comparisons between measurements of push/pull actions along paths of travel and subjective ratings of exertion using the Borg CR-10 Scale (12) have proven that that there is a close correlation between subjective judgment and applied force (75th percentile) in kgf, measured along the entire path.
Many open issues still remain but we hope we have encouraged researchers, as well as producers of dynamometers and software, to continue these studies; hopefully in the near future they will lead to a more accurate assessment of biomechanical overload associated with pushing/pulling tasks.
References
-
Glitscha U, Ottersbacha HJ, Ellegasta R, Schaub K, Franzc G, et al. (2007) Physical workload of flight attendants when pushing and pulling trolleys aboard aircraft. International Journal of Industrial Ergonomics 37(11- 12): 845-854.
-
Argubi WA, Wollesen B, Leitner M, Mattes K (2016) Human body mechanics of pushing and pulling: analysing the factors of task-related strain on the musculoskeletal system. Safety and Health at Work 8(1): 11-18.
-
Wiggermann N (2017) Effect of a powered drive on pushing and pulling forces when transporting bariatric hospital beds. Applied Ergonomics 58: 59-65.
-
Snook SH, Ciriello V (1991) The design of manual handling tasks: revised tables of maximum acceptable weights and force. Ergonomics 34: 1197-1213.
-
Mital A, Nicholson AS, Ayoub MM (1997) A Guide to Manual Materials Handling. 2nd(Edn.), Taylor & Francis, London, Washington, DC, pp: 152.
-
Jager M, Luttmann A (2007) Musculoskeletal load of push-pull tasks. International Journal of Industrial Ergonomics 37: 823-824
-
Schaefer P, Boocock M, Rosenberg S, Jager M, Schaub K (2007) A target-based population approach for determining the risk of injury associated with manual pushing and pulling. International Journal of Industrial Ergonomics 37: 893-904.
-
Kuijera PFM, Hoozemansb MJM, Frings-Dresen MHW (2007) A different approach for the ergonomic evaluation of pushing and pulling in practice. International Journal of Industrial Ergonomics 37: 855-862.
-
ISO 11228-2. Ergonomics: Manual handling-Pushing and pulling (2007) Geneva, Switzerland.
-
ISO TR 12295 (2014) Ergonomics-Application document for International handling (Standards on manual ISO 11228-1, ISO 11228-2 and ISO 11228-3) and evaluation of static working postures (ISO 11226). Geneva, Switzerland.
-
Colombini D, Occhipinti E, Alvarez CE, Waters TR (2013) Manual Lifting: A Guide to the Study of Simple and Complex Lifting Tasks. CRC Press, Boca Raton.
-
Borg GAV (1998) Borg’s Perceived Exertion and Pain Scales, Human Kinetics, Champaign (USA).
-
Cerbai M, Placci M (2018) Push and Pull: Force measurement updates, interpretation of measurements and modes, peculiarities (curves, steps, etc.). Multi-task analysis. Conference proceedings IEA 2018 meeting Florence.
- The Expanding Landscape of Road Rage: A Systematic Review of Conflicts Involving Drivers, Pedestrians, and Micromobility
- Validating Cognitive Models of Royal Navy Performance on Control Systems
- Comparing Standard and State-of-the-art Firefighter Coats on Postural Balance and Gait in a Live Burn Environment
- Investigating the Integration of Telemedicine into Clinicians Workflow: A Review of Methods
- Risk Assessment of Ergonomic Factors in a Textile Firm by RULA, REBA and Fine Kinney Methods
- Impact of Self-Esteem Training on Individuals with Disabilities Aged 17-30