Poor Sleep Quality and Associated Factors among Midlife Women at Dessie Town, Northeast Ethiopia, 2022: A Cross-Sectional Study
Introduction: Poor sleep quality is defined as a lack of restful and restorative sleep, which is a common complaint among midlife women. There aren't enough studies on the prevalence and contributing factors of poor sleep quality among Ethiopian midlife women, even though it affects these women's quality of life. Therefore, this study aimed to determine the prevalence and associated factors of poor sleep quality among midlife women in Dessie town. Methods: A community-based cross-sectional study was conducted from April 01, 2022, to May 01, 2022. A cluster sampling technique was employed. Moreover, data were collected using interviewer-administered pretested questionnaires. Data were entered and analyzed using Epidata version 3.1 and SPSS version 26 respectively. Bivariable and multivariable binary logistic regression analysis models were fitted to find the association of each independent variable with the outcome variable. The strength of the association was computed by using an adjusted odds ratio with a 95% confidence interval. Variables having a P-value ≤0.05 were considered statistically significant. Result: A total of 652 women were included in the study with a response rate of 98.3% and the mean age was 47.6 ±5.81 with the age range of 40-65. The prevalence of poor sleep quality among midlife women in Dessie town was 55.5% (95% CI (=51.9, 59.0)). Women who had no formal education (AOR=2.51, 95%CI(=1.30, 4.86)),being obese (AOR=2.41, 95% CI(=1.10, 5.32)), khat chewing(AOR=2.05, 95% CI(=1.13, 3.74)), hot flashes (AOR=5.58, 95%CI(=3.31, 9.39)), being Diabetics (AOR=3.16, 95% CI(=1.43, 6.94)), having stress (AOR=2.72, 95 % CI (=1.32, 5.59)) were significantly associated with poor sleep quality. Conclusion: More than half of the participant had poor sleep quality. Lack of formal education, khat chewing, being obese, diabetic, and having hot flashes and stress were significantly associated with poor sleep quality. It is recommended to avoid modifiable risk factors.
Introduction
Poor sleep quality defined as a lack of restful and restorative sleep which is a common complaint among midlife women [1]. Which is associated with a decrease in estrogen secretion [2]? During this time, women commonly report reduced sleep quality due to significant physiological changes such as vasomotor symptoms (hot flashes, night sweats), sleep-disordered breathing (SDB), frequent nocturia, and osteoporosis [3, 4, 5]. Approximately one-third of the world’s population has poor sleep quality [6]. The overall pooled prevalence of poor sleep quality in low and middle- income countries was 33.2 % [7]. Over 40-60% of midlife women have poor sleep quality [8]? The prevalence of poor sleep quality among midlife women in the United States is estimated at 31 % [9]. Furthermore, studies conducted in Latin America, Europe, and Asia revealed that the prevalence of poor sleep quality among midlife women ranged from 20% [10] to 67.8% [11]. Moreover, the prevalence of poor sleep quality among midlife women has increased in Africa, with 59.6% in Cameron [12] and 69.5% in Egypt [13]. The prevalence of poor sleep quality in the Ethiopian population was 53% [14]. However, there is no enough study on the prevalence of poor sleep quality among Ethiopian midlife women.
The main symptoms of not getting enough quality sleep are fatigue, daytime sleepiness, falling asleep while driving, personality changes, difficulty paying attention or concentrating at work, slowed responses, and memory problems [15]. Poor sleep quality during midlife is caused by a combination of factors such as socio-demographic characteristics (age, occupation, educational status, Employment), midlife status (premenopause, perimenopause, post-menopause), vasomotor symptoms (hot flashes, night sweats), comorbidities (hypertension, arthritis, diabetics), anxiety, depression, and lifestyle (smoking, alcohol drinking, physical exercise, caffeine intake) [1, 16, 17, 18].
Increased stress reactivity, somatic difficulties, poor quality of life, emotional distress, mood disorders, cognitive impairments, memory loss, performance deficiencies, and behavioral problems are some of the short-term consequences of poor sleep and Long-term consequences of poor sleep quality include hypertension, dyslipidemia, cardiovascular disease, metabolic syndrome, and Type 2 Diabetes Mellitus, as well as an increased risk of cancer and death [19]. To improve poor sleep quality, cognitive behavioral therapies such as counseling, sleep hygiene practices e.g. maintaining a regular sleep schedule, getting regular exercise, minimizing noise and light, and medications such as hormonal replacement therapy for midlife women were administered [20, 21].
Even though poor sleep quality has an impact on midlife women’s quality of life, productivity, social interaction, and the cost of medication to treat sleep disorders, there have been not enough studies on the prevalence and associated factors of poor sleep quality among Ethiopian midlife women. As a result, the current study will narrow this gap by providing information about the problem. Therefore, this study aimed to assess the prevalence and associated factors of poor sleep quality among midlife women in Dessie town, Northeast Ethiopia.
Methods and Materials
Study Setting and Population
A community-based cross-sectional study was conducted in Dessie town from April 1st to May 1st, 2022. Dessie is the capital of Ethiopia’s south Wollo administration zone, located 471 kilometers east of Bahir Dar, the capital of the Amhara regional state, and 401 kilometers north of Addis Ababa, the country’s capital. The town is situated at 11°8′ N 39°38′ E, at a height of 2,470 to 2,550 meters above sea level. The current estimated total population of Dessie is 285,530 people, with 152,283 women and 26,219 women aged 40 to 65 years old, according to the 2007 census and projected to the current population [22]. Dessie is divided into 5 sub- cities, all with 22,393 households.
All women aged between 40 and 65 in Dessie town were the source populations for this study and among those all women aged between 40 and 65 in randomly selected sub- cities were study populations. The study included women between the ages of 40 and 65. Women, who were taking hormone replacement therapy, newcomers to the house (stayed less than six months), critically ill and unable to communicate at the time of data collection were excluded from the study. The outcome variable of the study was Poor Sleep Quality and the independent variables includes age, marital status, education, employment, premenopause, perimenopause, post menopause, hot flashes, night sweats, chronic disease, depression, anxiety, stress, physical activity, caffeine use, smoking, and alcohol consumption were used as independent variables.
Operational Definitions
- Sleep Quality: is a condition of women’s sleep, whether good or poor determined by the Pittsburgh Sleep Quality Index (PSQI), PSQI scores of more than 5 were classified as poor sleepers and ≤5 as good sleep quality [16].
- Menopause: usually occurs in the midlife of women 40 to 65 years of age [23, 24].
• Vasomotor Symptoms: (Hot Flashes) Are Sudden Feelings Of Intense Body Heat That Can Occur During The Day Or Night [16].
• Habitual Khat Use: was defined as chewing at least once a week while occasional use was defined as khat chewing less than once in a week, Never khat chewer is defined as never chewed khat during his lifetime [25, 26].
• BMI Classification: Normal BMI = ≤ 25 kg/m², Overweight if BMI = 25-30 kg/m², Obese if BMI ≥ 30 kg/m² [27].
**Sample Size Determination**
The sample size was determined by the single population proportion formula
$$n_i = \text{Deff} \times (Z \alpha/2)^2 p(1-p) \times 1.5 \times (1.96)^2 \times 0.5(1-0.5) \times 576 \times (0.05)^2$$
$$n_i = \text{minimum sample size required for the study}$$
$$p=50\%, \text{due to the lack of a study in a population with similar socio-demographic characteristics}$$
$$Z = \text{Standard normal deviation at 1.96 (which corresponds to 95% level)}$$
$$d = \text{margin of error (5%)}$$
$$\text{Deff} = \text{design effect} = 1.5$$
Adding 10% for the non-response rate, the final sample size for this study was 634.
Due to cluster sampling, 652 women were included in this study.
**Sampling Technique and Procedures**
The study subjects were chosen using a cluster sampling technique that includes simple random sampling. First, four sub-cites were selected from a total of five using simple random sampling. Then, eligible women between the ages of 40 and 65 were interviewed in a household chosen using house numbers in sequence. When participants could no longer be reached at home, three additional attempts were made to interview each eligible respondent rather than skipping them entirely. If the individual could not be interviewed after three attempts, the cases were closed.
**Data Collection Procedures and Tools**
After receiving written informed consent from participants, each study participant’s socio-demographic, behavioral factors, clinical factors, midlife status, and vasomotor symptoms were collected using a pre-tested structured questionnaire adapted from kinds of literature [1, 4, 16]. Two trained data collectors (two BSc nurses) and two supervisors (both MSc holders) were hired and received one day of training. The supervisors and principal investigator monitored the data collection process daily, and corrective measures were implemented based on the issues encountered.
**Sleep Quality**
The Pittsburgh Sleep Quality Index (PSQI) was used to collect subjective sleep quality using a pre-tested Amharic version. Subjective sleep quality, sleep latency, sleep duration, habitual sleep efficiency, sleep disturbances, use of sleeping medications, and daytime dysfunction are among the 19 items that make up the PSQI. A single global score ranging from 0 to 21 is calculated by adding the seven component scores. The PSQI global score, with optimal cut-off scores of 5, is a valid measure of sleep quality in midlife women. Cronbach’s alpha of 0.702 [28].
**Anxiety and Depression**
The Hospital Anxiety and Depression Scale were used to assess women’s mental health (HADS). The HADS is a self-administered scale that is commonly used in clinical and general populations to quantify anxiety and depression severity and to identify cases of these disorders [29]. The HADS is divided into two subscales, each with seven items, to assess anxiety and depression. A higher score on a Likert scale indicates more severe symptoms. The total score is calculated by adding the scores for each item on the anxiety and depression subscales (range 0–21). It was validated in Ethiopia, and the internal consistency for the anxiety, depression, and full-scale subscales was 0.78, 0.76, and 0.87, respectively. For anxiety and depression, a cut-off score of greater than or equal to 8 is used on the scales [29].
**Perceived Stress**
A 10-item perceived stress scale (PSS-10) was used to assess women’s stress levels over the previous month. The tool responds on a 5-point Likert scale. 0 = Never, 1 = Almost Never, 2 = Sometimes, 3 = Fairly Often, and 4 = Very Often were assigned to each item. The total score ranged from 0 to 40 on a scale of one to ten. Low-stress scores ranged from 0 to 13, moderate stress scores ranged from 14 to 26, and high perceived stress scores ranged from 27 to 40 [30]. A reliability test was conducted in Ethiopia, and the results were positive (Cronbach’s alpha = 0.84) [30, 31].
**Data Quality Control**
To maintain consistency and reduce information bias, the questionnaire was first developed in English, then translated into Amharic, and lastly retranslated into English by language experts. Two BSc nurses and two public health professionals (MSc) were employed for data collection and supervision respectively. Data collectors and supervisors get one day of training about the data collection process. The questionnaire was pretested in 5% or 30 of the total actual sample size of volunteer participants of midlife women at Kombolcha town before the real data collection process to increase the validity and quality of the data. Supervisors and the principal investigator monitored the data collection process daily so that responses could be given based on the problems encountered.
Data Processing and Analysis
After data were collected, it was checked for completeness, coded, and entered into the computer using Epi-Data software version 3.1. Then, it was exported to SPSS version 26 for analysis. Descriptive data were presented in tables and text with means, standard deviations, proportions, and frequency distributions. Bivariable and multivariable binary logistic regression analyses were performed to determine the potential associated factors for sleep quality in menopause. Variables having a p-value <0.25 in the bivariable binary logistic regression were fitted into the multivariable binary logistic regression model for final analysis. Adjusted odds ratios (AOR) with 95% confidence intervals (CI) were used to measure the strength of the association. Variables having a p-value of ≤0.05 at a 95% confidence level in the multivariable binary logistic regression analysis were considered statistically significant. The Hosmer and Lemeshow test was used to determine the model’s goodness of fit, with a p-value >0.05 indicating that the logistic regression model is a good fit.
Ethical Consideration
Before data collection, ethical clearance was obtained from University of Gondar Institutional Review Board, School of Medicine, College of Medicine and Health Sciences, with reference number of SOM/1482/2022. Along with ethical clearance, the supportive letter was sent to Dessie’s town administrative office. A supportive letter was given from Dessie’s town administrative office. Before the questions were asked, the participants were asked to give their informed consent. And data were collected using codes or without personally identifiable information. All study participants read and signed the written informed consent form, but when they are illiterate; the data collectors read it to them and take their signature or thumb impression when they agree.
Result
Socio-Demographic Characteristics of the Respondents
A total of 652 women were included in the study with a response rate of 98.3% and the mean age was 47.6 ±5.81 with an age range of 40-65. The majority of participants (65.2%) were married, 51.7 % had a diploma or higher, 41.3 % were civil servants, 25.6 % were aged 40-44, and 46.5% women had 3-4 children (Table 1).
| Group(s) | Frequency (N) | Percentage (%) | |
|---|---|---|---|
| Age | 40-44 | 167 | 25.6 |
| Age | 45-49 | 145 | 22.2 |
| Age | 50-54 | 144 | 22.1 |
| Age | 55-59 | 101 | 15.5 |
| Age | 60-65 | 95 | 14.6 |
| Marital status | Married | 425 | 65.2 |
| Marital status | Unmarried | 78 | 12 |
| Marital status | Divorced | 64 | 9.8 |
| Marital status | Widowed | 85 | 13 |
| Occupational status | Housewife | 230 | 35.3 |
| Occupational status | Civil servant | 269 | 41.3 |
| Occupational status | Merchant | 116 | 17.8 |
| Occupational status | Private employee | 37 | 5.7 |
| Number of children | 0-2 | 134 | 20.6 |
| Number of children | 4-Mar | 303 | 46.5 |
| Number of children | 6-May | 150 | 23 |
| Number of children | =>7 | 65 | 10 |
| Educational status | No formal education | 93 | 14.3 |
| Educational status | Primary school | 132 | 20.2 |
| Educational status | Secondary school | 90 | 13.8 |
| Educational status | Diploma and above | 337 | 51.7 |
| Monthly Income (mean + SD) | N/A | 5949.77±4027.900 |
Table 1: Socio-demographic characteristics of midlife women in Dessie town, Northeast Ethiopia, 2022. (n=652). SD= standard devia
Behavioral Characteristics of the Participants
Of the total respondents, 506 (77.6%) drank less than 5
cups of caffeine intake per day, 18.4 % used khat at least once a week, 12.1 % were obese, 13.3 % drank moderate alcohol, and 79.3% performed moderate physical exercise (Table 2).
| Group | Frequency(N) | Percentage % | |
|---|---|---|---|
| Caffeine intake | Never | 113 | 17.3 |
| Caffeine intake | Less than 5 cups per day | 506 | 77.6 |
| Caffeine intake | More than 5 cups per day | 33 | 5.1 |
| Khat chewing | Never | 396 | 60.7 |
| Khat chewing | Occasional khat use | 136 | 20.9 |
| Khat chewing | Habitual khat use | 120 | 18.4 |
| Physical exercise | Light exercise | 122 | 18.7 |
| Physical exercise | Moderate exercise | 517 | 79.3 |
| Physical exercise | Vigorous exercise | 13 | 2 |
| Alcohol consumption | Never | 504 | 77.3 |
| Alcohol consumption | Past drinker | 61 | 9.4 |
| Alcohol consumption | Current moderate drinker | 87 | 13.3 |
| BMI | Normal weight | 442 | 67.8 |
| BMI | Overweight | 131 | 20.1 |
| BMI | Obesity | 79 | 12.1 |
Table 2: Behavioral factors of midlife women in Dessie town, Northeast Ethiopia, 2022. (n=652).
Menopausal Status, Midlife Symptoms, and Clinical Characteristics 0f the Participants
Among participants 47.4 % were under post-menopausal status, 37.6 % had hot flashes daily, 13.8% and 9.4% were hypertensive and diabetics respectively. Women who were affected by depression, anxiety, and stress were 37.0%, 36.2 %, and 30.5%, respectively (Table 3).
| Group | Frequency (N) | Percentage (%) | |
|---|---|---|---|
| Menopausal status | premenopause | 132 | 20.2 |
| Menopausal status | perimenopause | 211 | 32.4 |
| Menopausal status | post menopause | 309 | 47.4 |
| Hot flashes | Never | 279 | 45.6 |
| Hot flashes | Once a week | 110 | 16.9 |
| Hot flashes | Daily | 245 | 37.6 |
| Presence of known Disease(s) | Hypertensive | 90 | 13.8 |
| Presence of known Disease(s) | Diabetic | 61 | 9.4 |
| Presence of known Disease(s) | Osteoporosis | 29 | 4.4 |
| Presence of known Disease(s) | Others | 30 | 4.6 |
| Depression | Normal (0-7) | 338 | 51.8 |
| Depression | Borderline (8-10) | 73 | 11.2 |
| Depression | Abnormal (11-21) | 241 | 37 |
| Anxiety | Normal (0-7) | 334 | 51.2 |
| Anxiety | Borderline (8-10) | 82 | 12.6 |
| Anxiety | Abnormal (11-21) | 236 | 36.2 |
| Stress | Low stress (0-13) | 418 | 64.1 |
| Stress | Moderate stress (14-26) | 35 | 5.4 |
| Stress | High stress (27-40) | 199 | 30.5 |
Table 3: Menopausal status, menopausal symptoms, and clinical characteristics of midlife women in Dessie town, Northeast Ethiopia
*Others* Arthritis, thyroid abnormality, migraine Table 3: Menopausal status, menopausal symptoms, and clinical characteristics of midlife women in Dessie town, Northeast Ethiopia, 2022. (n=652).
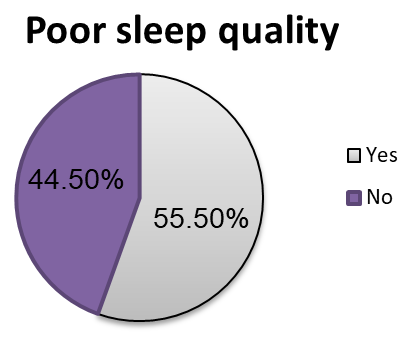
Prevalence of Poor Sleep Quality Among Midlife Women
The prevalence of poor sleep quality among midlife women in Dessie town was 55.5% (95% CI=51.9, 59.0) (Figure 1).
Factors Associated with Poor Sleep Quality
On bivariable binary logistic regression analysis educational status, chewing khat, caffeine intake, alcohol drinking, physical exercise, body mass index, hot flashes, menopausal status, presence of chronic disease(s), depression, anxiety, and stress were associated with poor sleep quality at (p-value of ≤0.25). In multivariable binary logistic regression analysis, educational status, chewing khat, body mass index, hot flashes, diabetics, and stress were significantly associated with poor sleep quality (a p-value of ≤0.05).
Among midlife women who had no formal education, the odds of having poor sleep quality increased by 2.51 times as compared with those having a diploma or higher (AOR=2.51, 95% CI(= 1.30, 4.86)). When midlife women who chewed khat were compared to those who did not chew khat, the odds of having poor sleep quality increased by 2.05 times (AOR=2.05, 95 % CI (=1.13, 3.74)). Obesity increased the chances of having poor sleep quality by 2.41 times compared to normal-weight women (AOR=2.41, 95 % CI (=1.10, 5.32)). Women who had hot flashes every day were 5.58% times more likely to have poor sleep quality than women who had no symptoms of hot flash (AOR=5.58, 95 % CI (=3.31, 9.39)), while those who had hot flashes every week were 2.46 times more likely to have poor sleep quality than women who had no symptom of hot flash (AOR= 2.46, 95 % CI (= 1.25, 4.83)). When compared to non-stressed women, women who reported feeling stressed had a 2.72 times greater chance of having poor sleep quality (AOR=2.72, 95 % CI (=1.32, 5.59)). Diabetic women had a 3.16 times higher chance of developing poor sleep quality compared to non-diabetics (AOR=3.16, 95%CI (=1.43, 6.94) (Table 4).
| Variables | Category | Sleep Quality | COR(95%CI) | AOR(95%CI) | |
|---|---|---|---|---|---|
| Poor sleep N (%) | Good sleep N (%) | ||||
| Educational status | No formal education | 71(10.9) | 22(3.4) | 0.29(0.17,0.50) | 2.51(1.30,4.86)* |
| Primary school | 81(12.4) | 51(7.8) | 0.60(0.40,0.90) | 1.51(0.89,2.56) | |
| Secondary school | 46(7.1) | 44(6.7) | 0.91(0.60,1.44) | 0.86(0.46,1.60) | |
| Diploma and above | 164(25.2) | 173(26.5) | 1 | 1 | |
| Caffeine | Never | 48(7.4) | 65(9.9) | 1 | 1 |
| Less than 5 cups per day | 285(43.7) | 221(33.9) | 0.60(0.38,0.87) | 1.15(0.67,1.98) | |
| intake | More than 5 cups per day | 29(4.4) | 4(0.6) | 0.10(0.03,0.31) | 1.64(0.42,6.32) |
| Khat | Never | 196(30.1) | 200(30.7) | 1 | 1 |
| Occasional khat use | 82(12.6) | 54(8.3) | 0.65(0.43,0.96) | 1.48(0.86,2.52) | |
| chawing | Habitual khat use | 84(12.9) | 36(5.5) | 0.42(0.27,0.65) | 2.05(1.13,3.74)* |
| Alcohol | Never | 288(44.1) | 216(33.1) | 1 | 1 |
| Past drinker | 33(5.1) | 28(4.3) | 1.13(0.66,1.93) | 0.84(0.42,1.70) | |
| consumption | Current light drinker | 41(6.3) | 46(7.1) | 1.50(0.95,2.40) | 0.79(0.43,1.44) |
| Physical | Moderate exercise | 270(41.4) | 247(37.8) | 1 | 1 |
| Vigorous exercise | 9(1.4) | 4(0.6) | 0.47(0.15,1.60) | 1.04(0.23,4.68) | |
| exercise | Light exercise | 83(12.7) | 39(59.8) | 0.51(0.34,0.78) | 1.34(0.76,2.37) |
| BMI | Normal weight | 221(33.8) | 216(33.1) | 1 | 1 |
| Overweight | 62(9.5) | 60(9.2) | 0.88(0.59,1.31) | 1.56(0.94,2.60) | |
| Obesity | 79(12.1) | 14(2.1) | 0.23(0.12,0.41) | 2.41(1.10,5.32)* | |
| Menopausal status | premenopause | 60(9.2) | 72(11.0) | ||
| perimenopause | 111(17.0) | 100(15.3) | 0.75(0.49,1.20) | 1.10(0.61,1.97) | |
| Post menopause | 191(29.3) | 118(18.1) | 0.52(0.34,0.78) | 1.10(0.61,2.00) | |
| Hot flashes | Never | 83(12.7) | 214(32.8) | 1 | 1 |
| Once a week | 75(11.5) | 35(5.4) | 0.18(0.11,0.29) | 2.46(1.25,4.83)* | |
| Daily | 204(31.3) | 41(6.3) | 0.08(0.05,0.12) | 5.58(3.31,9.39)* | |
| Depression | Normal (0-7) | 128(19.6) | 210(32.2) | 1 | 1 |
| Borderline (8-10) | 34(5.2) | 39(5.9) | 0.69(0.42,1.16) | 1.23(0.57,2.66) | |
| Abnormal (11-21) | 200(30.7) | 41(6.3) | 0.12(0.08,0.18) | 1.25(0.67,2.33) | |
| Anxiety | Normal (0-7) | 120(18.4) | 214(32.8) | 1 | 1 |
| Borderline (8-10) | 37(5.7) | 45(6.9) | 0.68(0.41,1.11) | 0.76(0.36,1.62) | |
| Abnormal (11-21) | 205(31.4) | 31(4.8) | 0.08(0.05,0.13) | 1.71(0.81,3.57 | |
| Stress | Low stress (0-13) | 170(26.1) | 248(38.0) | 1 | 1 |
| Moderate stress (14-26) | 16(2.5) | 19(2.9) | 0.81(0.40,1.62) | 1.22(0.41,3.60) | |
| High stress (27-40) | 176(27.0) | 23(3.5) | 0.09(0.05,0.14) | 2.72(1.32,5.59)* | |
| Presence of Disease | No known disease present | 198(30.4) | 236(36.2) | 1 | 1 |
| Hypertension | 75(11.5) | 15(2.3) | 0.17(0.09,0.31) | 1.90(0.92,3.93) | |
| Diabetics | 46(7.1) | 15(2.3) | 0.28(0.15,0.52) | 3.16(1.43,6.94)* | |
| Osteoporosis | 18(2.8) | 11(1.6) | 0.53(0.24,1.15) | 0.76(0.26,2.16) | |
| Others | 17(2.6) | 13(1.9) | 0.66(0.31,1.40) | 1.30(0.50,3.38) |
Table 4: Bivariable and multivariable binary logistic regression analysis results for factors associated with poor sleep quality
Discussion
This study aimed to determine the prevalence of poor sleep quality and its associated factors among midlife women in Dessie town. The prevalence of poor sleep quality in this study was 55.5%, (95% CI= 51.9, 59.0). The result of this study was consistent with the study carried out in Taiyuan, Shanxi 55% [32], 57.8% Turkish women [33], 57.2% Colombia [34], and 58.2% China [35]. The results of this study were lower than those of previous studies conducted in West Tehran: 62.5%, [36], 59.6% Cameroonian women [37], 69.5% Egyptian midlife women [13], and 67.8% in Brazil [11]. This discrepancy might be explained by sample size and a difference in socio-demographic and cultural status.
However, the finding of this study was higher than the results of a study conducted in the USA 31% [38], 42% in California [39], 37.5% in Spain [40], 20% in Iran [10], 23% in Australia [41], 26% in Korea [1], 38.6% in Chines women(16), 49.2% in southern Brazil [42]. Differences in lifestyle, socioeconomic and demographic characteristics and cutoff points for poor sleep quality could all be contributing factors to these discrepancies [43]. This study found that women who had no formal education were more likely to have poor sleep quality than those with a diploma or higher educational status. This finding was consistent with previous research findings done in West Tehran and South Korea [36, 44]. Individuals with lower educational levels might have less access to optimal medical care which may lead to poor overall health status. This is expected to increase the likelihood of poor sleep quality [36, 43].
The findings from the respondents revealed that chewing khat increased the likelihood of having poor sleep quality when compared to non-chewers. This study’s findings were supported by various works of literature [45, 46, 47, 48]. Cathinone in khat might stimulate dopaminergic pathways involved in sleep regulation. These effects might be mediated by decreased dopamine uptake by nerve terminals, increased dopamine release, and monoaminoxidase inhibition, and all of these processes might be contributed to poor sleep quality as a result of persistent stimulation of postsynaptic neurons following a high level of dopamine in the synaptic cleft [47, 49, 50, 51].
According to the findings of this study, women who were obese were more likely to have poor sleep quality than people who were normal weight. This discovery was supported by previous research [44, 52]. The possible justification might be obese women may have thickened soft tissue in the airway, which can lead to obstructive sleep apnea, a sleep disorder that causes the airway to be partially or fully blocked [53] and they also have an increased risk of eye problems, which led to poor sleep quality [54]. Weight increases pressure on the abdomen and the extra fat around the belly squeezes the stomach, so more fluid travels upward into the esophagus. This makes it more likely to experience stomach acid leakage and GERD. It can cause heartburn, including at night, which can disrupt sleep [55]. Obesity also causes osteoarthritis is a joint disorder because of the strain additional weight places on the joints and affects sleep with pain [56].
This study found that women who experienced hot flashes were more likely to have poor sleep quality than those who did not. This finding was consistent with previous research [8, 16, 17, 54, 57, 58, 59]. The possible explanation might be hot flushes are thought to be caused by a disruption in the hypothalamic temperature-regulating system or a decrease in opioid tone in the hypothalamus and pituitary, which might lead to a loss of functioning in the ovaries’ female hormones. Hot flushes are brief bouts of generalized heat, most notably in the chest, face, head, and neck, accompanied by profuse sweating. This happened most often at night, resulting in poor sleep quality [16, 59].
Findings from this study revealed that Diabetes mellitus is one of those risk factors for poor sleep quality, and previous studies supported this finding [16, 44, 60, 61]. Possible explanations include diabetes neuropathy, restless legs syndrome, and nocturnal polyuria have been proposed to contribute to DM-related sleep problems [48, 62]. Diabetes caused nocturia, which is defined as waking up at night to urinate and causes poor sleep quality [63]. Nocturia in diabetics can occur in conjunction with obstructive sleep apnea. The negative intra-thoracic pressure and stretching of the myocardium in patients with obstructive sleep apnea are thought to release atrial natriuretic peptide (ANP). As a result, vasodilation occurs and aldosterone is inhibited, resulting in sodium and water excretion [64]. Diabetics who experience nocturnal hypoglycemia may have poor sleep quality. Longer intervals between self-monitoring glycaemia are generally seen during the night, and this period is associated with the highest insulin sensitivity. When blood glucose levels fall, hormones that regulate glucose levels are released. These compounds stimulate the brain and serve as a natural signal that it is time to eat. During the night, the brain may interpret this as a signal to wake up and eat. This phenomenon can disrupt sleep and lower overall sleep quality [65]. For people with diabetes, fear of hypoglycemia is a significant psychological burden that may impair sleep [66, 67]. Additionally, different insulin regimens can put a diabetic patient at risk for nocturnal hypoglycemia [68]. Restless leg syndrome is a common condition that affects the nervous system, as seen in diabetic patients [69]. Poor sleep quality in restless leg syndrome is a result of symptoms such as the urge to move the legs and an unpleasant sensation that is relieved by movement, symptoms that are made worse by rest (i.e., sleeping), and symptoms that worsen in the evening or at night [70].
Finally, perceived stress was significantly associated with poor sleep quality among midlife women. This finding was supported by the findings of other studies [16, 44, 71, 72]. The possible reason might be stress may cause the HPA axis and autonomic nervous system to release hormones such as adrenaline and cortisol to maintain a heightened state of arousal for extended periods. Being constantly on high alert can cause poor sleep quality [73, 74].
Limitation of the Study
Due to the cross-sectional nature of the study design, it is difficult to show a cause-and-effect relationship. Recall bias might be existed due to the subjective nature of the questionnaire.
Conclusion
More than half of the participant had poor sleep quality. Lack of formal education, khat chewing, obesity, diabetes, hot flashes, and stress were significantly associated with poor sleep quality. It is recommended to avoid modifiable risk factors like khat chewing.
References
-
Hwang JH, Lee K, Choi E, Cho HN, Park B, et al. (2021) Sleep Quality and Associated Factors in Premenopausal, Perimenopausal, and Postmenopausal Women in Korea: Findings from the K Stori 2016. Nature and Science of Sleep 13: 1137-1145.
-
Raff H, Levitzky MG (2011) Medical Physiology: A Systems Approach. The McGraw Hill Professional Publishing, pp: 1-786.
-
Peacock K, Ketvertis KM, Doerr C (2022) Menopause Nursing. StatPearls Publishing.
-
Baker FC, Lampio L, Saaresranta T, Kantola PP (2018) Sleep and Sleep Disorders in the Menopausal Transition. Sleep medicine clinics 13(3): 443-456.
-
Boron WF, Boulpaep EL (2017) Medical physiology. 3rd (Edn.), Elsevier, pp: 1-1312.
-
Pavlova MK, Latreille V (2019) Sleep Disorders. Am J Med 132(3): 292-299.
-
Simonelli G, Marshall NS, Grillakis A, Miller CB, Hoyos CM, et al. (2018) Sleep health epidemiology in low and middle-income countries a systematic review and meta analysis of the prevalence of poor sleep quality and sleep duration. Sleep Health 4(3): 239-250.
-
Pengo MF, Won CH, Bourjeily G (2018) Sleep in women across the life span. Chest 154(1): 196-206.
-
Kling JM, Manson JE, Naughton MJ, Temkit M, Sullivan SD, et al. (2017) Association of sleep disturbance and sexual function in postmenopausal women. Menopause 24(6): 604-612.
-
Yazdi Z, Sadeghniiat KH, Ziaee A, Elmizadeh K, Ziaeeha M (2013) Influence of sleep disturbances on quality of life of Iranian menopausal women. Psychiatry J, pp: 907068.
-
Santos MAD, Vilerá AN, Wysocki AD, Pereira FH, Oliveira DMD, et al. (2021) Sleep quality and its association with menopausal and climacteric symptoms. Revista Brasileira de Enfermagem 74Suppl 2(Suppl 2): 20201150.
-
Ngadena YSM, Mbengono LJO, Djamen DPC, Djomeni PDD (2021) Menopausal Management Practices in Sub- Saharan Africa: A Cross Sectional Study of Cameroonian Women. International Journal on Integrated Education 4(6): 358-366.
-
Lotfi M, Eldahshan N (2012) Sleep-Related Disorders and Quality of Life among Post-menopausal Egyptian Women in Ismailia. Suez Canal University Medical Journal 15(2): 47-55.
-
Manzar MD, Bekele BB, Noohu MM, Salahuddin M, Albougami A, et al. (2020) Prevalence of poor sleep quality in the Ethiopian population A systematic review and meta-analysis. Sleep and Breathing 24(2): 709-716.
-
(2016) Cleveland Clinic’s Sleep Disorders Center. Ohio The Sleep Disorders Center.
-
Xu Q, Zhao Y, Chen H, Jing J (2016) Exploring sleep quality and related factors in Chinese midlife women. Health care for women International 37(6): 620-635.
-
Smith RL, Flaws JA, Mahoney MM (2018) Factors associated with poor sleep during menopause: results from the Midlife Women’s Health Study. Sleep Med 45: 98-105.
-
Taavoni S, Ekbatani NN, Haghani H (2015) Postmenopausal women’s quality of sleep and its related factors. Journal of Mid-life Health 6(1): 21-25.
-
Medic G, Wille M, Hemels ME (2017) Short-and long- term health consequences of sleep disruption. Nature and science of sleep 9: 151-161.
-
Fabbrini M, Aricò I, Tramonti F, Condurso R, Carnicelli L, et al. (2015) Sleep disorders in menopause: results from an Italian Multicentric Study. Multicentere study 153(2- 3): 204-213.
-
Tadayon M, Ilkhani M, Abedi P, Zadeh MH (2019) The relationship between sleep quality and lifestyle in postmenopausal Iranian women: a cross-sectional study. Women & health 59(8): 883-891.
-
Population EOOT Commission HC (2008) Summary and statistical report of the 2007 population and housing census population size by age and sex. Federal Democratic Republic of Ethiopia, Population Census Commission.
-
Harlow SD, Gass M, Hall JE, Lobo R, Maki P, et al. (2012) Executive summary of the Stages of Reproductive Aging Workshop+ 10 addressing the unfinished agenda of staging reproductive aging. The Journal of Clinical Endocrinology Metabolism 97(4): 1159-1168.
-
Thomas AJ, Mitchell ES, Woods NF (2018) The challenges of midlife women themes from the Seattle midlife women’s health study. Women’s Midlife Health 4(1): 1-10.
-
Tessema ZT, Zeleke TA (2020) Spatial distribution and factors associated with Khat chewing among adult males 15-59 years in Ethiopia using a secondary analysis of Ethiopian Demographic and Health Survey 2016 spatial and multilevel analysis. Psychiatry J 2020: 8369693.
-
Gebrehanna E, Berhane Y, Worku A (2014) Khat chewing among Ethiopian University Students-a growing concern. BMC public health 14(1): 1-7.
-
(2017) The WHO step wise approach to non- communicable disease risk factor surveillance.
-
Zak RS, Zitser J, Jones HJ, Gilliss CL, Lee KA (2022) Sleep Self-Report and Actigraphy Measures in Healthy Midlife Women: Validity of the Pittsburgh Sleep Quality Index. Journal of Women’s Health 31(7): 965-973.
-
Wondie Y, Mehnert A, Hinz A (2020) The hospital anxiety and depression scale (HADS) applied to Ethiopian cancer patients. Plos one 15(12): e0243357.
-
Manzar MD, Salahuddin M, Peter S, Alghadir A, Anwer S, et al. (2019) Psychometric properties of the perceived stress scale in Ethiopian university students. BMC public health 19(1): 1-8.
-
Teshome A, Shegaze M, Glagn M, Getie A, Tekabe B, et al. (2021) Perceived stress and associated factors among health care professionals working in the context of COVID-19 pandemic in public health institutions of southern Ethiopia 2020. Plos one 16(6): e0252809.
-
Zhang JP, Wang YQ, Yan MQ, Li ZA, Du XP, et al. (2016) Menopausal symptoms and sleep quality during menopausal transition and postmenopause. Chinese Med J 129(7): 771-777.
-
Ayrim A, KESKİN EA, Özol D (2014) Pittsburgh Sleep Quality Index scores and their relationship with body measurements in late menopause patients. Turkish Journal of Medical Sciences 44(5): 799-803.
-
Monterrosa-Castro A, Marrugo-Flórez M, Romero- Pérez I, Fernández-Alonso AM, Chedraui P, et al. (2013) Assessment of sleep quality and correlates in a large cohort of Colombian women around menopause. Menopause 20(4): 464-469.
-
Zhou Q, Wang B, Hua Q, Jin Q, Xie J, et al. (2021) Investigation of the relationship between hot flashes, sweating and sleep quality in perimenopausal and postmenopausal women: the mediating effect of anxiety and depression. BMC women’s health 21: 1-293.
-
Taavoni S, Ekbatani NN, Haghani H (2014) Quality of sleep and its related factors in postmenopausal women in West Tehran. Women’s Health Bulletin 1(3): 1-5.
-
Ngadena YSM, Mbengono LJO, Djamen DPC, Djomeni PDD (2021) Menopausal Management Practices in Sub Saharan Africa A Cross Sectional Study of Cameroonian Women. International journal of integrated education 4(6): 358.
-
Kling JM, Manson JE, Naughton MJ, Temkit MH, Sullivan SD, et al. (2017) Association of sleep disturbance and sexual function in postmenopausal women. Menopause 24(6): 604-612.
-
Jones HJ, Zak R, Lee KA (2018) Sleep disturbances in midlife women at the cusp of the menopausal transition. Journal of Clinical Sleep Medicine 14(7): 1127-1133.
-
Ornat L, Martínez-Dearth R, Chedraui P, Pérez-López FR (2014) Assessment of subjective sleep disturbance and related factors during female mid-life with the Jenkins Sleep Scale. Maturitas 77(4): 344-350.
-
Seib C, Anderson D, Lee K (2014) Prevalence and correlates of sleep disturbance in postmenopausal women: the Australian Healthy Aging of Women (HOW) Study. Journal of Women’s health 23(2): 151-158.
-
Neutzling AL, Leite HM, Paniz VMV, Bairros FSD, Costa JSDD, et al. (2020) Association between common mental disorders, sleep quality, and menopausal symptoms: a population-based study in Southern Brazil. Menopause 27(4): 463-472.
-
Wang P, Song L, Wang K, Han X, Cong L, et al. (2020) Prevalence and associated factors of poor sleep quality among Chinese older adults living in a rural area: a population-based study. Aging Clin Exp Res 32(1): 125- 131.
-
Kim M-J, Yim G, Park H-Y (2018) Vasomotor and physical menopausal symptoms are associated with sleep quality. Plos one 13(2): e0192934.
-
Manzar MD, Salahuddin M, Alamri M, Maru TT, Pandi- Perumal SR, et al. (2018) Poor sleep in concurrent users of alcohol, khat, and tobacco smoking in community- dwelling Ethiopian adults. Ann Thorac Med 13(4): 220.
-
Berhanu H, Mossie A, Tadesse S, Geleta D (2018) Prevalence and associated factors of sleep quality among adults in Jimma Town, Southwest Ethiopia: a community-based cross-sectional study. Sleep disord 2018: 8342328.
-
Nakajima M, Dokam A, Kasim AN, Alsoofi M, Khalil NS, et al. (2014) Peer Reviewed: Habitual Khat and Concurrent Khat and Tobacco Use Are Associated With Subjective Sleep Quality. Prev Chronic Dis 11: E86.
-
Jemere T, Mossie A, Berhanu H, Yeshaw Y (2019) Poor sleep quality and its predictors among type 2 diabetes mellitus patients attending Jimma University Medical Center, Jimma, Ethiopia. BMC Res Notes 12(1): 488.
-
Abebe M, Kindie S, Adane K (2015) Adverse health effects of khat: a review. Fam Med Med Sci Res 4(1): 2-5.
-
Moss HB, Chen CM, Yi HY (2014) Early adolescent patterns of alcohol, cigarettes, and marijuana polysubstance use and young adult substance use outcomes in a nationally representative sample. Drug and alcohol dependence 136: 51-62.
-
al’Absi M, Nakajima M, Dokam A, Sameai A, Alsoofi M, et al. (2014) Concurrent tobacco and khat use is associated with blunted cardiovascular stress response and enhanced negative mood: a cross‐sectional investigation. Human Psychopharmacol 29(4): 307-315.
-
Nicolau ZFM, Tufik S, Hachul H (2018) Influence of lifestyle on postmenopausal women’s sleep. BioMedicine 8(3): 13.
-
Polesel DN, Nozoe KT, Bittencourt L, Tufik S, Andersen ML, et al. (2021) Waist-to-height ratio and waist circumference as the main measures to evaluate obstructive sleep apnea in the woman’s reproductive life stages. Women Health 61(3): 277-288.
-
Shaver JL, Woods NF (2015) Sleep and menopause: a narrative review. Menopause 22(8): 899-915.
-
Fass R (2010) Effect of gastroesophageal reflux disease on sleep. Journal of gastroenterology and hepatology 25: S41-S44.
-
Parmelee PA, Tighe CA, Dautovich ND (2015) Sleep disturbance in osteoarthritis: linkages with pain, disability, and depressive symptoms. Arthritis care Res 67(3): 358-365.
-
Lampio L, Polo-Kantola P, Polo O, Kauko T, Aittokallio J, et al. (2014) Sleep in midlife women: effects of menopause, vasomotor symptoms, and depressive symptoms. Menopause 21(11): 1217-1224.
-
Freeman EW, Sammel MD, Gross SA, Pien GW (2015) Poor sleep in relation to natural menopause: a population- based 14-year follow-up of mid-life women. Menopause (New York, NY) 22(7): 719.
-
Valiensi SM, Belardo MA, Pilnik S, Izbizky G, Starvaggi AP, et al. (2019) Sleep quality and related factors in postmenopausal women. Maturitas 123: 73-77.
-
Darraj A, Mahfouz MS, Alsabaani A, Sani M, Alameer A (2018) Assessment of sleep quality and its predictors among patients with diabetes in Jazan, Saudi Arabia. Diabetes Metab Syndr Obes 11: 523.
-
Edmealem A, Degu SG, Haile D, Gedfew M, Bewket B, et al. (2020) Sleep quality and associated factors among diabetes, hypertension, and heart failure patients at Debre Markos referral hospital, Northwest Ethiopia. Sleep Disorders 2020: 6125845.
-
Kodakandla K, Maddela G, Shahid M (2016) Factors influencing sleep quality and its impact on glycemic control in patients with type II diabetes mellitus-a hospital based cross sectional study. Diabetes 3(5): 138- 145.
-
Middelkoop HA, Smilde-van DAD, Neven AK, Kamphuisen HA, Springer CP (1996) Subjective sleep characteristics of 1,485 males and females aged 50–93: effects of sex and age, and factors related to self-evaluated quality of sleep. J Gerontol A Biol Sci Med Sci 51(3): M108-M115.
-
Weiss JP, Blaivas JG (2002) Nocturnal polyuria versus overactive bladder in nocturia. Urology 60(5): 28-32.
-
Bode BW, Schwartz S, Stubbs HA, Block JE (2005) Glycemic characteristics in continuously monitored patients with type 1 and type 2 diabetes: normative values. Diabetes care 28(10): 2361-2366.
-
Gjerløw E, Bjørgaas MR, Nielsen EW, Olsen SE, Åsvold BO (2014) Fear of hypoglycemia in women and men with type 1 diabetes. Nurs resc 63(2): 143-149.
-
Martyn-Nemeth P, Farabi SS, Mihailescu D, Nemeth J, Quinn L (2016) Fear of hypoglycemia in adults with type 1 diabetes: impact of therapeutic advances and strategies for prevention-a review. J Diabetes Complications 30(1): 167-177.
-
Yki-Järvinen H, Dressler A, Ziemen M, Group HsS (2000) Less nocturnal hypoglycemia and better post-dinner glucose control with bedtime insulin glargine compared with bedtime NPH insulin during insulin combination therapy in type 2 diabetes. HOE 901/3002 Study Group. Diabetes care 23(8): 1130-1136.
-
Greco D, Gambina F, Pisciotta M, Abrignani M, Maggio F (2009) Clinical characteristics and associated comorbidities in diabetic patients with restless legs syndrome. Exp Clin Endocrinol diabetes 117(09): 496- 499.
-
Allen RP, Picchietti D, Hening WA, Trenkwalder C, Walters AS, et al. (2003) Restless legs syndrome: diagnostic criteria, special considerations, and epidemiology: a report from the restless legs syndrome diagnosis and epidemiology workshop at the National Institutes of Health. Sleep Med 4(2): 101-119.
-
Yuksel D, Zambotti MD, Sugarbaker D, Schulte T, Colrain IM, et al. (2021) Physiological responses to acute psychosocial stress in women with menopausal insomnia. International Journal of Psychophysiology 164: 87-94.
-
Huang Y, Mai W, Hu Y, Wu Y, Song Y, et al. (2011) Poor sleep quality, stress status, and sympathetic nervous system activation in nondipping hypertension. Blood pressure monitoring 16(3): 117-123.
-
Han KS, Kim L, Shim I (2012) Stress and sleep disorder. Exp Neurobiol 21(4): 141.
-
Martire VL, Caruso D, Palagini L, Zoccoli G, Bastianini S (2020) Stress & sleep: A relationship lasting a lifetime. Neurosci Biobehav Rev 117: 65-77.
- Pattern of Breast Lesions in Ovu Inland, Delta State, South Southern Nigeria
- Morphometric Analysis of the Human Femur: Exploring Platymetric and Robusticity Indices Among the Nigerian Population
- Anatomical Variation of Arteria Lusoria: Clinical Implications for Dysphagia Lusoria and Surgical Risk
- Morphometric Study of the Vertebral Body and Pedicle of Typical Cervical Vertebrae Using Radiological Image
- Epigenetic Mechanisms Driving Human Evolutionary Changes
- Neuroprotective Effects of Ginkgo Biloba Extract on Bilateral Common Carotid Artery Ischaemic Stroke Induced in Wistar Rat