Morphometric Analysis of the Human Femur: Exploring Platymetric and Robusticity Indices Among the Nigerian Population
The dimensions of the femur are important in forensic anthropology for human identification and in orthopedic surgery for diagnosis and treatment planning. Femoral dimensions vary among different populations. Aim: This study aimed to determine the morphometry, platymeric index, and robusticity index of the human femur in Nigeria. Materials and Methods: A total of 142 (68 right and 74 left) normal, dry, adult human femora were purposively sampled from the anatomy bone collections of various Nigerian universities. Measurements were taken using an osteometric board, tape line, and digital sliding vernier calliper. The parameters measured in millimetres (mm) included Maximum Length (ML), Proximal Breadth (PB), Proximal Transverse Diameter (PTD), Proximal Sagittal Diameter (PSD), Middle Transverse Diameter (MTD), Middle Sagittal Diameter (MSD), Middle Circumference (MC), and Distal Breadth (DB). The Platymeric Index (PI) and Robusticity Index (RI) were derived from these measurements. Data were analysed using SPSS version 23.0 and expressed as mean ± standard deviation. An independent t-test was used to compare mean values, and p < 0.05 was considered statistically significant. Results: The mean ML was 478.19 ± 30.68 mm for the right femur and 472.77 ± 28.56 mm for the left. PB was 94.28 ± 6.79 mm (right) and 92.18 ± 6.64 mm (left). PTD was 29.43 ± 2.58 mm (right) and 29.03 ± 3.51 mm (left). PSD was 27.04 ± 2.37 mm (right) and 26.13 ± 2.50 mm (left). MTD was 26.79 ± 2.52 mm (right) and 26.46 ± 2.46 mm (left). MSD was 29.56 ± 2.89 mm (right) and 29.02 ± 2.86 mm (left). MC was 89.24 ± 6.86 mm (right) and 87.65 ± 6.70 mm (left). DB was 80.49 ± 5.78 mm (right) and 78.90 ± 5.44 mm (left). PI was 92.17 ± 7.53 (right) and 90.67 ± 9.44 (left), while RI was 11.79 ± 0.69 (right) and 11.74 ± 0.74 (left). Conclusion: The femur is the longest bone in the human body, located in the thigh. When its maximum length increases other body measurements such as height, limb length, or other bone dimensions also tend to increase.
Introduction
The bone of the thigh, the femur, is longer, larger, and stronger than any other bone in the human skeleton, typically about one-fourth of the body height [1]. Due to its strength and density, the femur is often recovered in forensic and archaeological settings and, therefore, is highly useful for identification purposes [2]. The dimensions of the femur are important anatomically in forensic anthropology for human identification, including sex and ethnicity, and have clinical significance in orthopedic surgery for the diagnosis and treatment planning of femoral fractures [3].
There is variation in the morphology and dimensions of the femur due to population differences. Additionally, geographic, environmental, and nutritional factors also affect the morphology and morphometry of the femur [4].
The morphology of the proximal femur is vital in the design and improvement of implants for total hip replacement. If the morphology of the femur from another population is considered for the design and production of implants, and these implants are imported into Nigeria, it may result in surgical failure [5, 6, 7, 8].
Several studies have examined the anthropometry and morphometry of the femur in different populations, such as in the Central India population, in West Bengal, in South India, in the Gujarat region and in Nigeria [2, 4, 9, 10, 11]. Limited data on femoral morphometry pose a limitation to anthropologists for the identification of the deceased. This study focuses on the morphometry, platymeric, and robusticity indices of the femur in Nigeria.
Materials and Methods
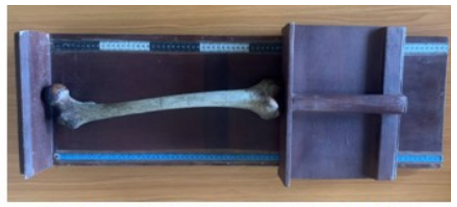
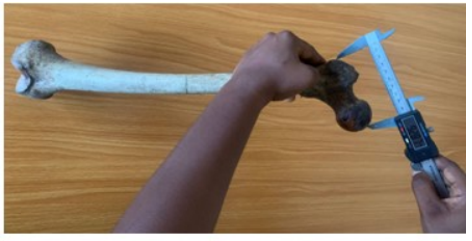
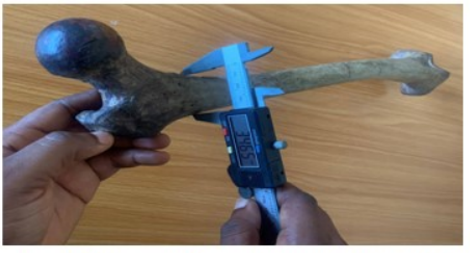
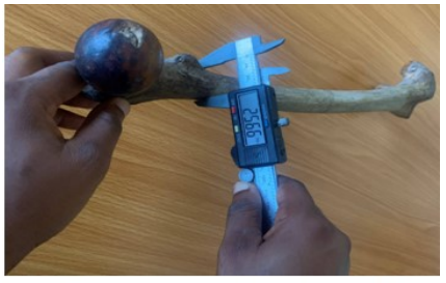
All available adult femur bones in the bone collection (142 in total: 74 left and 68 right) at the Anatomy Department of various universities in Nigeria were utilized. The age and sex of the femur bones were not known. The bones were normal, devoid of any pathological conditions, and were selected purposively. Approval for this study was obtained from the Research and Ethics Committee of the Faculty of Basic Medical Sciences, Delta State University, Abraka, Nigeria, with reference number REC/FBMS/DELSU/22/143. The study involved measuring various femoral parameters using an osteometric board, tape line, and digital sliding vernier calliper.
Key measurements included the maximum length (ML), proximal breadth (PB), diameters of the femoral shaft at various points- Proximal Transverse Diameter (PTD), Proximal Sagittal Diameter (PSD), Middle Circumference (MC) and the distal breadth (DB). These measurements were repeated twice, with the mean taken for analysis. Two indices, the Platymeric Index (PI) and Robusticity Index (RI), were calculated based on these measurements using specific formulas adopted from literature [2]. Platymeric Index (PI):(PSD÷PTD) X 100 while Robusticity Index (RI): (MTD + MSD) ÷ML X 100. Data were analysed using IBM SPSS version 23.0 and expressed as mean ± standard deviation. A Student’s t-test was used to compare mean values, and a p-value less than 0.05 was considered statistically significant. Pearson’s correlation was used to measure the strength of the linear relationship between variables.
Results
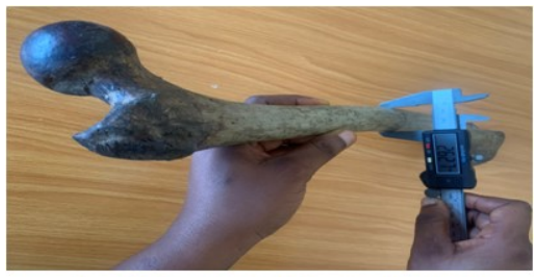
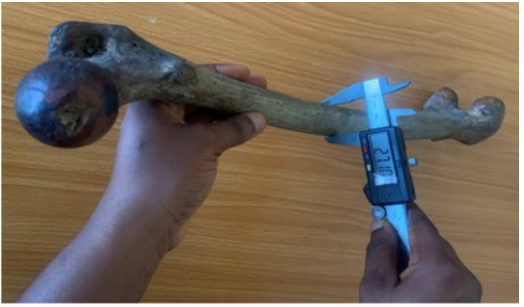
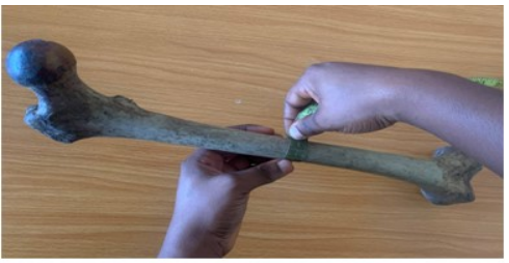
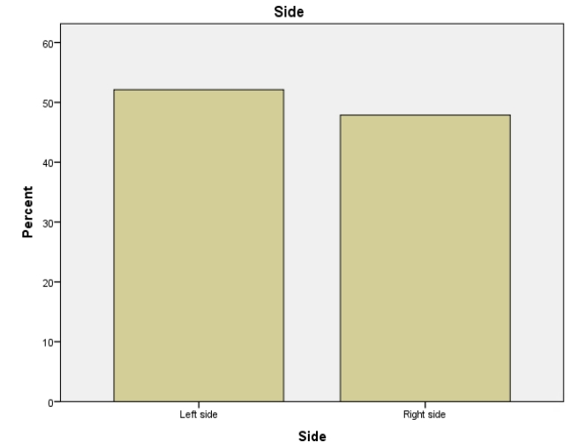
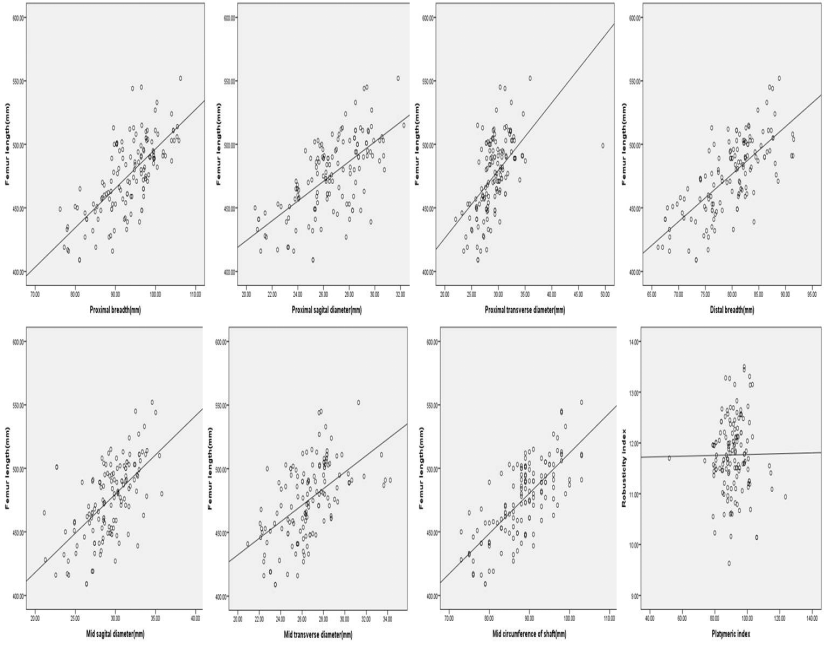
The result present how the parameters of the femur bones were measured (Figures 1-7) while Figure 8 showed the percentage distribution by side. In the present study, left consisted of 52.1% (74) while right consisted of 47.9% (68) of the total samples used. Table 1 showed the findings of the independent samples t-test between the right and left femur sides of all the parameters measured and calculated. The value for the right femur is slightly higher than that of the left femur in all the parameters except for the middle circumference of shaft that has higher value on the left side than the right side.
In all the parameters except for the proximal sagittal diameter, the mean differences between the right and left sides were not statistically significant (ML=0.28; PB=0.07; PTD= 0.44; PSD=0.03; MTD=0.43; MSD=0.27; MC=0.17; DB=0.10; PI=0.30; RI=0.71). There is a positive correlation between maximum length of femur and proximal breath, proximal sagittal diameter, proximal transverse diameter, middle sagittal diameter, middle transverse diameter, middle shaft circumference and distal breath of femur (r=0.71, 0.65, 0.56, 0.60, 0.55, 0.73 and 0.71 respectively). There is also a positive correlation between platymeric index and robusticity index (r=0.01) as shown in the scattered graphs (Figure 9).
Maximum Length (mm) Right 68 409.00-544.00 478.19(30.68) 1.09 0.28 Left 7 4 417.00-552.00 472.77(28.56) Proximal Breadth (mm) Right 68 78.11-105.84 94.28(6.79) 1.86 0.07 Left 74 76.22-106.23 92.18(6.65) Proximal Transverse Diameter (mm) Right 68 23.19-35.05 29.43(2.58) 0.78 0.44 Left 74 22.02-49.54 29.03(3.51) Proximal Sagittal Diameter (mm) Right 68 21.11-32.26 27.04(2.37) 2.24 0.03* Left 74 20.67-31.81 26.13(2.50) Middle Transverse Diameter (mm) Right 68 22.08-33.78 26.79(2.52) 0.8 0.43 Left 74 20.92-34.25 26.46(2.46) Middle Sagittal Diameter (mm) Right 68 21.14-35.78 29.56(2.89) 1.11 0.27 Left 74 21.27-34.58 29.03(2.86) Middle circumference (mm) Right 68 75.00-103.00 89.24(6.86) 1.39 0.17 Left 74 73.00-103.00 87.65(6.70) Distal Breadth (mm) Right 68 67.00-91.50 80.49(5.78) 1.69 0.1 Left 74 66.16-91.32 78.90(5.44) Parameter Side N Range Mean (SD) t p-value Platymeric Index Right 68 78.79-123.51 92.17(7.53) 1.05 0.3 Left 74 51.92-115.17 90.67(9.44)
| Robusticity Index | Right | 68 | 9.63-13.50 | 11.79(0.69) | 0.38 | 0.71 |
|---|---|---|---|---|---|---|
| Left | 74 | 10.14-13.44 | 11.74(0.74) |
Table 1: Independent samples t-test of femur parameter measured between right and left sides.
N= sample size, t= t-test, SD= standard deviation, *= significant Table 1: Independent samples t-test of femur parameter measured between right and left sides.
Discussion
The mean maximum length of the femur (478.19 ± 30.68 mm for the right femur and 472.77 ± 28.56 mm for the left femur) is higher than that reported in India, in Nepal, in Turkey, and in the West Bengal population [4, 9, 10, 11, 12, 13, 14, 15, 16, 17]. Factors related to genetics, environment, climate, diet, geography, and mode of life are likely responsible for the higher values in the present study. A non-statistically significant higher value of femur length on the right side compared to the left was also reported by Bienonwu, et al. [2] and Yadav, et al. [16]. Results showed that the proximal breadth is higher in the right femur than in the left femur; this finding is like that of Brown [18]. While the difference between both sides is not statistically significant, the study by Brown [18] did not state whether this was the case, and the value of the proximal breadth of the femur in his study [18] was higher than that of the present study. The variation in the value of proximal breadth is due to factors that affect bone morphology, such as genetics, diet, environment, and physical activity.
The middle shaft circumference for both right and left femur bones is higher than that reported by previous studies [16, 19, 20, 21], which is likely due to racial differences in bone morphology. Furthermore, the difference between the right and left femur is statistically insignificant, with the right being higher than the left, as observed by Yadav, et al. [16] and Singh, et al. [20] in their studies. This study also revealed higher values of the proximal transverse diameter, proximal sagittal diameter, middle transverse diameter, and middle sagittal diameter in the right femur than in the left. The difference between both sides was not statistically significant, except for the proximal sagittal diameter. The reason for the difference in mean values for both sides could be unknown factors innate to the population.
The distal breadth is higher in the right femur than in the left femur in this study, which is consistent with the study conducted by Brown [18]. This study shows no statistically significant difference in the distal breadth between both sides, but Brown [18] did not state this. The variant values of distal breadth for both the left and right femur bones are attributed to various factors that affect bone morphology in a population. The calculated platymeric index showed no statistically significant higher difference in the right femur compared to the left femur. This agrees with the findings of Datta, et al. [4] and Ohanad Khan and Saheb [10] but disagrees with that of Bokariya, et al. [9], who reported a statistically significant higher value of the platymeric index in the left femur compared to the right.
The robusticity index revealed no statistically significant higher difference in the right femur compared to the left femur. This is like the work of Bienonwu, et al. [2] and Datta, et al. [4] but differs from the findings of some studies that reported a statistically significant higher value of the robusticity index in the left femur compared to the right [9, 10]. There is a positive correlation between the maximum length of the femur and the proximal breadth, proximal sagittal diameter, proximal transverse diameter, middle sagittal diameter, middle transverse diameter, middle shaft circumference, and distal breadth of the femur. There is also a positive correlation between the platymeric index and the robusticity index. This indicates that as the femur length increases, other anthropometric measurements also tend to increase.” The present study involved dry adult femur bones of unknown sex and ethnicity. This constitutes a limitation of the study. Studies involving data with identified sex and ethnicity are therefore recommended.
Conclusion
The femur is the longest bone in the human body, located in the thigh. When its maximum length increases (for example, in taller individuals), other body measurements such as height, limb length, or other bone dimensions also tend to increase.
References
-
Standring S (2016) Pelvic girdle, gluteal region and thigh in Gray’s anatomy. 41st (Edn.), Elsevier Limited, pp: 1348.
-
Omotoso DR (2020) Platymeric and robusticity index of femur in Nigerian population. Journal of Anatomical Science 11(1): 97-101.
-
Chowdhury MS, Naushaba H, Chowdhury AM, Khan LF, Ara JG (2012) Morphometric study of fully ossified head and neck diameter of the human left femur. Journal of Dhaka National Medical College and Hospital 18(2): 9-13.
-
Datta M, Srimani P, Saha A (2016) Morphometric analysis along with estimation of total length of femur among population of West Bengal. International Journal of Anatomy and Research 4(4.1): 2945-2849.
-
Mahaisavariya B, Sitthiseripratip K, Tongdee T, Bohez EL, Vander Sloten J, et al. (2002) Morphological study of the proximal femur: a new method of geometrical assessment using 3-dimensional reverse engineering. Medical Engineering and Physics 24(9): 617-622.
-
Jiang LS, Shen L, Dai LY (2007) Intramedullary fixation of subtrochanteric fractures with long proximal femoral nail or long gamma nail: technical notes and preliminary results. Annals-Academy of Medicine Singapore 36(10): 821.
-
Kaya M, Nagoya S, Sasaki M, Kukita Y, Yamashita T (2008) Primary total hip arthroplasty with Asian-type AML total hip prosthesis: follow-up for more than 10 years. Journal of Orthopaedic Science 13: 324-327.
-
Mishra AK, Chalise P, Singh RP, Shah RK (2009) The proximal femur-a second look at rational of implant design. Nepal Medical College Journal 11(4): 278-280.
-
Bokariya P, Kothari R, Waghmare JE, Tarnekar AM, Ingole IV (2009) Anthropometric study of femur in central Indian population. J MGIMS 14(2): 47-49.
-
Ohamad Khan SM, Saheb SH (2014) Anthropometric study of femur in South India. International Journal of Anatomy and Research 2(4): 630-632.
-
Patel MP, Pandya AM, Singel TC (2019) Study of Robusticity Index of Femur in Gujarat Region. Journal of Medical Science and Clinical Research 7(11): 605-608.
-
Bhojak NR, Ram SH, Desai JN, Patel JP (2020) Sex determination from femur using length of femur in Gujarat. International Journal of Medical Science and Public Health 9(9): 536-539.
-
Chaudhary PN, Shirol VS, Virupaxi RD (2017) A morphometric study of femoral length, anterior neck length, and neck-shaft angle in dry femora: A cross- sectional study. Indian Journal of Health Sciences and Biomedical Research 10(3): 331-334.
-
Hussain SS, Joseph RA (2016) A morphometric study of femur and its clinical importance. International Journal of Integrative Medical Sciences 3(7): 341-385.
-
Pillai TJ, Lakshmi DCK, Devi TS (2014) Osteometric studies on human femurs. IOSR Journal of Dental and Medical Sciences 13(2): 34-39.
-
Yadav SK, Singh SA, Yadav R (2020) Determining the angle of femoral torsion and association with shaft length and mid circumference. Asian Journal of Medical Sciences 11(3): 58-61.
-
Senol RG, Yucel AH (2019) Evaluation and Categorization of Femur Morphometry with Digital Measurement Method. Journal of Evolution of Medical and Dental Sciences 8(41): 3064-3070.
-
Brown JL (2006) Morphological variation of the proximal femur in selected skeletal remains. ProQuest.
-
Rajendran HSR, Raamabarathi K, Sundaramurthi I, Gnanasundaram V, Balaji T (2020) Anthropometric analysis of femur in South Indian population. Biomedical and Pharmacology Journal 13(1): 167-173.
-
Singh A, Nagar M, Kumar A (2014) An anthropometric study of the humerus in adults. Research and Reviews: Journal of Medical and Health Sciences 3(3): 77-82.
-
Elijah SO (2021) Femoral length reconstruction in adults: an osteometric and radiographical approach using regression equations. Journal of Anatomical Science and Research 4(3): 1-6.
- Pattern of Breast Lesions in Ovu Inland, Delta State, South Southern Nigeria
- Anatomical Variation of Arteria Lusoria: Clinical Implications for Dysphagia Lusoria and Surgical Risk
- Morphometric Study of the Vertebral Body and Pedicle of Typical Cervical Vertebrae Using Radiological Image
- Epigenetic Mechanisms Driving Human Evolutionary Changes
- Neuroprotective Effects of Ginkgo Biloba Extract on Bilateral Common Carotid Artery Ischaemic Stroke Induced in Wistar Rat
- Communicating Neuroanatomical Fibers in Health and Diseases