Comparative Performance of Five Maize Varieties as Livestock Feed in the Rift Valley of Ethiopia
The performance of five maize varieties as livestock feed in the Rift Valley of Ethiopia was assessed. The varieties included in this study were one released open pollinated variety - Melkassa-2 - one released hybrid - BH-140 - and three candidate hybrids - MH-130, MHQ-138, and SC-403. The quantity of stover produced was poorly correlated to maize grain yield (r = 0.47; P < 0.001) and no difference in grain yield and stover production was found among the five varieties. Stem was the morphological fraction with the lowest crude protein (CP) concentration (mean value of 22 g kg-1 DM) and the highest neutral detergent fiber (NDF) concentration (mean value of 852.5 g kg-1 DM). Leaf blade was the fraction with the highest CP concentration (mean value of 50.9 g kg-1 DM) and the lowest NDF concentration (mean value of 564.7 g kg-1 DM). MHQ-138 was found to have the lowest proportion of stem (53%) and the highest proportion of leaf blade (26%). Conversely, BH-140 was found to have the highest proportion of stem (66%) and the lowest proportion of leaf blade (19%). This resulted in significant differences between varieties in their total stover NDF content (P < 0.1): SC403 and BH-140 were the varieties with the highest NDF concentrations (mean Value of 717 gkg-1 DM for both) and MH-130, MHQ-138 and Melkassa-2were the varieties with the lowest (mean value of 684, 692 and 695 g kg-1 DM, respectively). The present data indicated variation on proportion of morphological fractions among varieties resulted in variation nutritive values between maize varieties suggesting possibility of considering maize varieties being both high yielding and producing stover with good nutritional value.
Introduction
Scarcity of feed - both in quantity and quality - is a growing constraint to the livestock sector in Ethiopia, particularly in the lowlands Mengistu S, Geleti D, Woyimo C (2010) [1], resulting in low productivity [2, 3]. Much of the available feed is obtained from fragmented native pastures, transient pastures between cropping cycles, crop residues and aftermath grazing [4, 5]. The ongoing increase in human population density results in an expansion of the area under cropping, at the expense of grazing areas [6]. As a result, the bulk of the biomass fed to livestock is obtained from residues of food crops, which are increasingly becoming a year-round forage supply [7, 8]. Among crop residues, maize stover represents the largest share of biomass production in the lowlands of Ethiopia, where approximately 93% of farmers are growing maize [9, 10, 11]. The nutritive value of crop residues, maize in particular, is poor [12, 13, 14]. This is compelled by the fact that, until recently, cereal breeding programs focused on increasing grain yield, with little consideration for the quantity and quality of stover produced [15, 16]. Recent studies, however, have demonstrated that nutritional parameters of maize stover quality are genetically controlled [17]. Variations in cereal residue production and nutritional value of the residue have been found for several cereals, and can thus be exploited in breeding programs. For example, significant genotypic differences have been observed in the fodder quality of sorghum and pearl millet stover [16, 18, 19, 20]. This resulted in efforts to select for improved forage characteristics of these cereals, in addition to other attributes [16, 21]. Similarly, the rejection by Syrian farmers of new cultivars of barley led the International Center for Agricultural Research for Drier Areas (ICARDA) to initiate multidimensional crop improvement programs targeting both grain yield and nutritional value of the straw [22]. In Ethiopian lowlands, the selection of maize on the bases of both increased grain yield and improved nutritional quality of the crop residue has the potential to reduce the feed constraints and increase the adoptability of new released varieties by mixed crop-livestock farmers. Therefore, the purpose of this study was to assess the feed value – in term of stover yield and stover quality - of five maize varieties: Three of the varieties used in this study were planted on farmers’ fields for final verification for release while, the other two varieties were included as standard checks since the varieties are popularly grown in the study areas.
Material and Methods
Study Area
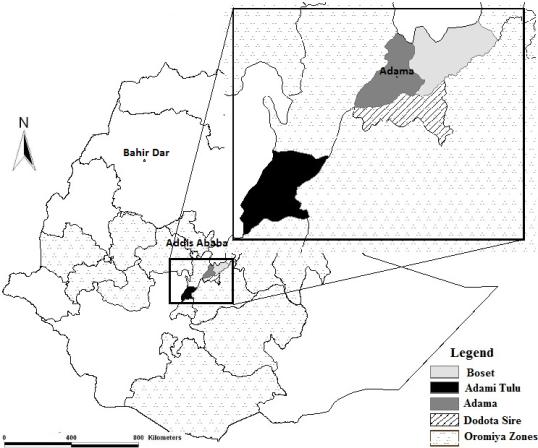
The study was conducted during the main season of 2011 in four districts of the Ethiopian Rift Valley: Adama, Adami Tulu, Boset, and Dodota Sire, located between 38°40 and 39°30 East and 7°50 and 8°40 North (Figure 1). The area lies between 1500 and 1950 meters above sea level, and is characterized by low and erratic rainfalls comprised between 500 and 800 mm (Figure 2 showing the rainfall received in the study area in 2011) and high evapo-transpiration rates [23]. Historically, the rainfall in the study area was bi-modal and the short rainy season was of significant importance for the production of livestock feed. Recently however, the short rainy season has virtually disappeared. Mean minimum temperatures range from 7.8 to 14.4°C and mean maximum temperatures from 27.2 to 28.6°C. The study area is characterized by two clearly defined seasons: a main rainy season from June to October, and a long dry season from November to May. Teff (Eragrostistef (Zucc.) Trotter), maize (Zea mays L.), wheat (Triticum sp. L.) and common bean (Phaseolus vulgaris L.) are the main crops grown. Most farmers keep livestock in the form of cattle, goats, horses and donkeys. The farming systems in the districts can be described as mixed crop-livestock systems (Figure 1).
On-farm Trials
In 2011, eight farmers were selected to host participatory variety selection trials in the study area. Each trial consisted of five varieties: one released open pollinated variety -Melkassa-2 - one released hybrid – BH- 140- and three candidate hybrids - MH-130, MHQ-138, and SC-403. MHQ-138 is a quality protein maize variety containing higher levels of lysine and tryptophan (about two-folds of conventional) whereas the other varieties are conventional maize types. The main characteristics of the varieties are shown in Table 1.
| ( | Anthesis | r | |||||||||||||||||||||
|---|---|---|---|---|---|---|---|---|---|---|---|---|---|---|---|---|---|---|---|---|---|---|---|
| Leaf | y | Silking (days | Days at | y | Attainable yield | w | 100 seed | ) | |||||||||||||||
| Variety | Type | days afte | |||||||||||||||||||||
| morpholog | after planting) | maturit | (t ha-1) | eight (g | |||||||||||||||||||
| planting) | |||||||||||||||||||||||
| Melkassa-2 | Open pollinated variety | Droping | 65 | 68 | 130 | 5 | 36 | ||||||||||||||||
| BH-140 | Top-cross hybrid | Droping | 70 | 72 | 145 | 7 | 35 | ||||||||||||||||
| MH-130 | Double top-cross hybrid | Droping | 66 | 68 | 135 | 6 | 29 | ||||||||||||||||
| MHQ-138 | Three-way cross QPM hybrid | Semi-erect | 70 | 72 | 140 | 7 | 37 | ||||||||||||||||
| SC-403 | Three-way cross hybrid | Semi-erect | 70 | 72 | 135 | 5.5 | 39 |
Table 1: Key characteristics of the five varieties evaluated in this study. In each trial, the five maize varieties were each sow
Table 1: Key characteristics of the five varieties evaluated in this study. In each trial, the five maize varieties were each sown in a plot size of 10 m x 10m with spacing of 75 cm between rows and 25 cm between plants within row. Fertilizer was applied at a rate of 100 kg ha-1 of diammonium phosphate at planting and 50 kg ha-1 of urea was side-dressed when maize reached about knee height. Two weeks after pollen shed had ceased, plant and ear heights were measured from the ground level to the base of tassel branching and to the upper most ear bearing node, respectively. At crop maturity, all maize cobs were harvested in each plot, dried and shelled. The quantity of shelled grain was weighed and a sub-sample was taken and oven dried to determine its moisture content for grain yield adjustment at 12.5%. Number of cobs per plant was obtained by dividing the total number of cobs by number of plants harvested. Immediately after grain harvest, the number of plants in the plot was counted, and five representative plants were randomly selected in each plot and separated into stem, leaf blade, leaf sheath and tassel. Each morphological fraction was weighed and sub-samples were sent to the International Livestock Research Institute nutritional laboratory (ILRI) in Addis Ababa, Ethiopia, for nutritional quality analysis. The biomass yield of each morphological fraction was calculated by multiplying the average weight by the number of plant per hectare. The total stover yield was calculated by summing the biomass yield of each morphological fraction.
Laboratory Methods
At the laboratory, samples were ground to pass through a one mm sieve and approximately three grams were oven-dried at 60°C overnight to standardize moisture conditions. Samples were subsequently scanned by a Near Infra-Red Spectrometer at 1108 – 2492 nm, with an 8nm step. Based on their spectral response and using equations developed and calibrated at the ILRI nutritional laboratory, the organic matter (OM) concentration, crude protein (CP) concentration, neutral detergent fiber (NDF) concentration, acid detergent fiber (ADF) concentration, acid detergent lignin (ADF) concentration, and in vitro organic matter digestibility (IVOMD) were estimated for each sample. The regression models used by ILRI for maize are well calibrated, from a database of hundreds of samples. The goodness of fit between values obtained from NIRS and values obtained from conventional wet chemistry (R2) is 91% for OM (N = 1001), 99% for CP (N = 998), 92% for NDF (N = 870), 98% for ADF (N = 272), 92% for ADL (N = 243), and 91% for IVOMD (N = 468).
Farm Survey
A sample of 344 farms were randomly selected in the study area and interviewed using a standardized questionnaire addressing size and composition of the household, production capital (e.g. land, equipment), crop and livestock production and management, and income generating activities. A typology was developed using this data. Three farm types were delineated: farms having no pair of oxen (i.e. no or one ox), farms having one pair of oxen (i.e. two or three oxen), and farms having two pairs of oxen or more (i.e. four oxen or more).
Calculations
OM concentration, CP concentration, NDF concentration, ADF concentration, ADL concentration and IVOMD for the total stover (i.e. including all plants morphological fractions from the above-ground biomass) were calculated using the following equation:
φ = ∑ αi × βi ∑ βi Where: 𝜑 is the total stover, 𝛼𝑖 the characteristic of the organ i and 𝛽𝑖 the weight of the morphological fraction i. IVOMD of the overall above-ground biomass was converted to metabolisable energy content using the following formula [24]:
ME = (17 × IVOMD) – 2 Where: ME is the metabolisable energy content in MJ kg-1 DM and IVOMD is the in vitro organic matter digestibility in %. For each variety, the maximum intake for a given type of cow was calculated using the following formula [24]:
I = (0.0711 × LW−0.0221)e−0.02 ×NDF Where: 𝐼 is the maximum daily intake in kg, 𝐿𝑊 is the live weight of the cow in kg, and 𝑁𝐷𝐹 is the mean neutral detergent fiber in % of the stover consumed. For a given variety and a given type of cow, the maximum energy intake was calculated by multiplying the maximum intake by the mean metabolisable energy content of the corresponding stover. The fulfillment of the energy requirement for the maintenance of a given type of cow was calculated by dividing the daily requirement for maintenance by the maximum energy intake. The energy requirement for the maintenance of a particular type of cow was calculated using the following formula [24].
ERM = 0.0916 × LW + 8.2 Where: 𝐸𝑅𝑀 is the energy requirement for maintenance in MJ day-1 and 𝐿𝑊 is the live weight of the cow in kg Assuming that maize stover was the only source of feed and that farmers were growing only one maize variety, the maximum feeding period of the herd of a particular farm (in days) from the stover produced by a given variety was calculated by multiplying the farm area cultivated to maize (in ha) by the mean stover yield of the variety (in kg ha-1), and dividing this product by the maximum daily intake of the herd. The maximum daily intake of the herd was calculated by summing the maximum daily intake of each class of cattle – oxen, bulls, cows, heifers and calves – using the formula above and assuming a live weight of 275 kg for oxen and bulls, 200 kg for cows, 125 kg for heifers, and 50 kg for calves [5]. Feeding by small ruminants and equines was ignored. Another calculation was performed where cows were fed on a mix ration of 75% maize stover and 25% groundnut cake (giving a ration with a CP content of about 14%), whilst oxen, bulls, heifers and calves were fed on a ration of pure maize stover. For the groundnut cake, values of 3.0 MJ kg-1 for the ME, 16.4% for the NDF content and 49.0% for the CP content were used. These values were calculated as the means of the values provided by the Ethiopian Feed Composition Database; http://192.156.137.110/ethfeed/Data.asp?FID=7&FTID= 1&PPC=&MC=&CID=5). Potential milk production of each cow was calculated by subtracting the total energy ingested by the cows by the total energy needed by the cows for maintenance, and dividing the value by the energy required to produce a liter of milk (estimated at 5.77 MJ L-1 for a protein content of 3.5% and a fat content of 4.5%; after Moran, 2005). The maximum period the herd could be fed was then calculated as above.
Statistical Analysis
Quantitative data was tested for normal distribution using Kolmogorov-Smirnov tests, and was log- transformed when needed. When testing for differences between plant fractions and varieties, means of quantitative data were compared by Fisher tests. Pearson correlations were used to test the relationships between quantitative data. All analyses were carried out with the software Statgraphic (Version XV).
Results
Varietal Differences
No significant difference was found among the five maize varieties in grain yield, total stover yield, plant height, ear height, and number of cobs per plant (Table 2). No significant difference in the proportion of leaf sheath and in the proportion of tassel was found among the five varieties (Table 3). However, significant differences were found among the five varieties in the proportion of stem (F = 2.41; P < 0.1; Table 3) and in the proportion of leaf blade (F =2.98; P< 0.05; Table 3). MHQ-138 was found to have the lowest proportion of stem (53%) and the highest proportion of leaf blade (26%). In contrary, BH-140 was found to have the highest proportion of stem (66%) and the lowest proportion of leaf blade (19%) (Table 3).
| y | Total | - | |||||||||||||||||||||||||||||||||
|---|---|---|---|---|---|---|---|---|---|---|---|---|---|---|---|---|---|---|---|---|---|---|---|---|---|---|---|---|---|---|---|---|---|---|---|
| Grain | Plant | Ear | T | otal O | M | T | otal AD | L | Total | ||||||||||||||||||||||||||
| stover | N° of cob | s | Total CP ( | g | Total NDF (g | T | otal ADF ( | g | |||||||||||||||||||||||||||
| Variety | yield (t | height | height | (g kg-1 | (g kg-1 | IVOMD (g | |||||||||||||||||||||||||||||
| ield (t ha | per plant | kg-1 DM) | kg-1 DM) | kg-1 DM) | |||||||||||||||||||||||||||||||
| ha-1) | (cm) | (cm) | DM) | DM) | kg-1 DM) | ||||||||||||||||||||||||||||||
| 1) | |||||||||||||||||||||||||||||||||||
| BH-140 | 4.7 ± 1.7 | 8.5 ±2.8 | 204 ±28 | 111 ±30 | 1.00 ± 0.03 | 835.8 ± 11.5 | 28.1 ± 13.2 | 717.0 ± 24.0 a | 510.8 ± 28.4 a | 55.2 ± 6.9 | 581.4 ± 14.9 | ||||||||||||||||||||||||
| Melkassa-2 | 4.7 ± 1.4 | 5.5 ±1.4 | 214 ±22 | 100 ±21 | 0.99 ± 0.06 | 834.8 ± 13.7 | 28.4 ± 11.0 | 694.6 ± 27.9 ab | 491.8 ± 33.2ac | 56.4 ± 7.6 | 577.9 ± 25.9 | ||||||||||||||||||||||||
| MH-130 | 4.9 ± 1.7 | 7.0 ±2.9 | 199 ±23 | 89 ±19 | 1.03 ± 0.12 | 833.2 ± 3.2 | 24.7 ± 13.2 | 682.8 ± 19.6 ab | 461.1 ± 30.4 c | 51.2 ± 8.0 | 590.1 ± 20.4 | ||||||||||||||||||||||||
| MHQ-138 | 4.8 ± 1.0 | 6.1 ±2.6 | 197 ±9 | 82 ±14 | 1.00 ± 0.06 | 828.7 ± 9.3 | 32.2 ± 12.6 | 680.1 ± 33.1 b | 460.1 ± 40.1 c | 51.7 ± 6.9 | 587.3 ± 25.4 | ||||||||||||||||||||||||
| SC-403 | 5.0 ± 1.2 | 5.9 ±1.4 | 191 ±45 | 95 ±15 | 0.99 ± 0.04 | 844.1 ± 11.0 | 28.1 ± 6.4 | 717.4 ± 33.0 a | 529.6 ± 15.0 a | 61.7 ± 2.2 | 559.3 ± 14.9 | ||||||||||||||||||||||||
| F | 0.08 | 1.55 | 0.76 | 1.82 | 0.3 | 1.68 | 0.23 | 2.2 | 5.59 | 1.91 | 1.99 | ||||||||||||||||||||||||
| P | ns | ns | ns | ns | ns | ns | ns | 0.1 | 0.005 | ns | ns |
Table 2: Grain yield, total stover yield, plant height, ear height, number (N°) of cobs per plant, total ash content, total organ
Table 2: Grain yield, total stover yield, plant height, ear height, number (N°) of cobs per plant, total ash content, total organic matter content (OM),total crude protein content (CP), total neutral detergent fiber content (NDF), total acid detergent fiber content (ADF), total acid detergent lignin (ADL), and total in vitro organic matter digestibility (IVOMD) (Mean ± SE) of maize varieties. F-values and P-values from the Fischer tests are displayed in the last two rows. In each column, means followed by the same letter or no letter are not statistically significant.
| Variety | Stem | Leaf Sheath | Leaf Blade | Tassel | ||||||||
|---|---|---|---|---|---|---|---|---|---|---|---|---|
| BH=140 | 65.1 ± 4.2 | 13.3 ± 3.1 | 18.9 ± 1.2 | 2.6 ± 1.7 | ||||||||
| Melkassa 2 | 54.9 ± 12.0 | 18.2 ± 6.3 | 22.5 ± 5.4 | 4.4 ± 1.6 | ||||||||
| MH-130 | 58.8 ± 8.8 | 15.4 ± 4.6 | 24.5 ± 4.4 | 3.3 ± 1.1 | ||||||||
| MHQ-138 | 46.1 ± 16.5 | 19.2 ± 5.1 | 30.1 ± 9.8 | 4.7 ± 2.3 | ||||||||
| SC-403 | 60.4 ± 7.4 | 15.8 ± 2.3 | 20.8 ± 5.5 | 3.0 ± 0.7 |
Table 3: Proportion (mean ± standard deviation) of stem, leaf sheath, leaf blade and tassel, from the total above-ground biomass
Feed Quality of Maize Stover
No significant differences were found among the varieties in the OM, CP and ADL concentrations as well as in
| IVOMD (g kg-1 | ||||||||||||||||||
|---|---|---|---|---|---|---|---|---|---|---|---|---|---|---|---|---|---|---|
| C | haracteristic | s | O | M (g kg-1 DM | ) | C | P (g kg-1 DM | ) NDF (g kg-1 DM) | A | DF (g kg-1 DM | ) | A | DL (g kg-1 DM | ) | ||||
| DM) | ||||||||||||||||||
| Stem | 950.0 ± 11.7 a | 22.3 ± 11.2 a | 852.5 ± 30.1 a | 620.1 ± 45.7 a | 75.8 ± 11.0 a | 586.0 ± 34.0 a | ||||||||||||
| Leaf sheath | 911.7 ± 11.4 b | 27.5 ± 9.2 a | 750.4 ± 32.1 b | 459.6 ± 31.2 b | 43.9 ± 4.1 b | 675.0 ± 24.0 b | ||||||||||||
| Leaf blade | 830.4 ± 18.6 c | 50.9 ± 21.7 b | 564.7 ± 36.8 c | 390.9 ± 38.3 c | 36.4 ± 7.1 c | 707.0 ± 23.0 c | ||||||||||||
| Tassel | 928.2 ± 11.8 d | 50.2 ± 13.4 b | 706.4 ± 37.2 d | 477.0 ± 28.7 b | 51.6 ± 5.5 d | 728.0 ± 26.0 d | ||||||||||||
| F | 466.73 | 33.44 | 389.89 | 221.78 | 170.57 | 169.17 | ||||||||||||
| P | 0.001 | 0.001 | 0.001 | 0.001 | 0.001 | 0.001 |
Table 4: Ash, organic matter (OM), crude protein (CP), neutral detergent fiber (NDF), acid detergent fiber (ADF), acid detergent
Table 4: Ash, organic matter (OM), crude protein (CP), neutral detergent fiber (NDF), acid detergent fiber (ADF), acid detergent lignin (ADL), and in vitro organic matter digestibility (IVOMD) concentrations (Mean ± SE) in the stem, the leaf sheath, the leaf blade and the tassel. ’.F-values and P-values from the Fischer tests are displayed in the last two rows. In each column, means followed by the same letter or no letter are not statistically significant. The IVOMD of the total stover. However, significant differences among the varieties were found in the NDF concentration (F = 2.20; P < 0.1; Table 2) and the ADF concentration of the total stover (F = 5.59; P < 0.05). SC- 403 and BH-140 were found to be the varieties with the highest NDF concentrations (717.4 ± 33.0 and 717.0 ±
24.0 g kg-1 DM, respectively) and the highest ADF concentrations (529.6 ± 15.0 and 510.8 ± 28.4 g kg-1 DM, respectively; Table 2). MHQ-138, MH-130 and Melkassa-2 were the varieties with the lowest NDF concentrations (680.1 ± 33.1, 682.8 ± 19.6, and 694.6 ± 27.9 g kg-1 DM, respectively) and the lowest ADF concentrations (460.1 ± 40.1, 461.1 ± 30.4, and 491.8 ± 33.2 g kg-1 DM, respectively). The stem had the lowest CP content and IVOMD (22.3 ± 11.2 g kg-1 DM and 586 ± 34 g kg-1 DM, respectively) and the highest NDF content, ADF content and ADL content (852.5 ± 30.1, 620.1 ± 45.7, and 75.8 ± 11.0 g kg-1 DM, respectively; Table 4). The leaf blade and the tassel were the organs with the highest CP content (50.9 ± 21.7 and 50.2 ± 13.4 g kg-1 DM, respectively) and the highest IVOMD (707 ± 23 and 728 ± 26 g kg-1 DM, respectively). Leaf blade had the lowest NDF concentration, ADF concentration and ADL concentration (564.7 ± 36.8, 390.9 ± 38.3 and 36.4 ± 7.1 g kg-1 DM, respectively; Table 4). The composition of the leaf sheath was - intermediate between the compositions of the stemand the leaf blade.
Relationships between Yield and Stover Quality Traits
The total maize stover yield was positively but weakly correlated to maize grain yield (r = 0.47; P < 0.001, Figure 3a). In opposition, the main indicators of maize stover quality – CP concentration, NDF concentration, IVOMD – were not correlated to maize grain yield (Figure 3b, 3c and 3d). Total stover yield was not correlated to any stover quality attribute (OM, CP, NDF, ADF, ADL, IVOMD). Plant height was not significantly correlated to grain yield, total stover yield, stem yield, leaf yield and tassel yield. However, it was weakly correlated to leaf sheath yield (r = 0.364; P < 0.05). It was also negatively correlated to OM content (r = - 0.60; P < 0.001), NDF content (-0.44; P < 0.05) and ADL content (r = -0.37; P < 0.05) and positively correlated to IVOMD (r = 0.41; P< 0.05). IVOMD was also found to be negatively correlated to NDF (r = -0.61; P < 0.001).
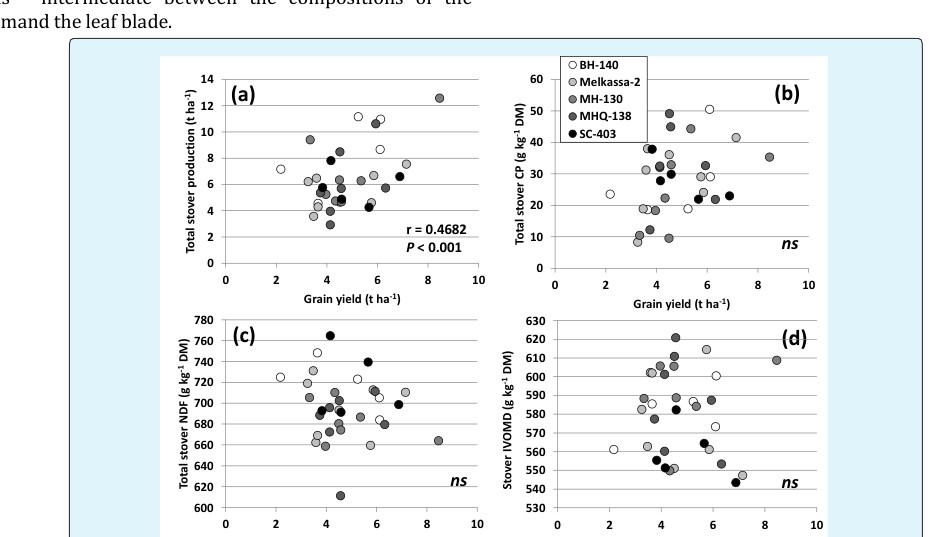
Grain yield (t ha-1) Figure 3: Relationship between maize grain yield and (a) total above-ground biomass, (b) crude protein content of the stover, (c) total fiber content in the stover, and (d) in vitro organic matter digestibility (IVOMD) energy in the stover, for the five varieties tested. No significant correlation between total stover yield and plant height was found. However, total stover yield was found to be positively correlated to the total stem yield (r = 0.936; P < 0.01), total yield of leaf sheath (r = 0.589; P < 0.01), leaf blade (r = 0.692; P < 0.01) and negatively to tassel yield (r = -0.054; P < 0.770; Table 5). The leaf blade yield was positively correlated to the total stover yield (r = 0.692, P < 0.001), the stem yield (r = 0.406, P < 0.05), the leaf sheath yield (r = 0.809, P < 0.001) and the tassel yield (r = 0.422, P < 0.05; Table 5).
| Total stover | Stem | Leaf sheath | Leaf blade | Tassel | ||||||||||||
|---|---|---|---|---|---|---|---|---|---|---|---|---|---|---|---|---|
| Total stover | R | 1 | 0.936 | 0.589 | 0.692 | -0.054 | ||||||||||
| P | 0 | 0 | 0 | 0.77 | ||||||||||||
| N | 32 | 32 | 32 | 32 | 32 | |||||||||||
| Stem | R | 0.936 | 1 | 0.303 | 0.406 | -0.284 | ||||||||||
| P | 0 | 0.091 | 0.021 | 0.115 | ||||||||||||
| N | 32 | 32 | 32 | 32 | 32 | |||||||||||
| Leaf sheath | R | 0.589 | 0.303 | 1 | 0.809 | 0.306 | ||||||||||
| P | 0 | 0.091 | 0 | 0.089 | ||||||||||||
| N | 32 | 32 | 32 | 32 | 32 | |||||||||||
| Leaf blade | R | 0.692 | 0.406 | 0.809 | 1 | 0.422 | ||||||||||
| P | 0 | 0.021 | 0 | 0.016 | ||||||||||||
| N | 32 | 32 | 32 | 32 | 32 | |||||||||||
| Tassel | R | -0.054 | -0.284 | 0.306 | 0.422 | 1 | ||||||||||
| P | 0.77 | 0.115 | 0.089 | 0.016 | ||||||||||||
| N | 32 | 32 | 32 | 32 | 32 |
Table 5: Correlations between different morphological fractions yields (kg ha-1). Terms in bold refer to correlation that are sta
Farm-Level Implications
No significant difference was found among the five varieties in potential utility index of the five varieties studied (means comprised between 51.3% for SC-503 and 53.8% for MH-130). Significant differences in the fulfillment of the daily energy requirements for maintenance were predicted between varieties for the herds of all farm types, when fed exclusively on maize stover (Table 6). SC-403 was predicted to be the variety providing the lowest energy, whilst MH-130 was predicted to be the variety providing the highest energy, for the three types of farms. SC-403 was not predicted to meet the energy requirements for maintenance of the average herd of any farm type (93.0 ± 6.9, 94.6 ± 4.2, and 95.3 ± 3.2 %, for Type 1, Type 2, and Type 3, respectively). Similarly, BH-140 was not predicted to meet the energy requirement for maintenance of the average Type 1 and Type 2 farmers ‘herds (97.6 ± 7.3 and 99.3 ± 4.4%, respectively).In opposition, Melkassa-2, MHQ-138 and MH-130 would meet the energy requirement of the average herd of all three farm types and allow for productive use (fulfillment exceeding 100%).
| F | ulfillment of the daily energy requirements fo | r | ||||||||||
| Maximum feeding period (day) | ||||||||||||
| Maize variety | maintenance (%) | |||||||||||
| Type 1 | Type 2 | Type 3 | Type 1 | Type 2 | Type 3 | |||||||
| SC-403 | 93.0 ± 6.9 a | 94.6 ± 4.2 a | 95.3 ± 3.2 a | 804 ± 821 a | 338 ± 232 ac | 224 ± 199 a | ||||||
| BH-140 | 97.6 ± 7.3 b | 99.3 ± 4.4 b | 100.0 ± 3.4 b | 1167 ± 1193 b | 490 ± 337 b | 325 ± 289 b | ||||||
| Melkassa-2 | 101.2 ± 7.6 c | 102.9 ± 4.6 c | 103.7 ± 3.5 c | 723 ± 739 a | 304 ± 209 c | 202 ± 179 a | ||||||
| MHQ-138 | 102.7 ± 7.7 cd | 104.5 ± 4.6 d | 105.3 ± 3.6 d | 794 ± 811 a | 333 ± 229 ac | 221 ± 196 a | ||||||
| MH-130 | 106.4 ± 7.9 e | 108.2 ± 4.8 e | 109.0 ± 3.7 e | 954 ± 975 ab | 401 ± 276 d | 266 ± 236 ab | ||||||
| F | 32.32 | 174.22 | 106.09 | 2.84 | 10.99 | 2.4 | ||||||
| P | 0.001 | 0.001 | 0.001 | 0.05 | 0.001 | 0.1 |
Table 6: Mean value of the fulfillment of the energy requirements for maintenance of the herd of Type 1 farms (low resource endow
Table 6: Mean value of the fulfillment of the energy requirements for maintenance of the herd of Type 1 farms (low resource endowment), Type 2 farms (medium resource endowment) and Type 3 farms (high resource endowment) when fed exclusively on stover of SC 403, BH 140, Melkassa 2, MH 130, and MHQ 138; and mean value of the maximum period of time the same herds can be fed exclusively on stover from the same varieties. Standard errors are given after the sign ‘±’. F-values and P-values from the Fischer tests are displayed in the last two rows. In each column, means followed by the same letter or no letter are not statistically significant.
Significant differences between varieties were also predicted in the maximum period of time the herd could be fed on maize stover, for all farm types (Table 6). The longest feeding period was predicted with BH-140,for the herds of all farm types (1167 ± 1193, 490 ± 337, and 325 ± 289 days, for Type 1, Type 2, and Type 3, respectively) and the shortest with Melkassa-2 (723 ± 739, 304 ± 209, and 202 ± 179 days, for Type 1, Type 2, and Type 3, respectively). None of the varieties of maize were predicted to sustain the herd of Type 3 farmers for the whole year, when fed exclusively on maize stover. Similarly, SC-403, MHQ-138 and Melkassa-2 were predicted to fail to sustain the average Type 2 farmer’s herd for the whole year, whilst any of the varieties would sustain the average Type 1 farmers’ herd for the whole year.
No significant difference among varieties was predicted in milk production when stover was mixed to groundnut cake and fed to cows of any farm type (Table 7). This feeding strategy was predicted to slightly extend the maximum period of time the herd could be fed on maize stover for all farm types and all maize varieties, compared with the strategy where the whole herd was exclusively fed on maize stover with no supplementation. As for this later feeding strategy, none of the varieties of maize was predicted to sustain the average Type 3 farmer’s herd for the whole year. In addition, BH-140 and MH-130 were the only varieties predicted to sustain the average Type 2 farmers’ herd for the whole year, and any of the varieties would sustain the average Type 1 farmers ‘herd for the whole year.
| Milk production (L day-1) | Maximum feeding period (day) | |||||||||||
|---|---|---|---|---|---|---|---|---|---|---|---|---|
| Maize variety | ||||||||||||
| Type 1 | Type 2 | Type 3 | Type 1 | Type 2 | Type 3 | |||||||
| SC-403 | 1.29 ± 1.95 | 4.11 ± 3.84 a | 9.68 ± 9.64 | 808 ± 828 a | 341 ± 232 ac | 229 ± 199 a | ||||||
| BH-140 | 1.29 ± 1.95 | 4.11 ± 3.84 b | 9.68 ± 9.64 | 1173 ± 1202 b | 496 ± 337 b | 333 ± 289 b | ||||||
| Melkassa-2 | 1.48 ± 2.15 | 4.58 ± 4.19 c | 10.65 ± 10.49 | 730 ± 750 a | 308 ± 209 c | 207 ± 179 a | ||||||
| MHQ-138 | 1.51 ± 2.18 | 4.65 ± 4.23 d | 10.78 ± 10.61 | 808 ± 833 a | 340 ± 231 ac | 228 ± 198 a | ||||||
| MH-130 | 1.58 ± 2.26 | 4.83 ± 4.36 e | 11.15 ± 10.92 | 966 ± 994 ab | 407 ± 277 d | 274 ± 237 ab | ||||||
| P | 0.39 | 0.87 | 0.21 | 2.74 | 10.97 | 2.43 | ||||||
| F | ns | ns | ns | 0.05 | 0.001 | 0.05 |
Table 7: Mean milk production of the herd of Type 1 farms (low resource endowment), Type 2 farms (medium resource endowment) and
Table 7: Mean milk production of the herd of Type 1 farms (low resource endowment), Type 2 farms (medium resource endowment) and Type 3 farms (high resource endowment) assuming that the cows are fed on a mixed ration of 75% maize stover and 25% groundnut cake, and that oxen, bulls, heifers and calves are fed exclusively on maize stover, for SC- 403, BH-140, Melkassa-2, MH-130, and MHQ-138; and mean value of the maximum period of time the same herds can be fed with the same feeding strategy, for the five maize varieties. Standard errors are given after the sign ‘±’. F-values and P- values from the Fischer tests are displayed in the last two rows. In each column, means followed by the same letter or no letter are not statistically significant.
Discussion
What makes a Good Maize Variety for Livestock Feed?
From the analysis above, it appears that varieties with lower proportion of stems and greater proportion of leaf blades – these two parameters being negatively correlated - would have higher nutritional value for ruminants. From the five varieties tested in the current study, MHQ-138 appeared to be a relatively good source of livestock feed as it produced the lowest proportion of stems and the highest proportion of leaf blades, whilst BH-140 appeared to be a relatively poor source of livestock feed as it produced the highest proportion of stems and the lowest proportion of leaf blades (Table 3). Other studies have found similar varietal differences in the proportion of morphological fractions in maize stover Tolera A, Berg T, Sundstøl F (1999) [15] and other cereals’ straw [22, 25]. These differences translated into significant differences between varieties in the NDF concentration of the total stover (and therefore in its bulkiness) and in its ADF concentration (representing the poorly digestible fraction of the stover): BH-140 and SC- 403 had higher NDF and ADF concentrations than Melkassa-2, MH-130 and MHQ-138 (Table 2). No varietal difference was found in other nutritional parameters – including CP concentration and IVOMD – for the total stover biomass. This is in agreement with the results reported by other investigators Sundstøl F (1999), Mekonnen, H et al. (2011), Zagi S, et al. (2012), Buxton DR, (1998) et al. [15, 26, 27, 28]. Differences in NDF and ADF concentrations between varieties, and lack of difference for other nutritional parameters, are in agreement with Tolera A, Berg T, Sundstøl F (1999) [15] recommendation to prioritize a reduction in cell-wall concentration over an improvement of digestibility in the genetic improvement of grasses and cereals for livestock feeding. In opposition, the impact of increasing digestibility would be higher than the impact of reducing the cell-wall content in legume forage. No significant difference among the five varieties was found in grain yield, total stover yield, plant height, ear height and number of cobs per plant. Thus, from the five varieties assessed in this study, MHQ-138 appears to be the most interesting one, as it offers grain and stover yields similar to other varieties, but produces stover with significantly lowest NDF and ADF concentrations. This variety also produces grain containing significantly higher contents of lysine and tryptophan than other varieties. In opposition, BH-140 and SC-403 appear to be the least desirable varieties, being the ones with the highest NDF and ADF concentrations. It is important, however, to be cautious in ranking maize varieties based on the results of this study alone. For a given maize variety, the quality of the stover offered to livestock under typical farm conditions may depart significantly from our results. First, more leaf material than stem is lost in the process of harvesting, transporting and storing the stover, and the stover offered to livestock may contain a larger proportion of stem than indicated by fractionation, as in this study [29]. Second, the stover analyzed in this study was produced using relatively high rates of mineral fertilizer compared to typical farmer practice. In particular, lower application of nitrogen may affect both the quantity and the quality of stover produced. For instance, Wang CL, et al. (2009) [17] have demonstrated that low nitrogen conditions could increase ADF and NDF contents, and decrease CP content and stover yield of maize. More generally, significant interactions between season and genotype may occur, as suggested by Jung HG, Mertens DR, Buxton DR (1998) [30]. Therefore, accurate identification of superior material for stover quality would require an evaluation in more locations and/or during more seasons.
Variability in Nutritional Quality of Maize Stover Exists and is Independent of Grain Yield
In line with previous studies [e.g. 8], the current results demonstrate that maize stover is a poor source of feed for ruminant livestock, with high NDF concentration (695.9 ± 30.3 g kg-1 DM) resulting in low intake due to ruminal fill, low digestibility (580 ± 23 g kg-1 DM) and low CP concentration (28.3 ± 11.2 g kg-1 DM). However, large differences were found in the composition of the different stover samples analyzed, as demonstrated by the high values of the standard errors in Table 4. Taller plants tended to produce stover of a higher quality, as plant height was found to be negatively correlated to NDF and ADL contents and positively correlated to IVOMD. The observed variability in stover composition was unrelated to grain yield variability, as no correlation was found between grain yield and CP concentration (Figure 3b), NDF concentration (Figure 3c), ADF concentration, ADL concentration, and IVOMD of the stover (Figure 3d). In a similar study in Ethiopia, Tolera A, Berg T, Sundstøl F (1999) [15] found no correlation between grain yield and the main parameters of feed quality [16], also found grain yield and stover quality to be independent characteristics of sorghum in India [31]. Also a found positive relationship between grain and stover yield and a weak relationship between stover quality traits and grain yield. The quantity of stover produced by maize was found to be positively correlated to grain yield (Figure 3a), large grain yields implying large stover yields. This is consistent with findings of other studies [32, 15]. However, no relation was found between total stover yield and the various parameters of stover nutritional quality. No significant correlation observed between IVOMD and stover yield was in agreement with the finding of Zaidi PH, Vinayan MT, Blümmel M (2013) [28]. Therefore, the present study demonstrates the compatibility in maize of high grain yield with high stover yield and good nutritional value of the stover. In other words, it appears to be possible to select independently for grain yield and feed quantity and quality traits in maize. When considering the various plant parts, the leaf blade had the highest nutritional quality – having the lowest NDF, ADF and ADL concentrations, the highest CP concentration and the highest IVOMD after tassel – and the stem had the lowest nutritional quality– having the highest NDF, ADF and ADL concentrations, the lowest CP concentration and the lowest IVOMD (Table 4). This is consistent with previous studies conducted in Ethiopia [e.g. 19]. The stem fraction represented more than half of the total stover, and was thus the morphological fraction having the most important impact on the nutritive value of the stover. The proportion of stem was negatively correlated to the proportion of other fractions, of higher nutritional quality, including the leaf blade (Table 5). Therefore, we conclude that the proportion of stem and leaf blade is a major determinant of the quality of maize stover, similarly to Harika AS, Tripathi HP, Saxena VK (1995) [33]. The lack of correlation between the grain yield and the proportion of stem suggest the possibility to select for these two traits independently. However, the negative correlation between the proportion of stem and the total stover yield suggest possible tradeoffs between stover quantity and stover quality.
What stover for what farmer? Influence of the Production Orientation, the Herd Size, and the Herd Composition.
Although the CP content of all stover samples was higher than 12 g kg-1 DM - the minimum requirements for rumen microbes - it was below 70 g kg-1 DM, the critical level to influence feed intake [34, 15]. Therefore, maize stover is at best a maintenance feed. No difference between the five varieties was found in the mean potential utility index: about half of the biomass produced by maize has some value, as grain or as feed, for mixed crop-livestock farmers. This calculation, however, only takes into account the productivity and the digestibility, but ignores the limitation of the daily intake due to high NDF content contributing to ruminal fill [12]. The maximum daily intake of a given feed by a given herd is a function of the NDF content of the stover, the composition of the herd (larger cows have a higher daily intake than smaller cows), and the number of cattle. Indeed, significant differences were found between varieties in the fulfillment of the energy requirements for maintenance, for all farm types. The maximum period of time the herd can be fed on maize stover is another important parameter to consider, particularly in the study area where feed is increasingly limited. It is directly linked to the quantity of stover produced and the daily intake. Significant differences between varieties were found for all farm types. For Type 1 farmers, any variety may sustain the herd for the whole year (Table 6). For Type 2 farmers, only BH-140 and MH- 130 may sustain the herd for the whole year (Table 6): with SC-403, Melkassa-2 and MHQ-138, the production of other sources of roughage or the consumption of stover produced by other farms (through communal grazing) would be necessary. For Type 3 farmers, none of the maize varieties may sustain the herd for the whole year, making forage production and/or communal grazing a necessity (Table 6). Production orientation is another important factor to consider. Although significant differences in the fulfillment of the energy requirements for maintenance of the herd are predicted for all farm types (Table 6), no difference between varieties is predicted in milk production of the herd of any of the farm type when mixing maize stover with groundnut cake to obtain a feed with a CP content of 14% (Table 7). Similar results are expected with other forms of livestock intensification such as fattening. It appears that when mixed to a concentrate, the differences in nutritional quality of different types of maize stover only become “noise” having insignificant impact on the productivity of animals. Thus, the current study suggests that improvement of the feed quality of maize will have little implication for dairy production. This is coherent with the study of Romney DL, Thorne P, Lukuyu B, Thornton PK (2003) [8], who concluded that genetic improvement of stover digestibility in maize appears to have little potential for improved milk production in the absence of high-protein supplements in Eastern and Southern Africa. Thornton PK, Kristjanson PM, Thorne PJ (2003) [35] Also estimated that the cost associated with the development of maize varieties with improved nutritional value would far exceed expected benefits. These conclusions contrast with the ones of Kristjanson P, Zerbini E (1999) [36] who predicted a 6-7% increase in milk production as a result of a 1% increase in millet and sorghum stover digestibility in India. This is probably due to the fact that dairy farmers in India use large quantities of concentrate feed, in addition to chopping and treating of cereal residues: nutritional quality of the residues used may thus be the most limiting factor to improved performance of livestock production, making genetic improvement of cereal residues highly profitable. In contrast to South Asia, treatment of cereal residues prior to feeding is uncommon in sub-Saharan Africa. Benefits of such practice, however, would probably yield higher benefits than genetic improvement for dairy and beef farmers. Flachowsky G, Kamra DN, Zadrazil F (1999) [13], for example, found that chopped wet straw treated with 4% urea increased straw intake of bulls by 45%, their energy intake by 68% and their body weight gain by 53% compared to chopped straw. As for the maintenance strategy (Table 6), statistically significant differences in the maximum feeding period of the herd were found for all farm types when feeding maize stover mixed with groundnut cake to cows (Table 7). We conclude that, when productivity rather than maintenance is an objective, varieties with high stover yields should probably be preferred to varieties with improved nutritional value, particularly for Type 2 and Type 3 farmers, who own larger herds of cattle compared to Type 1 (no variety would sustain the average Type 3 farmers’ herd for the whole year, while only SC-403, BH- 140 and MH-130 would do so for the average Type 2 farmer).
Conclusion
Maize stover is a nutritionally poor source of feed. However, it appears possible to select for better feed value of maize stover – in terms of quality and quantity – without compromising on grain yield. Differences in stover quality appear to be linked to differences in proportions of stem and leaf blade, these parameters being easily measured in the field, without the need for tedious sampling and complex lab analyses. Varietal differences were found in the proportion of these morphological fractions, resulting in differences in the cell-wall content of the total stover (NDF and ADF contents), but not in its CP content, digestibility and its other nutritional parameters. Selecting for lower cell-wall content – which could be achieved by selecting for varieties with a lower proportion of stem, the fraction with the highest cell-wall content - should be the priority for genetic improvement of maize stover. Varietal differences in the nutritional quality of stover have different implications for different types of farmers, e.g. depending on the herd size and the herd composition. The impact of varietal differences also depends on the production orientation. For livestock keepers whose objective is maintenance, only the varieties with the lowest cell-wall content would enable a herd to meet its energy requirement for maintenance. For livestock producers whose objective is dairy or meat production, however, no difference is expected in the level of productivity with the five varieties tested. These farmers may thus require varieties producing high stover yield, regardless of the nutritional quality of the stover. For these farmers, mechanical and chemical treatments of stover may hold greater potential to increase livestock productivity than genetic improvement of the stover quality of maize. The present study illustrates the importance of putting nutritional quality results into the context of the broader farming system.
References
-
Mengistu S, Geleti D, Woyimo C (2010) Integrated fodder and grain crops production on upland black clay soils (Vertisols). Ethiopian Journal of Animal Production 10: 55-72.
-
Tolera A, Abebe A (2007) Livestock production in pastoral and agro-pastoral production systems of southern Ethiopia. Livestock Research for Rural Development 19(12): 4-7.
-
Negesse T, Makkar HPS, Becker K (2009) Nutritive value of some non conventional feed resources of Ethiopia determined by chemical analyses and an in vitro gas method. Anim Feed Sci Tech 154(3): 204- 217.
-
Sisay A, Baars RMT (2002) Grass composition and rangeland condition of the major grazing areas in the mid Rift Valley, Ethiopia. Afr J Range For Sci 19(3) 161-166.
-
Wondatir Z (2010) Livestock Production Systems in Relation to Feed Availability in the Highlands and Central Rift Valley of Ethiopia. MSc Dissertation. Haramaya University, Ethiopia.
-
Abule E, Snyman HA, Smit GN (2005) Comparisons of pastoralists perceptions about rangeland resource utilisation in the Middle Awash Valley of Ethiopia. J Environ Manage 75(1): 21-35.
-
Sisay A, Baars R, Sileshi Z (2002) Herbacious species composition and dry matte yield of grazing areas in the mid rift valley of Ethiopia. In: livestock in food security roles and contributions-proceedings of the 9th annual conference of the Ethiopia Society of Animal Production (ESAP) held in Addis Ababa, Ethiopia, August 30-31, 2001.
-
Romney DL, Thorne P, Lukuyu B, Thornton PK (2003) Maize as food and fee in intensive smallholder systems: management options for improved integration in mixed farming systems of east and southern Africa. Field Crop Res 84(1-2): 159-168.
-
Desta L, Kassie M, Benin S, Pender J (2000) Land degradation and strategies for sustainable development in the Ethiopian Highlands: Amhara Region. Socioeconomics and Policy Research Working Paper No 32, International Livestock Research Institute, Addis Abeba.
-
Girma A, Teshale A, Hussen H, Tewodrose M, Abdel- Rahman M (2005) Participatory Selection of Drought Tolerant Maize Varieties using Mother and Baby Methodology: A Case Study in the Semi Arid Zones of the Central Rift Valley of Ethiopia. World J Agric Sci 1(1): 22-27.
-
Dawit A, Wilfred M, Mandefro N, David J (2008) The maize seed system in Ethiopia: challenges and opportunities in drought prone areas. Afr J Agric Res 3(4): 305-314.
-
Jung HG, Allen MS (1995) Characteristics of plant cell walls affecting intake and digestibility of forages by ruminants. J Anim Sci 73(9): 2774-2790.
-
Flachowsky G, Kamra DN, Zadrazil F (1999) Cereal straws as animal feed: possibilities and limitations. J Appl Anim Res 16(2): 105-118.
-
Thorne PJ, Thornton PK, Kruska RL, Reynolds L, Waddington SR, et al. (2002) Maize as food, feed and fertilizer in intensifying crop-livestock systems in East and southern Africa: An ex ante impact assessment of technology interventions to improve smallholder welfare. ILRI Impact Assessment Series 11. ILRI (International Livestock Research Institute), Nairobi, Kenya., 123 pp.
-
Tolera A, Berg T, Sundstøl F (1999) The effect of variety on maize grain and crop residue yield and nutritive value of the stover. Anim Feed Sci Tech 79: 165-177.
-
Blümmel M, Zerbini E, Reddy BVS, Hash CT, Bidinger F, et al. (2003) Improving the production and utilization of sorghum and pearl millet as livestock feed: progress towards dual-purpose genotypes. Field Crop Res 84(1-2): 143-158.
-
Xie HL, Ji HQ, Liu ZH, Tian GW, Wang CL, et al. (2009) Genetic basis of nutritional content of stover in maize under low nitrogen conditions. Euphytica 165(3): 485-493.
-
Blümmel M, Rai KN (2003) Observations on stover quality, stover quality-grain yield relationships and heterosis effects in 52 cultivars of pearl millet. International Sorghum and Millet Newsletter 44: 141- 145.
-
Ravi D, Vishala AD, Nayaker NY, Seetharama N, Blümmel M (2003) Grain yield and stover fodder value relations in 83 varieties and hybrids of off- seaso (Rabi) sorghums. International Sorghum and Millet Newsletter 44: 28-32.
-
Hall A, Blümmel M, Thorpe WI, Bidinger FR, Hash CT (2004) Sorghum and pearl millet as food feed-crops in India. Anim. Nutr Feed Techn 4(1): 1-15.
-
Hash CT, Raj AGB, Lindup S, Sharma A, Beniwal CR, et al. (2003) Opportunities for marker-assisted selection (MAS) to improve the feed quality of crop residues in pearl millet and sorghum. Field Crops Res 84(1-2): 79-88.
-
Capper BS, Thomson EF, Rihawi S, Termanini A, Macrae R (1986) The feeding value of straw from different genotypes of barley when given to Awassi sheep. Animal Production 42(3): 337-342.
-
Mandefro N, Hussien M, Gelana S, Gezahegne B, Yosef B, et al. (2001) Maize Improvement for drought stressed areas of Ethiopia. In: the second national maize workshop of Ethiopia 12-16 November, 2001 Addis Ababa, Ethiopia
-
Moran J (2005) Tropical Dairy Farming. CSIRO Publishing.
-
Anandan S, Khan AA, Ravi D, Sai Bucha Rao M, Ramana RY, et al. (2013) Identification of a superior dual purpose maize hybrid among widely grown hybrids in South Asia and value addition to its stover through feed supplementation and feed processing. Field Crops Res. 153: 52-57.
-
Diriba G, Adugna T, Ashenafi M, Mekonnen H (2011) Effect of variety of maize on yield of grain, residue fractions and the nutritive value of the whole stover. Ethiop J Appl Sci Technol 2(2): 91- 96.
-
Ngele M, Voncir N, Neyu A, Zagi S (2012) Nutrient evaluation of some varieties of maize stover residue grown within Bauchi Metropolis. Continental J Agricultural Science 6(1): 1-5.
-
Zaidi PH, Vinayan MT, Blümmel M (2013) Genetic variability of tropical maize stover quality and the potential for genetic improvement of food-feed value in India. Field Crops Res 153: 94-101.
-
Tolera A, Sundstøl F (1999) Morphological fractions of maize stover harvested at different stages of grain maturity and nutritive value of different fractions of the stover. Anim Feed Sci Tech 81(1-2): 1-16.
-
Jung HG, Mertens DR, Buxton DR (1998) Forage quality variation among maize inbreds: in vitro fiber digestion kinetics and prediction with NIRS. Crop Sci 38: 205-210.
-
Berhanu TE, Twumasi AS, Blümmel M, Friesen D, Demewoz N, et al. (2013) Genetic variability of maize stover quality and the potential for genetic improvement of fodder value. Field Crops Res 153: 79-85.
-
Tolera A, Sundstøl F, Said AN (1998) The effect of stage of maturity on yield and quality of maize grain and stover. Anim Feed Sci Tech 75: 157-168.
-
Harika AS, Tripathi HP, Saxena VK (1995) Maize stover. In: Singh K, Schiere JB (Eds.) Handbook for Straw Feeding Systems. ICAR, New Delhi, India, pp. 379-391.
-
Van Soest PJ (1994) Nutritional Ecology of the Ruminant, 2nd21 edn Cornell University Press, Ithaca, New York.
-
Thornton PK, Kristjanson PM, Thorne PJ (2003) Measuring the potential impacts of improved food- feed crops: methods for ex ante assessment. Field Crop Res 84(1-2): 199-212.
-
Kristjanson P, Zerbini E (1999) Genetic enhancement of sorghum and millet residues fed to ruminants. An ex ante assessment of returns to research. ILRI Impact Assessment Series Number 3.ILRI, Nairobi, Kenya, 44 pp.
- Enhancement of Vegetative Growth and Fruit Yield in Cucumber (Cucumis sativus L.) via Spiritual Blessing (Biofield) Energy Intervention
- Production of Açaí (Euterpe oleracea Mart.) under Different Agroforestry System Management Intensities in Amazonian Floodplain (Varzea) Forests
- Coffee and the Production Region: What is the Secret to the Expression "Quality"?
- Experiential Agripreneurship Training in Sub-Saharan Africa: Integrating a Business Incubator into Postgraduate Livestock Education at the University of Buea
- Advances in Agricultural High-Quality Development
- Linking Compost Residue to ABAGE in Plants - a Short Note