Analysis of Genotype by Environment Interaction for Agronomic Traits of Bread Wheat (Triticum Aestivum L) Genotype in Ethiopia
The study of GEI has assumed great importance in genotype testing programs because yield performance of a genotype is a result of the interaction between the genotype and environment. The study cried out with objectives to determine the effect of genotype, environment, and GEI on agronomic traits and to identify stable genotype for specific adaptation. Fifteen bread wheat genotypes were evaluated by RCBD using four replications at six locations in Ethiopia. Combined analysis of variance showed very highly significant differences (P
Introduction
Bread wheat, a self-pollinating annual plant in the true grass family Gramineae is extensively grown as staple food sources in the world [1]. Wheat is an important and most widely cultivated food crop in the world and quantity produced is more than that of any other crop, feeding about 40% of the world population. This crop played a central role in combating hunger and improving the global food security. The grains of this plant provide about 20% of all calories and proteins consumed by people on the globe [2]. Bread wheat (Triticum aestivum L.) and durum wheat (T. Turgidum spp, durum L.) are the two major species of wheat cultivated in Ethiopia. Ethiopia is the first largest wheat producer in sub- Saharan Africa and wheat is one of the major crops among cereals. The current total area devoted to wheat production in Ethiopia is estimated to be over 1.6 million hectare (13% of national cereal acreage); fourth in area coverage and third in amount of grain production (4.2 million tons) following maize and teff [3].
Superior genotypes must be evaluated on the basis of multi-environment trials (MET) and multiple traits to ensure that the selected genotypes have acceptable performance in variable environments within the target region. For this reason, MET are conducted throughout the world for major crops every year in which multiple traits and characteristics are usually recorded [4]. Improvement of agronomic traits has been the primary objective of breeders/agronomists for many years under variable environments. Breeders have also measured and selected for grain yield and most related traits such as kernel weight, plant height, and other related traits [5]. All these traits are affected by the growing environment as well as by genetic factors, and numerous studies have described the genotype-by-environment (GE) interactions [6]. However, evaluation of genotypes across diverse environments and over several years is needed in order to identify spatially and temporally stable genotypes that could be recommended for release as new cultivars and/or for use in the breeding programs [7].
GEI refers to different ranking of genotypes across environments and may complement the selection process and recommendation of a genotype for a target environment [8]. It may also reduce the selection efficiency in different breeding programs because in a GEI, measured traits are less predictable and cannot be interpreted using main effects (genotype or environment) and need more analysis [9]. GEI is also one of the most important reasons for the failure or decreased efficiency of breeding efforts to serve small resource poor farmers in different areas [10]. Plant breeders perform multi- environment trials (MET) to select favourable genotypes based on both mean yield and performance stability and to determine whether a test environment is homogeneous should be divided into various mega-environments [8]. The main objectives of the present study were to determine the effect of genotype, environment, and GEI on agronomic traits and to identify stable genotype for specific adaptation.
Material and Methods
Experimental Materials and Design
Thirteen advanced bread wheat genotype and two recently released varieties were evaluated across six locations in 2017 / 2018 main cropping seasons. Description of test locations and wheat genotype is provided in Table 1 and Table 2, respectively.
| Geographic position | Temperature(oc) | Rainfall | ||||||||||||||||||||||||
|---|---|---|---|---|---|---|---|---|---|---|---|---|---|---|---|---|---|---|---|---|---|---|---|---|---|---|
| Location | Altitude | Soil pH | Soil type | |||||||||||||||||||||||
| Latitude | Longitude | Min | Max | (mm) | ||||||||||||||||||||||
| Kulumsa | 08o01'10"N | 39o09'11"E | 2200 | 6 | Luvisol | 10.5 | 22.8 | 820 | ||||||||||||||||||
| Asasa | 07o07'09"N | 39o11'50"E | 2000 | 6.5 | Gleysol | 5.8 | 24 | 620 | ||||||||||||||||||
| Dhera | 08o19'10"N | 39o19'13"E | 1650 | 7 | Andosol | 14 | 27.8 | 680 | ||||||||||||||||||
| Bekoji | 07o32'37"N | 39o15'21"E | 2780 | 5 | Nitosol | 7.9 | 18.6 | 1020 | ||||||||||||||||||
| Arsi Robe | 07o53'02"N | 39o37'40"E | 2420 | 5.6 | Vertisol | 6 | 21.1 | 890 | ||||||||||||||||||
| Holeta | NA | NA | 2400 | 5 | Nitosol | 6.2 | 22.1 | 1044 |
Table 1: Location and descriptions of weather condition for six locations.
The field experiment was laid out in RCBD with four replications. The experimental field plot was 6 rows of 2.5 m long with a 0.2 m inter-row spacing. Each plot was planted at a rate of 150 kg ha-1. The fertilizer application and other crop management practices were done as per recommendations of each test locations. Weeds grown in the plots were removed manually starting from two weeks after sowing.
| Name | Pedigree | ||||
|---|---|---|---|---|---|
| Lemu | WAXWING*2/HEILO | ||||
| ETBW8070 | Line 1 Singh/ETBW4919 | ||||
| ETBW8078 | Line 1 Singh/(Cham6/WW1402) | ||||
| ETBW8084 | Line 3 Singh/(Cham6/WW1402) | ||||
| ETBW8311 | ND643/2*WBLL1/3/KIRITATI//PRL/2*P ASTOR/4/KIRITATI//PBW65/2*SERI.1B | ||||
| ETBW8065 | Line 1 Singh/ETBW4919 | ||||
| ETBW8427 | SERI.1B//KAUZ/HEVO/3/AMAD/4/PYN/ BAU//MILAN/5/ICARDA-SRRL-1 | ||||
| ETBW8459 | CHIL-1//VEE'S'/SAKER'S' | ||||
| ETBW9037 | SWSR22T.B./2*BLOUK #1//WBLL1*2/KURUKU | ||||
| ETBW9045 | KINDE/4/CMH75A.66//H567.71/5*PVN/ 3/SERI | ||||
| ETBW8075 | Line 1 Singh/(Cham6/WW1402) | ||||
| ETBW9464 | MARCHOUCH*4/SAADA/3/2*FRET2/KUK UNA//FRET2*2/4/TRCH/SRTU//KACHU | ||||
| ETBW9466 | ATTILA/3*BCN//BAV92/3/TILHI/5/BAV 92/3/PRL/SARA//TSI/VEE#5/4/CROC_1/ AE.SQUARROSA(224)//2*OPATA*2/6/HU W234+LR34/PRINIA//UP2338*2/VIVITSI | ||||
| ETBW9470 | BAVIS#1/5/W15.92/4/PASTOR//HXL757 3/2*BAU/3/WBLL1 | ||||
| Hidasse | YANAC/3/PRL/SARA//TSI/VEE#5/4/CRO C-1/AE.SQUAROSA(224)//OPATTA |
Table 2: The names, pedigree and selection history of the genotypes were evaluated in the experiment in 2016/17 cropping season a
Data Collection
Data was collected on the following traits: days to heading, days to maturity, grain filling period, number of grains per spike, number of spikelet per spike, plant height, number of tiller per plant, spike length, biomass yield, TKW, HLW and grain yield per plot.
Statistical Analysis
The agronomic traits data for fifteen bread wheat in six environments were used to combine analysis of variance (ANOVA) to determine the effects of environment, genotype and GEI. Agronomic traits data was subjected to combined ANOVA and AMMI analysis. ANOVA was used to partition genotype deviations from the grand mean, environment deviations from the grand mean, and GE deviations from the grand mean. Subsequently, AMMI analysis was used to partition GE deviations into different interaction PC axes. Before combine the data Bartlett’s test was used to determine the homogeneity of variances between environments to determine the validity of the combined ANOVA on the data and the data collected was homogenous. The AMMI analysis was performed using the model suggested by Crossa, et al. as [11]:
𝑛 𝑌𝑖𝑗= 𝜇+ 𝐺𝑖+ 𝐸𝑗 + λnαin yjn + 𝑒𝑖𝑗𝑘 𝑛=1 Where 𝑌𝑖𝑗 is the yield of the 𝑖𝑡ℎ genotype in the 𝑗𝑡ℎ environment, μ is the grand mean, 𝐺𝑖 is the mean of the 𝑖𝑡ℎ genotype minus the grand mean, 𝐸𝑗 is the mean of the 𝑗𝑡ℎ environment minus the grand mean, λn is the square root of the Eigen value of the principal component analysis (PCA) axis αin and yjn are the principal component scores for PCA axis n of the 𝑖𝑡ℎ genotype and 𝑗𝑡ℎ environment and 𝑒𝑖𝑗𝑘 is the error term.
Result and Discussion
Combined Analysis of Variance for Agronomic Traits Over Locations
Combined ANOVA depicted highly significant differences among environments and among genotypes except for tillers plant-1 which were non-significant for the genotypes (Table 3). This indicated that agronomic traits of bread wheat were highly influenced by environmental factors. These results were in agreement with the works of Desalegn and Demelsah, et al. who reported high environmental variance for the agronomic traits [12, 13]. Mohamed and Ahmed and Melkamu, et al. reported that bread wheat grain yield was significantly affected by environment. It also showed the presence of high genetic variability among the tested genotypes and the inconsistency of their performance over the six locations [14, 15]. This agrees with finding of Temesgen, et al. who reported that genotype was highly significant difference for grain yield [16]. Similarly Melkamu, et al. reported that the bread wheat genotypes had a wider genetic variability for the entire traits [15]. The present study showed that non-significance difference in number of tiller per plant among tested genotypes. The results of the present study are agree with the findings of Khan who reported non-significant differences among bread wheat genotypes for number fertile tillers per plant in bread wheat [17]. The GxE interaction was also highly significant for all traits except for tiller number plant 1 (Table 3). This result is in agreement with the findings of Trakanovas and Ruzagas, and Temasgen, et al. who reported that the GEI was highly significant reflecting the differential response of genotypes in various environments [16, 18].
| Source of Variation | ||||||||||||||||||||||||||
|---|---|---|---|---|---|---|---|---|---|---|---|---|---|---|---|---|---|---|---|---|---|---|---|---|---|---|
| Traits | Gen(E) | PCA1 | PCA2 | CV% | ||||||||||||||||||||||
| Environment (5) | Genotype(14 | ) | GEI(70) | Error(267) | ||||||||||||||||||||||
| -18 | -18 | -16 | ||||||||||||||||||||||||
| GYLD | 43.51*** | 1.05 | 14.74*** | 2.75*** | 4.94*** | 3.45*** | 0.43 | 16.55 | ||||||||||||||||||
| PHT | 6281.53*** | 89.38 | 211.82*** | 75.67*** | 139.03*** | 110.77*** | 22.36 | 5.23 | ||||||||||||||||||
| TILL | 79.20*** | 3.7 | 0.98ns | 1.03ns | 1.33ns | 1.32ns | 0.95 | 19.04 | ||||||||||||||||||
| GNO | 1681.82*** | 145.56 | 92.37ns | 94.19*** | 217.15*** | 84.58** | 32.17 | 12.85 | ||||||||||||||||||
| BIO | 106.8*** | 2.4 | 2.51*** | 0.59*** | 1.54*** | 0.4* | 0.2 | 14.94 | ||||||||||||||||||
| HI | 0.65*** | 0.02 | 0.04*** | 0.01*** | 0.015*** | 0.017*** | 0.003 | 19.12 | ||||||||||||||||||
| TKW | 505.64*** | 11.38 | 295.19*** | 60.39*** | 91.84*** | 81.91*** | 7.88 | 8.06 | ||||||||||||||||||
| HLW | 648.09*** | 8.29 | 84.20*** | 19.9*** | 17.43*** | 10.1*** | 2.57 | 2.26 |
Table 3: Combined analysis of variance for agronomic traits.
***very highly significant p<0.001 ns= non-significant Where; PHT = plant height, GNO=grain per spike, TILL=number of tiller per plant, BIO=biomass yield, HI=harvest index, TKW= thousand kernel weight, HLW= hectolitre weight, GYLD= grain yield and CV= coefficient of variation. Table 3: Combined analysis of variance for agronomic traits.
The proportions of sum of squares of different components were determined for the 15 agronomic traits of bread wheat genotypes (Table 4). The environment contributed total treatment sum square 80-90% in PHT, TILL and BIO, 70-80% in HI. These traits were determined mainly by the environment. Other yield and yield components contributed 20-60% total sum square of environments. Genotype contributed less than 10% to total treatment sum square in all traits except in GYLD (33.46), HLW (20.4), TKW (38.0) and HI (12.9%). GxE contributed less than 10% to total treatment sum square in BIO. It contributed 10-20% in PHT, TILL and HI, 20- 30% in HLW, 30-40% in GYLD, TKW and GNO. G, E and GxE had similar effect on GYLD and TKW. Both G and GxE had moderate contribution to the determination of HI and HLW although the environment contributed more than 50% to total treatment sum square of these traits. GxE was more important in the determination of agronomic traits; its contribution was always higher than the contribution of the genotype.
| Traits | Genotype | Environment | GEI | PCA1% | PCA2% | ||||||||||||
|---|---|---|---|---|---|---|---|---|---|---|---|---|---|---|---|---|---|
| Grain yield | 33.46 | 35.28 | 31.45 | 46.1 | 28.6 | ||||||||||||
| Plant height | 7.5 | 79.2 | 13.4 | 47.25 | 33.46 | ||||||||||||
| Tiller number | 2.8 | 82.2 | 14.9 | 33.18 | 29.34 | ||||||||||||
| Grain per spike | 7.9 | 51.6 | 40.5 | 59.28 | 20.53 | ||||||||||||
| Biomass yield | 5.8 | 87.4 | 6.8 | 66.98 | 15.92 | ||||||||||||
| Harvest index | 12.9 | 71.5 | 15.6 | 39.39 | 39.15 | ||||||||||||
| Hectolitre weight | 20.4 | 56.1 | 23.5 | 44.88 | 23.1 | ||||||||||||
| Thousand kernel weight | 38 | 23.2 | 38.8 | 39.1 | 30.99 |
Table 4: Proportion of Total Treatment (G+E+GEI) contributed by G, E and GxE Interaction and PCA In Agronomic traits.
Mean Comparison in Grain Yield and Yield Components
Tested genotype showed variation for yield and yield components. High grain yield was harvested from the advanced genotype ETBW9470 followed by the advanced genotype ETBW8070 and Hiddase. The low yield was obtained from the genotype ETBW8075 only two advanced genotype were greater than the released varieties in grain yield across environments. These two advanced genotype ETBW9470 and ETBW8070 are recommended to be included in variety verification trials for further release. The advanced genotype ETBW8427 was the tallest genotype and ETBW8078 was found to be the shortest plant height (Table 5). The maximum fertile tiller number were obtained from advanced genotype ETBW8070 and minimum tiller number was obtained from the advanced genotype ETBW9464 (Table 5). With regard to tiller number about 53.33% of the genotypes exceeded the overall mean (5.11 tiller plant-1) of the genotypes while, advanced genotypes exceeded 40% and 80% of the released variety Lemu and Hidasse respectively. Similar results were reported by several investigators [12, 19, 20]. These authors reported the presence of highly significant variation among the studied wheat genotypes for plant height.
yield over the location and ETBW8075 had low biomass yield. The present study result shows that biomass yield for most of the studied characters were >3.1 indicating genotypes had high yield. With regard to biomass yield about 53.33% of the genotypes exceeded the overall mean (3.01 kg plot-1) of the genotypes while, genotypes exceeded 13.33% and 26.66% of the released variety Lemu and Hidasse respectively. Accordingly, there is plenty of variability among the genotypes for selection designed for improvement of this trait. This finding is in agreement with Mollasadeghi, et al. which stated the existence of variability for biomass yield among bread wheat genotypes [23]. Harvest index exhibited significant difference among genotypes having the range of 0.15 to 0.33 with a mean value of 0.28. Demelash, et al. reported highly significant differences among bread wheat varieties for harvest index with the range of 0.31-0.45 [13]. Maximum harvest index was observed for ETBW9470, while minimum harvest index noticed for ETBW8075 (Table 5). In this result the genotype that had highest harvest index had high grain yield over locations while, genotype that had low harvest index had low grain yield. The present study result shows that harvest index for most of the studied characters were >0.28 indicating genotypes had high yield.
Advance genotypes ETBW9037 had high number of grain per spike and ETBW8075 had low mean number of grains spike-1 over locations (Table 5). This study genotype showed high variability in the number of grains per spike. These result was in agreement with those obtained by who investigated that genotype showed high variability in the number of grains per spike in wheat [21, 22]. Advanced genotype ETBW8070 had high biomass
| Genotype | PHT | TILL | GNO | BIO | HI | HLW | TKW | GYLD | ||||||||||||||||||
|---|---|---|---|---|---|---|---|---|---|---|---|---|---|---|---|---|---|---|---|---|---|---|---|---|---|---|
| Lemu | 91.97a-c | 5.1abc | 44.59bc | 3.28bc | 0.28c-f | 69.62d-f | 31.93e | 3.93b-d | ||||||||||||||||||
| ETBW8070 | 92.39a-c | 5.4a | 45.84a-c | 3.62a | 0.28c-f | 73.38ab | 35.45b-e | 4.60ab | ||||||||||||||||||
| ETBW8078 | 86.08e | 5.1abc | 42.9b-d | 3.07c-f | 0.24g | 69.75de | 33.82de | 3.39cd | ||||||||||||||||||
| ETBW8084 | 87.56e | 5.2abc | 45.36a-c | 3.17b-e | 0.27de-g | 70.18c-e | 35.71b-e | 4.05a-d | ||||||||||||||||||
| ETBW8311 | 87.12e | 5.3ab | 44.4bc | 2.73gh | 0.26e-g | 70.62b-e | 31.4ef | 3.11d | ||||||||||||||||||
| ETBW8065 | 88.04e | 4.82bc | 43.39b-d | 3.35ab | 0.25fg | 73.02ab | 34.56e | 3.91b-d | ||||||||||||||||||
| ETBW8427 | 94.62a | 5.1abc | 42.76cd | 3.1c-f | 0.31a-c | 72.69a-c | 39.22ab | 4.16a-c | ||||||||||||||||||
| ETBW8459 | 91.06cd | 5.0abc | 44.54bc | 2.77gh | 0.28c-f | 71.13a-e | 33.18e | 3.45cd | ||||||||||||||||||
| ETBW9037 | 91.26b-d | 5.3ab | 48.4a | 2.95e-g | 0.32ab | 72.04a-d | 35.32b-e | 4.11a-c | ||||||||||||||||||
| ETBW9045 | 94.06ab | 5.26ab | 43.68bc | 2.85f-h | 0.3abc | 73.56a | 38.66a-c | 3.90b-d | ||||||||||||||||||
| ETBW8075 | 86.76e | 5.13abc | 39.94d | 2.31i | 0.15h | 67.06f | 27.32f | 1.53e | ||||||||||||||||||
| ETBW9464 | 94.15ab | 4.65c | 42.5cd | 2.67h | 0.29b-e | 66.58ef | 34.7c-e | 3.35cd | ||||||||||||||||||
| ETBW9466 | 88.93de | 5.12abc | 46.52ab | 3.0d-g | 0.3a-d | 69.73de | 31.93e | 3.91b-d | ||||||||||||||||||
| ETBW9470 | 88.74de | 5.22abc | 43.17b-d | 3.27b-d | 0.33a | 70.31a-e | 40.89a | 4.93a | ||||||||||||||||||
| Hidasse | 93.48a-c | 4.86abc | 44.21bc | 3.16b-e | 0.29a-d | 69.76de | 38.21a-d | 4.29a-c | ||||||||||||||||||
| Mean | 90.41 | 5.11 | 44.16 | 3.02 | 0.28 | 70.56 | 35.07 | 3.77 | ||||||||||||||||||
| LSD0.5 | 2.91 | 0.57 | 3.6 | 0.28 | 0.03 | 2.71 | 4.47 |
Table 5: Mean values of agronomic traits of bread wheat genotypes tested across six locations.
Values with the same letter in a column are not significantly different Where; NSPPSP=number of spikelet per spike, NGPPL= grain per spike, BIO=biomass yield , HI=harvest index, TKW= thousand kernel weight, HLW= hectolitre, GYLD= grain yield and LSD%= Least Significant Difference Table 5: Mean values of agronomic traits of bread wheat genotypes tested across six locations.
Difference between Environments
When locations were compared, the highest mean grain yield (5.15 t/ha) was obtained at Kulumsa, and the lowest (2.86 t ha-1) was obtained from Bekoji. Arsi robe (3.32 t/ha) and Dhera (3.17 t/ha) were also poor yielding locations (Table 6). The grain yield obtained from Bekoji, Dhera, Arsi Robe were below the overall location mean grain yield (3.77 t/ha), whereas the grain yield of genotypes at Kulumsa, Asasa and Holeta were better than that at Bekoji, Dhera, Arsi Robe (Table 6). Highest plant height was recorded at Asasa, and the lowest at Dhera. Obtained values of plant height indicated that environment had higher influence than genotype on expression of plant height. Fertile tiller numbers were high at Bekoji, while low at Arsi Robe. Genotype had highest average value of biomass yield at Kulumsa when compared with other five locations and lowest at Arsi Robe. The highest harvest index was obtained from Arsi Robe, while lowest obtained from Asasa. The highest hectolitre weight was obtained from Holeta and lowest one was obtained from Asasa. The highest TKW was obtained from Arsi Robe, while the lowest obtained from Asasa (Table 6).
| Traits | Kulumsa | Asasa | Dhera | Bekoji | A.Robe | Holeta | Mean | LSD | ||||||||||||||||||
|---|---|---|---|---|---|---|---|---|---|---|---|---|---|---|---|---|---|---|---|---|---|---|---|---|---|---|
| PHT | 96.74ab | 97.94a | 70.56e | 95.8b | 92.03c | 89.42d | 90.42 | 3.63 | ||||||||||||||||||
| TILL | 4.32d | 5.97b | 5.08c | 6.97a | 4.21d | 4.13d | 5.11 | 0.57 | ||||||||||||||||||
| NGPPL | 48.36ab | 49.61a | 36.46e | 46.92ab | 39.1d | 44.5b | 44.16 | 4.63 | ||||||||||||||||||
| BIO | 4.92a | 4.35b | 2.74c | 2.27d | 1.43e | 2.43d | 3.02 | 0.4 | ||||||||||||||||||
| HI | 0.21cd | 0.20d | 0.24cd | 0.25c | 0.48a | 0.31b | 0.28 | 0.05 | ||||||||||||||||||
| HLW | 70.90c | 66.42e | 70.04 | 69.51cd | 72.64b | 76.13a | 70.67 | 1.14 | ||||||||||||||||||
| TKW | 36.64b | 30.89e | 34.89c | 35.14c | 38.97a | 32.37d | 34.82 | 1.29 | ||||||||||||||||||
| GYLD | 5.15a | 4.33b | 3.17de | 2.86e | 3.32d | 3.82c | 3.77 | 0.39 |
Table 6: Mean values of agronomic traits of six locations.
Values with the same letter in a column are not significantly different. Where; PHT=plant height, GNO= grain per spike, TILL=number of tiller per plant, BIO=biomass yield, HI=harvest index, TKW= thousand kernel weight, HLW= hectolitre, GYLD= grain yield Table 6: Mean values of agronomic traits of six locations.
Ammi Analysis
The results of AMM model for yield and yield components are presented in Table 3. As it can be seen from the table, the mean square of the two IPCA were highly significant (p<0.001). AMMI multiplicative component further partitioned the GE interaction into five interaction principal component axes (IPCAs). However, only the first two axes showed significant contribution to the GEI in the AMMI model (Table 3). The remaining three principal components contributed insignificant portion of the variation. The AMMI biplot, which accounted for 80.71 PHT, 65.52 TILL, 78.81 GNO, 82.9 BIO, 78.53 HI, 70.1 TKW, 68 HLW and 74.7% GYLD of the GxE interaction, provides the interaction principal component scores of the 1st and 2nd IPCA with 34 degrees of freedom.
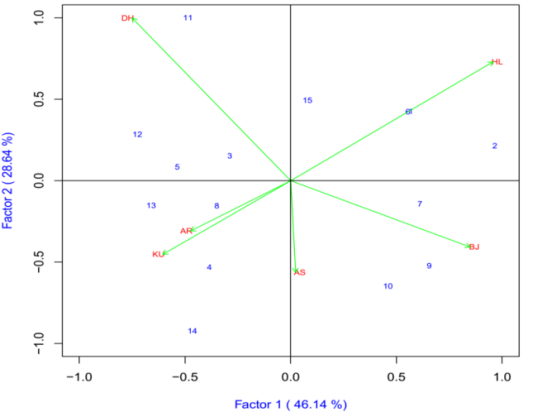
Grain Yield
The IPCA1 was plotted on x-axis whereas IPCA2 was plotted on y-axis for grain yield and yield components (Figure 8). AMMI2 analysis positioned the genotypes in different locations, indicating the interaction pattern of the genotypes. The AMMI analysis for the IPCA1 captured 46.1% and the IPCA2 explained 28.6% and the two IPCs cumulatively captured 74.7% of the sum of square the GEI of bread wheat genotypes (Table 4). There is a good variation in the different environments. Holeta (HL), Bekoji (BJ) and Dhera (DH) were the most discriminating environments as indicated by the long distance between their marker and the origin (Figure 8). Closer relationships were observed between Kulumsa (KU), Arsi Robe (AR) and Asasa (AS). Genotypes ETBW8075 (#11), ETBW8070 (#2) and ETBW9470 (#14) were unstable as they were located far apart from the other genotypes in the biplot when plotted on the IPCA1 and IPCA2 scores. The ETBW8078 (#3), ETBW8459 (#8) and Hidase (#15) were genotype located near to the origin of the biplot which implies that they were stable bread wheat genotypes across environments. The genotype ETBW8070 (#2) positively interact at Bekoji and Holeta. This two location are highland wheat production locations. The genotype with highest positive interaction with location Kulumsa (KU) was ETBW9470 (#14); ETBW8075 (#11) interacted positively with Dhera (DH), while ETBW8070 (#2) had high interaction with Holeta (HL) while ETBW9466 (#13) was the best genotype for Arsi Robe (AR) (Figure 8).
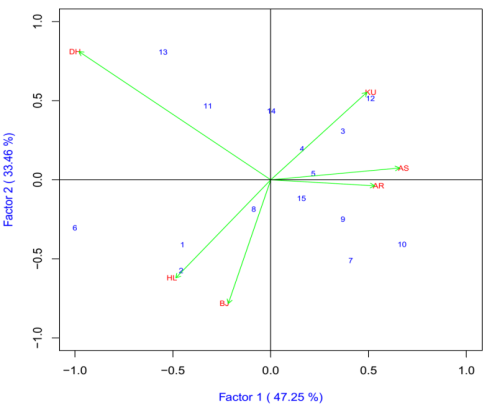
Plant Height
The IPCA1 was plotted on x-axis whereas IPCA2 was plotted on y-axis for grain yield and yield components (Figure 1). The AMMI analysis for the IPCA1 captured 47.25% and the IPCA2 explained 33.46% and the two IPCs cumulatively captured 80.71% of the sum of square the GEI of bread wheat genotypes. Genotypes ETBW9466(#13), ETBW8065(#6), ETBW8070(#2), ETBW4427(#7), ETBW9045(#10) and ETBW9464(#12), were unstable as they were located far apart from the other genotypes in the biplot when plotted on the IPCA1 and IPCA2 scores. The ETBW8311 (#5), ETBW8459 (#8) and Hidase (#15) were genotype located near to the origin of the biplot which implies that they were stable bread wheat genotypes across environments. The genotype ETBW9466 (#13), positively interact at Bekoji (BJ). The genotype with highest positive interaction with location Arsi Robe (AR) and Dhera (DH) was ETBW8070 (#2); ETBW9464(#12), interacted positively with Holeta(HL) while ETBW8311 (#5) had high interaction with Kulumsa (KU) and Asasa(AS) while ETBW9466 (#13) was the best genotype for Arsi Robe (AR) (Figure 1).
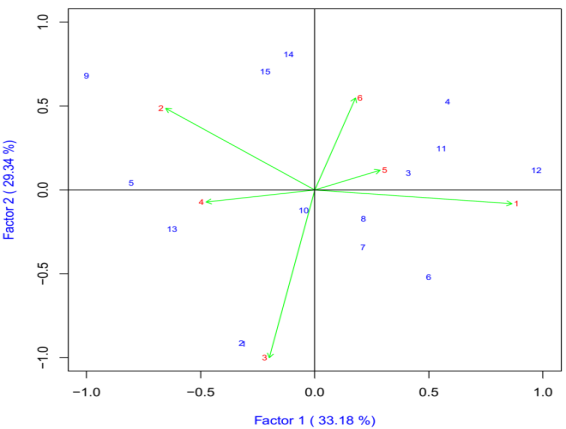
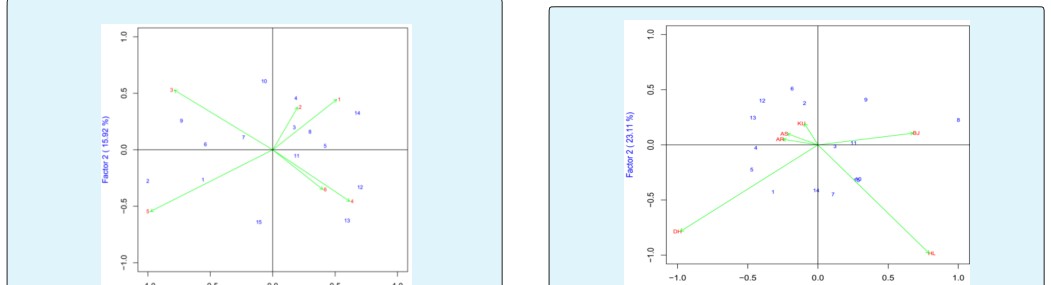
Tiller Number
The IPCA1 was plotted on x-axis whereas IPCA2 was plotted on y-axis for grain yield and yield components (Figure 2). AMMI2 analysis positioned the genotypes in different locations, indicating the interaction pattern of the genotypes. The AMMI analysis for the IPCA1 captured 33.18% and the IPCA2 explained 29.34% and the two IPCs cumulatively captured 65.52% of the sum of square the GEI of bread wheat genotypes. Genotypes ETBW9464(#12), ETBW8070 (#2), Lemu(#1) ETBW9037(#9), ETBW9470 (#14) and Hiddase (#15) were unstable as they were located far apart from the other genotypes in the biplot when plotted on the IPCA1 and IPCA2 scores. The ETBW9045 (#10), ETBW8459 (#8) and ETBW8070(#3) were genotype located near to the origin of the biplot which implies that they were stable bread wheat genotypes across environments (Figure 2).
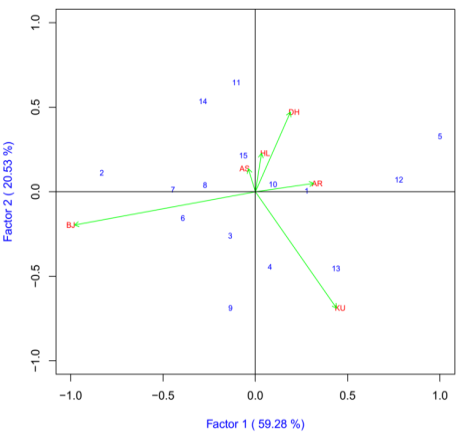
Grain per Spike
The IPCA1 was plotted on x-axis whereas IPCA2 was plotted on y-axis for grain yield and yield components (Figure 3). AMMI2 analysis positioned the genotypes in different locations, indicating the interaction pattern of the genotypes. The AMMI analysis for the IPCA1 captured 59.28% and the IPCA2 explained 20.53% and the two IPCs cumulatively captured 78.81% of the sum of square the GEI of bread wheat genotypes. There is a good variation in the different environments. Holeta (HL), Bekoji (BJ) and Dhera (DH) were the most discriminating environments as indicated by the long distance between their marker and the origin (Figure 8). Kulumsa (KU), Arsi Robe (AR) and Asasa (AS) were least discriminating environments. Genotypes ETBW8075 (#11), ETBW8070 (#2), ETBW9470 (#14), ETBE9037(#9), ETBW9466 (#13) and ETBW8311(#5) were unstable as they were located far apart from the other genotypes in the biplot when plotted on the IPCA1 and IPCA2 scores. The ETBW9045 (#10) and Lemu(#1) were genotype located near to the origin of the biplot which implies that they were stable bread wheat genotypes across environments (Figure 3).
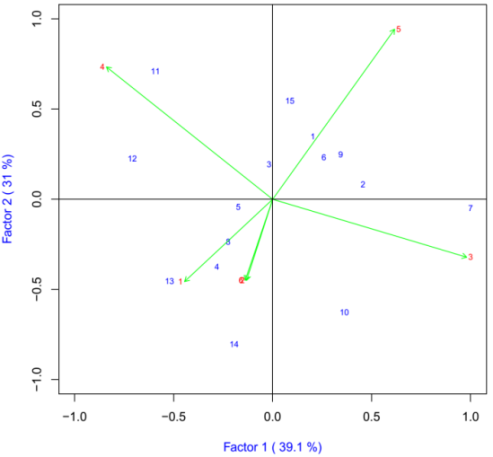
Biomass Yield
The IPCA1 was plotted on x-axis whereas IPCA2 was plotted on y-axis for grain yield and yield components (Figure 4). AMMI2 analysis positioned the genotypes in different locations, indicating the interaction pattern of the genotypes. The AMMI analysis for the IPCA1 captured 66.98% and the IPCA2 explained 15.92% and the two IPCs cumulatively captured 82.9% of the sum of square the GEI of bread wheat genotypes. There is a good variation in the different environments. Genotypes ETBW9464(#12), ETBW8070 (#2) , ETBW9037(#9) and ETBW9470 (#14) were unstable as they were located far apart from the other genotypes in the biplot when plotted on the IPCA1 and IPCA2 scores. The ETBW9045 (#10), Hidase (#15), ETBW8078 (#3), ETBW8084(#4) and ETBW8427(#7) were genotype located near to the origin of the biplot which implies that they were stable bread wheat genotypes across environments (Table 4).
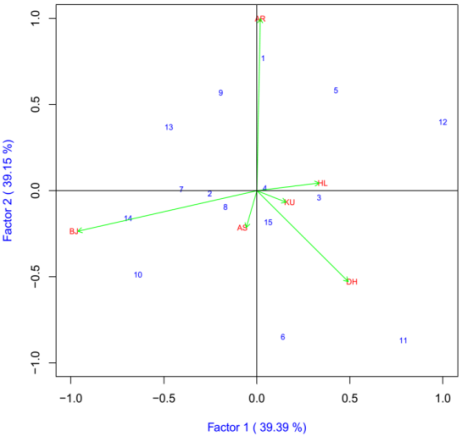
Harvest Index
The IPCA1 was plotted on x-axis whereas IPCA2 was plotted on y-axis for grain yield and yield components (Figure 5). AMMI2 analysis positioned the genotypes in different locations, indicating the interaction pattern of the genotypes. The AMMI analysis for the IPCA1 captured 39.39% and the IPCA2 explained 39.15% and the two IPCs cumulatively captured 78.53% of the sum of square the GEI of bread wheat genotypes. There is a good variation in the different environments. Arsi Robe (AR), Bekoji (BJ) and Dhera (DH) were the most discriminating environments as indicated by the long distance between their marker and the origin (Figure 5). Kulumsa (KU), Holeta (HL) and Asasa (AS) were least discriminating environments. Genotypes ETBW8075 (#11), ETBW8065 (#6), ETBW9464(#12), and Lemu(#1) were unstable as they were located far apart from the other genotypes in the biplot when plotted on the IPCA1 and IPCA2 scores. The ETBW8084(#4), ETBW8459 (#8) and Hidase (#15)
were genotype located near to the origin of the biplot which implies that they were stable bread wheat genotypes across environments. The genotype ETBW9470(#14) positively interact at Bekoji. The genotype with highest positive interaction with location Kulumsa (AR) was Lemu (#1); ETBW8075 (#11) interacted positively with Dhera (DH), while ETBW8078(#3) had high interaction with Holeta (HL) while Hiddase (#15) was the best genotype for Asasa(AS) and Kulumsa (KU) (Figure 5).
Thousand Kernel Weight
The IPCA1 was plotted on x-axis whereas IPCA2 was plotted on y-axis for grain yield and yield components (Figure 6). AMMI2 analysis positioned the genotypes in different locations, indicating the interaction pattern of the genotypes. The AMMI analysis for the IPCA1 captured 39.1% and the IPCA2 explained 30.99% and the two IPCs cumulatively captured 70.1% of the sum of square the GEI of bread wheat genotypes. There is a good variation in the different environments. Arsi Robe (5), Bekoji (4) and Dhera (3) were the most discriminating environments as indicated by the long distance between their marker and the origin (Figure 6). Closer relationships were observed between Holeta (6) and Asasa (2). Genotypes ETBW8075 (#11), ETBW9466 (#13), ETBW9470 (#14) and ETBW8427(#7) were unstable as they were located far apart from the other genotypes in the biplot when plotted on the IPCA1 and IPCA2 scores. The ETBW8078 (#3) and ETBW8311 (#5) were genotype located near to the origin of the biplot which implies that they were stable bread wheat genotypes across environments (Figure 6).
Hectolitre Weight
The IPCA1 was plotted on x-axis whereas IPCA2 was plotted on y-axis for grain yield and yield components (Figure 7). AMMI2 analysis positioned the genotypes in different locations, indicating the interaction pattern of the genotypes. The AMMI analysis for the IPCA1 captured 44.88% and the IPCA2 explained 23.1% and the two IPCs cumulatively captured 68% of the sum of square the GEI of bread wheat genotypes. There is a good variation in the different environments. Holeta (HL), Bekoji (BJ) and Dhera (DH) were the most discriminating environments as indicated by the long distance between their marker and the origin (Figure 7). Closer relationships were observed between Kulumsa (KU), Arsi Robe (AR) and Asasa (AS). Genotypes ETBW8459 (#8), ETBW8065 (#6), ETBW9466(#13) and ETBW9464 (#12) were unstable as they were located far apart from the other genotypes in the biplot when plotted on the IPCA1 and IPCA2 scores. The ETBW8078 (#3) and ETBW8075 (#11) were genotype located near to the origin of the biplot which
implies that they were stable bread wheat genotypes
across environments (Figure 7).
Figure of AMMI 2 Biplot of IPCA 1 against IPCA 2 for
agronomic traits of 15 bread wheat genotypes tested
across six locations are listed below. For all figure where;
1=Lemu, 2=ETBW8070, 3=ETBW8078, 4=ETBW8084,
$$ \begin{array}{l l l} 5 = E T B W 8 3 1 1, & 6 = E T B W 8 0 6 5, & 7 = E T B W 8 4 2 7, \\ 8 = E T B W 8 4 5 9, & 9 = E T B W 9 0 3 7, & 1 0 = E T B W 9 0 4 5, \end{array} $$
11=ETBW8075, 12=ETBW9464, 13=ETBW9466, 14=
ETBW9470, 15=Hidasse.
HLW of 15 bread wheat genotypes tested across six
$$ l o c a t i o n s \quad (A R = A r s i \quad R o b e, \quad A S = A s a s a, \quad B J = B e k o j i, $$
DR=Dhera, HL=Holeta and KU=Kulumsa).
Conclusion
Genotype × environmental interaction is an important consideration in plant breeding programs because it reduces the progress from selection in any one environment. Crop breeders have been striving to develop genotypes with superior grain yield and yield components over a wide range of different environmental conditions. The Genotype main effect was not significant for grain per spike and tiller number. The significant GEI indicated that performance of the genotypes in agronomic was not consistent over environments; some genotypes performed well at some locations but poorly at other locations. The environment contributed total treatment sum square 80-90% in PHT, TILL and BIO, 70-80% in HI. These traits were determined mainly by the environment. Other yield and yield components contributed 20-60% total sum square of environments. Genotype contributed less than 10% to total treatment sum square in all traits except in GYLD (33.46), HLW (20.4), TKW (38.0) and HI (12.9%). GxE contributed less than 10% to total treatment sum square in BIO. It contributed 10-20% in PHT, TILL and HI, 20-30% in HLW, 30-40% in GYLD, TKW and GNO. The biplot of AMMI revealed clear insight into the specific and general adaptation of genotypes across locations. The AMMI biplot, which accounted for 80.71 PHT, 65.52 TILL, 78.81 GNO, 82.9 BIO, 78.53 HI, 70.1 TKW, 68 HLW and 74.7% GYLD of the GxE interaction, provides the interaction principal component scores of the 1st and 2nd IPCA. High grain yield was harvested from the advanced genotype ETBW9470 and lowest from ETBW8075. The advanced genotype ETBW8427 was the tallest genotype and ETBW8078 was found to be the shortest plant height. The maximum fertile tiller numbers were obtained from advanced genotype ETBW8070 and minimum tiller number was obtained from the advanced genotype ETBW9464. Advance genotypes ETBW9037 had high number of grain per spike and ETBW8075 had low mean number of grains spike-1 over locations. Advanced genotype ETBW8070 had high biomass yield over the location and ETBW8075 had low biomass yield. Maximum harvest index was observed for ETBW9470, while minimum harvest index noticed for ETBW8075.
Acknowledgment
The authors would like to acknowledge the financial support provided by Delivering Genetic Gain in Wheat (DGGW) Project and Ethiopian Agricultural Research Institute for conducting the field trials. The authors also would like to acknowledge Kulumsa Agricultural Research Centre for the support in facilitating the field work and allocating the required labour and materials for field work and National wheat breeding program staff for all the assistance.
References
-
Mollasadeghi V, Shahryari R (2011) Important morphological markers for improvement of yield in bread wheat. Advances Environ Biol 5(3): 538-542.
-
Shiferaw B, Smale M, Braun HJ, Duveiller E, Reynolds M, et al. (2013) Crops that feed the world 10. Past successes and future challenges to the role played by wheat in global food security. Food Security 5(3): 291-317.
-
CSA (Central Statistical Agency) (2014) Report on Area and Crop Production forecast for Major Crops (for private Peasant Holdings ’Meher’ season). Addis Ababa, Ethiopia.
-
Yan W, Rajcan I (2002) Biplot analysis of test sites and trait relations of soybean in Ontario. Crop Science 42(1): 11-20.
-
Maman N, Mason SC, Lyon DJ, Dhungana P (2004) Yield components of pearl millet and grain sorghum across environments in the Central Great Plains. Crop Sci 44: 2138-2145.
-
Doehlert DC, McMullen MS, Hammond JJ (2001) Genotypic and environmental effects on grain yield and quality of oat grown in North Dakota. Crop Sci 41(4): 1066-1072.
-
Sharma RC, Morgounov AI, Braun HJ, Akin B, Keser M, et al. (2010) Identifying high yielding stable winter wheat genotypes for irrigated environments in Central and West Asia. Euphytica 171(1): 53-64.
-
Gauch HG (2006) Winning the accuracy game. American Sci 94: 133-141.
-
Gauch HG, Piepho HP, Annicchiarico P (2008) Statistical analysis of yield trials by AMMI and GGE: further considerations. Crop Sci 48: 866-889.
-
Mitrovic B, Stanisavljevi D, Treski S, Stojakovic M, Ivanovic M, et al. (2012) Evaluation of experimental Maize hybrids tested in Multi-location trials using AMMI and GGE biplot analysis. Turkish J Field Crops 17(1): 35-40.
-
Crossa J, Gauch HG, Zobel RW (1990) Additive main effects and multiplicative interaction analysis of two international maize cultivar trials. Crop science 30(3): 493-500.
-
Desalegn Regasa (2012) Genotype-Environment interaction and disease severity in bread wheat (Triticum aestivum L.) varieties in Borena and Guji Zone southern Ethiopia. An MSc Thesis Presented to the School of Graduate Studies of Haramaya University, Ethiopia.
-
Demelash AL, Desalegn T, Alemayehu G (2013) Genetic variation of bread wheat (Triticum aestivum L.) genotypes based on number of phonological and morphological traits at Marwold Kebele, Womberma Woreda, West Gojam. Wudpecker Journal of Agricultural Research 2(6): 160-166.
-
Mohamed NE, Ahmed AA (2013) Additive main effects and multiplicative interaction and GGE biplot analysis of genotype × environment interactions for grain yield in bread wheat (Triticum aestivum L.). African Journal of Agricultural Research 8(42): 5197- 5203.
-
Temesgen M, Alamerew S, Eticha F (2015) GGE Biplot Analysis of Genotype by Environment Interaction and Grain Yield Stability of Bread Wheat Genotypes in South East Ethiopia. World Journal of Agricultural Sciences 11(4): 183-190.
-
Bacha T, Alemiraw S, Tadesse Z (2015) Genotype X Environment Interaction and Yield Stabliity of Bread Wheat (Triticum Eastivum L.) Genotype in Ethiopia using the Ammi Analisis. Journal of Biology, Agriculture and Healthcare 5(11).
-
Khan MAU, Mohammad F (2018) Effect of genotype × environment interaction on grain yield determinants in bread wheat. Sarhad Journal of Agriculture 34(1): 54-62.
-
Tarakanovas P, Ruzgas V (2006) Additive main effect and multiplicative interaction analysis of grain yield of wheat varieties in Lithuania. Agronomy research 4(1): 91-98.
-
Degewione A, Dejene T, Sharif M (2013) Genetic variability and traits association in bread wheat (Triticum aestivum L.) genotypes. International Research Journal of Agricultural Sciences 1(2): 19-29.
-
Wani B, Ram M, Yasin A, Ali M, Pandith A, et al. (2013) Seedling vigour in wheat (Triticum aestivum L.) as a source of genetic variation and study of its correlation with yield and yield components. African Journal of Agricultural Research 8(4): 370-372.
-
Ali Y, Atta BM, Akhter J, Monneveux P, Lateef Z (2008) Genetic variability, association and diversity studies in wheat (Triticum aestivum L.) germplasm. Pak J Bot 40: 2087-2097.
-
Zecevic V, Knezevic D, Boskovic J, Micanovic D, Dozet G (2010) Effect of nitrogen fertilization on winter wheat quality. Cereal Res Commun 38(2): 244-250.
-
Mollasadeghi V, Elyasi S, Mirzamasoumzadeh B (2012) Genetic variation of 12 bread wheat genotypes based on number of phonological and morphological traits. Annals of Biological Research. 3(10): 4734-4740.
- Enhancement of Vegetative Growth and Fruit Yield in Cucumber (Cucumis sativus L.) via Spiritual Blessing (Biofield) Energy Intervention
- Production of Açaí (Euterpe oleracea Mart.) under Different Agroforestry System Management Intensities in Amazonian Floodplain (Varzea) Forests
- Coffee and the Production Region: What is the Secret to the Expression "Quality"?
- Experiential Agripreneurship Training in Sub-Saharan Africa: Integrating a Business Incubator into Postgraduate Livestock Education at the University of Buea
- Advances in Agricultural High-Quality Development
- Linking Compost Residue to ABAGE in Plants - a Short Note