The Impact of Agricultural Technology Adoption on Poverty: The Case of Yam Minisetts Technology in Ekiti State, Nigeria
This study evaluates the impact of adopting yam minisetts technology on poverty among yam farming households in Ekiti state, Nigeria. This study utilizes cross-sectional data from 600 households, collected in 2016, from twelve communities. This study examined the socio-economic characteristics of yam farmers, determined the poverty profile of yam minisetts technology adopters and non-adopters and it further examined the effect of yam minisetts technology on poverty reduction among yam farming households using descriptive statistics, Propensity Score Matching (PSM) and Foster-Greer- Thorbecke (FGT). We find that the poverty incidence (P0) was 0.5642; poverty gap (P1) was 0.3173 while the poverty severity (P2) was 0.2131. The results of the Propensity Score Matching (PSM) indicated that adoption of yam minisett technology had a positive and significant (P=0.05) effect on consumption expenditure and also indicated that the adopters were less likely to be poor by about 6.8% - 91.9% across the ATT estimator. Thus, has the power to lift the poor farmers above the poverty line. This study supports agricultural development programmes for farmers in order to effectively reduce hunger and poverty. Provision of farm inputs and improved seed varieties to the farmers at subsidized rate in order to stimulate adoption.
Introduction
Yam (Dioscorea spp) is an important food crop especially in the yam zones of West Africa, comprising Cameroon, Nigeria, Benin, Togo, Ghana and Cote d’ Ivories. This zone produces more than 90% of the total world production which is estimated at about 20 – 25million tons per year [1]. Nigeria is the main producer of yam in the world with about 71- 75% of the world output followed by Ghana, Cote d’ Ivoire, Benin and Togo. Annual production of yam in the country is estimated at 26.587 million metric tons [2].
Despite the importance of yam, its production in Nigeria has not been accorded the needed attention [3]. This is reflected in the fall in output percentage growth rate of yam from 42% in 1990 to 16.3% in 2001 despite the increase in land devoted for the production of the crop from 1270 million hectares to 2742 million hectares in the same period [4]. International Institute of Tropical Agricultural (IITA) reported that there has been a general decline in yam production in Nigeria over years. This is reflected in decline in areas under yam cultivation and total yam output. Yam production in Nigeria is faced with a number of constraints. Paramount among these constraints is pest and disease attack, lack of adoption of the required seed yam for more yam production, its reoccurring scarcity and high cost during planting season. Since increased productivity is directly proportional to production efficiency, it is imperative to raise productivity of the farmers by helping them adopt new improved technology. Furthermore, in Nigeria, due to rise in population, the demand for agricultural products is continually rising. This has resulted in the need to adopt the improved yam sett technology.
Poverty is the main development problem confronting the world and agricultural growth is seen as a best-bet strategy for poverty reduction. In DFID it is estimated that a 1 percent increase in agricultural productivity reduces the percentage of poor people living on less than 1 dollar a day by between 0.6 and 2 percent and no other economic activity generates the same benefit for the poor [5]. The direct effects of technology on poverty reduction include productivity gains and lower per unit costs of production, which can raise incomes of producers that adopt technology. There are also a number of indirect benefits from technology adoption: depending on the elasticity of demand, outward shifts in supply can lower food prices; and increased productivity may stimulate the demand for labour. There is a rapidly growing literature evaluating the impact of anti- poverty programs in using experimental and non-experimental methods that deal appropriately with the self-selection problems. However, few of these studies have focused on assessing the impact of technology adoption on rural poverty. Notable exceptions include a study by Mendola on the impact of technology adoption on poverty in Bangladesh who uses the propensity-score matching (PSM) method to deal with the self-selection bias problem and estimates the average treatment effect (ATE) of adoption of high yielding rice varieties on income [6]. The ability of the farmer to obtain optimum yields and to reduce poverty depends on their control of inputs of land, labour, adoption of improved technology, fertilizer and their access to extension services. There are many important theoretical reasons why agricultural technology might improve farm household wellbeing, but how can we be sure that the better wellbeing of adopters compared to non-adopters is caused by technology adoption or not? The question for Ekiti State remains, however, that, has technological adoption improved the households’ welfare or it has been inadequately utilized and wrongly applied to an extent that no gain in welfare has been recorded. Therefore, there has been a longstanding interest in evaluating the impact of improved technologies on food security and poverty reduction among farmers in Nigeria.
Based on the foregoing, the general objective of this study is to evaluate the effect of yam minisetts technology on poverty reduction among yam-based farming households in Ekiti state, Nigeria. The specific objectives of the study are to:
- Investigate the socio-economic characteristics of yam- based farmers in the study area.
- determine the poverty profile of yam minisetts technology adopters and non-adopters in the study area
- examine the impact of yam minisetts technology on poverty alleviation/reduction among yam-based farming households in the study area
Methods
Data Sources
Researchers in Nigeria of the National Root Crops Research Institute (NRCRI), Umudike, and IITA, Ibadan, developed the minisett technique to overcome the critical problem of the unavailability of good quality seed yam by improving the rate of multiplication of white yam [7]. With the technique, the multiplication ratio can increase from the traditional 1:5 to 1:30 [8]. The study used primary data collected from a cross-sectional survey of yam farmers from Ekiti State with the aid of a structured questionnaire. The survey collected valuable information on several factors including household composition and characteristic, revenue and cost of operation of yam production. The revenue(sales from yam output)in naira, while cost of operation include: quantity and cost of inputs (yam minisetts(kg), labour(man-days), fertilizer(kg), land and non-land farm assets, yam production cost and socio-economic characteristics of the farmers in the study area (education, experience and family size). Also data were collected on general socioeconomic characteristics of respondents, which include age, gender, marital status, household size, educational level, major occupation, secondary occupations, farming experience, number of land assets owned and cultivated, residency type, and membership of association. In addition, information on the sources of income and food consumption expenditure were collected.
Sampling Procedure
A multi-stage sampling technique was used for this study. In the first stage, three Local Government Areas (LGAs) where yams are predominantly grown were purposively chosen (Gbonyin, Ijero and Efon local government). In the second stage, four largest yam producing communities were purposively selected from each LGA, resulting to the selection of 12 communities for the study. Then, farmers in the selected communities were stratified into adopters and non adopters of yam minisetts technology. The last stage was the random selection of 50 yam farmers from each of the 12 communities, giving a sample size of 600 yam farmers (300 from adopters and 300 from non adopters). For the analysis in the paper, both adopters and non adopters of the agricultural technologies were selected from the same geographical location, same geographical proximity, same production system, same weather conditions, and same altitude.
The Conceptual/Analytical Framework
We assumed that for a farmer to make decision on whether or not to adopt the yam minisetts technology, he/she must have first examined the benefit obtainable from the adoption and benefit derived from non-adoption. A farmer is likely to adopt the yam minisetts technology, if the expected utility derived from adoption is greater than the expected utility from non- adoption. Conditional on cross-sectional data availability, we estimated poverty level of yam farmers households based on their adoption of yam minisetts technology. The data obtained were subjected to descriptive and inferential statistical analysis. Descriptive statistics for this study include frequency tables, percentages and means. The inferential analyses adopted for the study are FGT poverty index measurement, Propensity Score Matching (PSM) and Probit model [9].
Or,
Propensity Score Matching (PSM)
To isolate the independent impact of technology adoption on poverty reduction, propensity score matching (PSM) was used. A logit model was used to estimate propensity scores using a composite of pre- intervention characteristics of the sampled households and matching was performed using propensity scores of each observation [10]. In estimating the logit model, the dependent variable was yam minisett technology adoption, which takes the value of 1 if a household is an adopter and 0 otherwise. The cumulative logistic probability function is specified as
1 𝑝𝐼= 𝐹(𝑍𝑖)= F 𝛼+ Σ𝛽𝑖 𝑋𝑡1)= (
1+𝑒− (𝑎+Σ𝛽𝑖 𝑋𝑡1) ) (1)
Where: e represents the base of natural logarithms (2.718) Xti represents the tth explanatory variable (t=1,2,…,m) for the ith individual Pi is the probability that ith individual will make a certain choice (in this case adoption of yam minisett technology) given m explanatory variables α & βt are parameters to be estimated (t = 1, 2,,,,,,,,m; m is number of explanatory variables). Interpretation of the coefficients will be understandable if the logistic model is written in terms of the odds and log of odds. The odds ratio implies the ratio of the probability that an individual would choose an alternative (Pi) to the probability that he/she would not choose it (1-Pi). But,
1 (1 - 𝑝𝐼 ) =
1+𝑒𝑧𝑖 (2) Therefore,
1+ 𝑒𝑧𝑖 𝑃𝑖 1− 𝑃𝑖 ) = (
1+𝑒−𝑧𝑖 )=𝑒𝑧𝑖 (3) (
1+ 𝑒𝑧𝑖 𝑃𝑖 1− 𝑃𝑖 ) =(
1+𝑒−𝑧𝑖 )= 𝑒(𝑎+ Σ𝛽𝑖 𝑋𝑡𝑖) (4)
( Taking the natural logarithm of equation above will result in what is known as the logit model as indicated below:
𝑃𝑖 1−𝑃𝑖) = 𝛼+ 𝛽1 𝑋𝑡1 + 𝛽2 𝑋𝑡2 + ----- + 𝛽𝑚𝑖 𝑋𝑚𝑖 (5)
𝑧𝐼 = In (
If the disturbance term _Ui_is taken in to account, the logit model becomes 𝑧𝐼= 𝛼+ Σ𝛽 𝑡 𝑋1𝑡 + 𝑈𝑖 (6) After running the logit model, then the common support region where the values of propensity scores of both adopters and comparison groups can be found was identified. The region of common support will be defined by dropping observations below the maximum of the minimums and above the minimum of the maximums of the balancing scores between the two groups [11]. Then the Average Treatment Effect on treated (ATT) are only determined in the region of common support [12].
The next step in propensity score matching is to get the matching algorithm which best matches the treated observations with untreated based on the propensity scores from the preceding step. Treatment, in this case, is adoption of technology. There are different matching estimators in theory. According to Caliendo and Kopeinig, the most commonly applied matching estimators are nearest neighbor matching Caliper and Radius matching, Stratification and Interval matching, Kernel and local linear matching [12]. All matching estimators contrast the outcome of a treated individual with outcomes of comparison group members [12]. To estimate the effect of yam minisett technology to a given outcome (consumption expenditure per adult equivalent), is specified as:
𝑝 NP
$$ \sum_ {j = 1} ^ {r} C _ {i j 1} - \sum_ {i = 1} ^ {M} C _ {i j 1 0} $$
$$ \frac {i = 1}{P} - \tag {7} $$
where, Cij1is the post intervention per capita
consumption expenditure of household j, Cij0is the per
capita consumption expenditure of the ith non-adopters
matched to the jth adopters, P is the total number of
adopters (adopters of yam minisett technology), NP is the
total number of non-adopters (non-adopters of minisett
technology) and C is difference in per capita consumption
expenditure in ekiti state. Then the average effect of
adoption of yam minisett technology on outcome
variables (consumption expenditure per adult equivalent)
will be computed and it is specified as:
C =
Ti= Yi(Di=1)- Yi(Di=0) (8)
Where Τi is treatment effect (effect due to adoption of minisett technology), Yi is the outcome on household, Di is whether household i has got the treatment or not (i.e. whether a household adopts minisett technology or not). However, one should notice that Ti=Yi(Di=1) and Ti= Yi(Di=0)_cannot be observed for the same household at the same time. Depending on the position of households in the treatment (intervention adopters), either _Ti=Yi(Di=1)_or _Ti=Yi(Di_=0)_is unobserved outcome (called counterfactual outcome). Due to this fact, estimating household's treatment effect is not possible. One has to shift to estimate the average treatment effect of the population than the individual one. The most commonly used average treatment effect estimation is the average treatment effect on the treated (τATT) and is specified as ƮATT = E (Ʈ|D=1) = E[Y(1)|D = 1-E[Y(0)|D] = 1 (9)
Estimation of Poverty Profile (Foster- Greer- Thorbecke)
Changes in poverty status of yam minisett technology adopters and non-adopters households was achieved by using the Foster- Greer- Thorbecke class of poverty measures (FGT) which include the Headcount Index (P0), the Poverty Gap Index (P1), and the severity of Poverty Index (P2) [9]. The three indices can be expressed into one general form and distinguish themselves for the different weights attributed to the distance between expenditure of the poor and the poverty line. P0 attributes equal weight to all expenditure of the poor while P1 and P2 attribute increasingly more weight to distance of expenditure of the poor from the poverty line. The FGT is presented below:
𝑞 𝑦𝑝 − 𝑦 𝑖 𝑃(𝑎) = 1 𝑛 𝑦 𝑝 }𝑎 (10)
𝑖=1 { where n is the number of sample households, yi is per capita consumption expenditure (consumption expenditure per adult equivalent) of the ith household, yp represents the poverty line defined as 2 3 of mean per capital expenditure, q is the number of households below the poverty line in the population size and α is the poverty aversion parameter. The poverty aversion parameter takes a value of 0, 1, or 2. If α = 0, then the result (p) is poverty head count ratio, which measures the incidence of poverty within the sample. When α = 1, the result (p) is a poverty gap index, which measures depth of poverty or the aggregate consumption shortfall of the poor from the poverty line. Finally, if α = 2, the result (p) is a squared poverty gap, which measures the severity or intensity of poverty.
Results and Discussion
As shown in table 1, the age distribution of the farmers revealed that respondents between the ages of 61 and 70years were the minority (5%) for adopters and 3.3% for non adopters of yam minisett technology. Those who fell within the ages of 41 and 50 years were the majority (43.4%) for adopters and 36.7% for non-adopters of the yam minisetts technology. The mean age was approximately 48 and 49 years for adopters and non- adopters of the yam minisetts technology respectively. This implies that majority of the farmers are in their active years, agile and with more energy to dissipate and concentrate on productive effort and also with an advantage of transferring innovations that enhance farm productivity. It is expected that yam minisetts technology will be adopted at a faster rate in this area, which is in line with the observation of Awotide et al [13]. This is also corroborated by the work of Ayoade who stated that farmers that are in their productive state usually experience high farm output and enhance the spread of innovation [14].
Majority (83.3%) of the respondents were males while 16.7% of the respondents were females for adopters. For that of non-adopters of yam minisetts technology, 90% of the respondents were male while 10% were male. This result implies that male farmers participated more in yam production than their female counterparts and this could also be as a result of males having greater access to farm land than females. It could also be the result of the tedious nature of farming. This implies that yam farming is mostly done by male farmers who have and could have access to land resource and are thus instrumental for yam production than their female counterpart. This contradicts the findings of Nsoanya and Nenna who asserted that women are the backbone of agricultural sector and agricultural production but in line with the work of Tsue et al on the “Analysis of poverty and its determinants among cassava farmers in ApaLocal Government Area, Benue State, Nigeria” where male- headed households were about 85% of the sample studied [15]. The dominance of the male over the female might be attributed to the fact that male are stronger physically to withstand the rigour associated with yam production.
The size of household could also provide important information on the poverty level because it determines dependency ratio as well as family labour. 56.7% of the yam minisetts technology adopters had between 1-5 people in their household, while 48.7% of the non- adopters of the yam minisetts technology had between 1- 5 people in their households. About 43.3% of the respondents (adopters of yam minisetts technology) had between 6-10 household size, while 51.7% of the respondents (non-adopters of the yam minisetts technology) had between 6-10 household size. The statistics of the household size shows mean values of about 4.78 and 5.2 for adopters and non adopters of yam minisetts technology respectively. This implies that the non-adopters of yam minisetts technology had fairly large families as this could help them to spend less on the labour cost, because of steady availability of family labour and can also increase their poverty level. This closely follows Balogun and Obi- Egbedi findings of an average of six persons per household in South west Nigeria [16]. The large household size has implication on the poverty status of the farming household.
The result further revealed that majority of the respondents (78.3%) were married for adopters, 86.7% of the non-adopters of the technology were also married. This implies that the respondents were dominated by married men and women who invariably contributed to increase in household size, farm labour. Education is a major strategy for poverty eradication which ensures production skills that combine land and other factors of production for efficient productive activities [17]. The educational status of the respondents was measured by their level (education) of formal schooling and this revealed that 40% of the respondents had primary school education, while 13.3% of them had no formal education. For the non-adopters of the yam minisetts technology, about 38.3% of them had no formal education, and 28.3% had primary school education. The implication of this is that majority of the respondent had little years of schooling and this can influence their adoption of yam minisetts technology and poverty level as yam farmers since education helps in adopting improved agricultural technologies as observed by Ozor and Madukwe. This is also corroborated by the work of Ayoade [14].
Adequate farming experience is pivotal to the success of the agribusiness. Both groups had varying degrees of farming experience. About 28.3% and 33.3% of the respondents of the yam minisetts technology adopters and non adopters respectively had 6-10 years farming experience respectively. About 46.7% and 40% of the respondents had more than 10 years farming experience for yam minisetts technology adopters and non adopters respectively. The prevailing occupation of the household heads in the area was farming, with 63.3% for adopter and 71.67% for non adopters of yam minisetts technology. This implies that majority of the respondents engaged in farming as their primary occupation. Omoregbee and Edeogbon noted that 90% of poor households in the rural area relied on farming as a major source of income [18].
| Variables | Adopters Frequency | Percentage | Non adopters Frequency | Percentage | ||||||||||
| Age Range (Years) | ||||||||||||||
| ≤30 | 25 | 8.3 | 20 | 6.7 | ||||||||||
| 31-40 | 45 | 14.9 | 65 | 21.7 | ||||||||||
| 41-50 | 130 | 43.4 | 110 | 36.7 | ||||||||||
| 51-60 | 85 | 28.4 | 95 | 31.7 | ||||||||||
| 61-70 | 15 | 5 | 10 | 3.3 | ||||||||||
| Sex | ||||||||||||||
| Female | 50 | 16.7 | 30 | 10 | ||||||||||
| Male | 250 | 83.7 | 270 | 90 | ||||||||||
| Household Size | ||||||||||||||
| 5-Jan | 170 | 56.7 | 145 | 48.3 | ||||||||||
| 10-Jun | 130 | 43.3 | 155 | 51.7 | ||||||||||
| Marital Status | ||||||||||||||
| Single | 20 | 6.7 | 5 | 1.7 | ||||||||||
| Married | 235 | 78.3 | 260 | 86.7 | ||||||||||
| Widowed | 15 | 5 | 10 | 3.3 | ||||||||||
| Divorced | 30 | 10 | 25 | 8.3 | ||||||||||
| Educational Level | ||||||||||||||
| No formal education | 40 | 13.3 | 115 | 38.3 | ||||||||||
| Primary school education | 120 | 40 | 85 | 28.3 | ||||||||||
| Secondary school education | 100 | 33.3 | 55 | 18.3 | ||||||||||
| Tertiary education | 40 | 13.3 | 45 | 15 | ||||||||||
| Farming Experience | ||||||||||||||
| 1-5years | 75 | 25 | 80 | 26.7 | ||||||||||
| 6-10years | 85 | 28.3 | 100 | 33.3 | ||||||||||
| Above 10years | 140 | 46.7 | 120 | 40 | ||||||||||
| Primary Occupation | ||||||||||||||
| Farming | 190 | 63.3 | 215 | 71.67 | ||||||||||
| Handcraft | 90 | 30 | 45 | 15 | ||||||||||
| Civil Services | 15 | 5 | 20 | 6.67 | ||||||||||
| Petty trading | 5 | 1.7 | 20 | 6.67 | ||||||||||
| Total | 300 | 100 | 300 | 100 |
Table 1: Socioeconomic variables of the respondents. Source: Field Survey, 2017.
Poverty Analysis: Estimation of Poverty Status among Yam Farming Households in Ekiti State
The estimated total per capita expenditure of the yam farmers’ household was ₦16,110,900.00 while the mean per capita expenditure was ₦ 134,257.50. The poverty line computed was ₦44,950.0 as the two thirds (2/3) of the per capita expenditure mean. Thus, the yam farming households whose per capital expenditure falls below poverty line were considered being poor, while those that falls above or equal to the value of poverty line were considered to be non-poor.
As shown in Table 2, the poverty incidence (P1) in the study area was 0.5642 indicating that 56.42% of the sampled yam farmers’ households were actually poor based on the poverty line. The poverty gap (P1) was 0.3173. This implies that the cost of eliminating poverty relative to the poverty line was 31.7%, because it shows how much would have to be transferred to the poor to bring their incomes or expenditures up to the poverty line (as a proportion of the poverty line).The poverty severity (P2) among the sampled yam farmers households was 0.2131, indicating that the poverty severity of poor yam farmers households was 21.3%.This implies the poorest among the poor farm households who require the attention of policy maker in the redistribution of the standard of living indicators, such as income generating activities.
| Poverty | Incidence | ||||||||||
|---|---|---|---|---|---|---|---|---|---|---|---|
| Depth (P1) | S | everity (P2 | ) | ||||||||
| Index | (P0) | ||||||||||
| 0.5642 | 0.3173 | 0.2131 |
Table 2: Estimates of Poverty Incidence, Depth and Severity. Source: Field survey 2017
Decomposition of Poverty based on Yam Minisett Technology Adoption
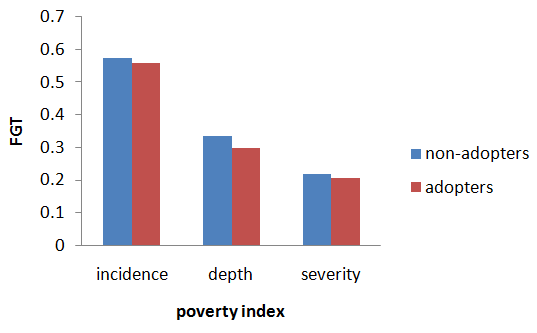
As depicted in Figure 1, the results of poverty profile based on yam minisett technology adoption shows that households that are non-adopters of yam minisetts technology were poorer than those of adopters in the study area. The incidence, depth and severity of poverty for non-adopters were 0.5742, 0.3333 and 0.2183 respectively while the corresponding figures for the adopters were 0.5600, 0.2989 and 0.2071 respectively.
Poverty incidence is slightly higher for non-adopters of yam minisetts technology than the adopters of yam minisetts technology (by about 1.42%). Hence, adopters of yam minisetts technology were less poor than the non- adopters of yam minisetts technology. The indices of depth (3.44%) and severity (1.12%) of poverty, were also higher among non-adopters of yam minisetts technology than those of the adopters of yam minisetts technology, revealing a high degree of income shortfall below the poverty line and a high degree of inequality among the poor. These findings conform to the work of Ayinde in his study on analysis of poverty level among farmers in Ogun State, Nigeria [19].
Impact of Yam Minisetts Technology on Poverty Alleviation among Yam-Based Farming Households
The unconditional summary statistics above suggest that agricultural technology may have a role in improving household well-being, but because adoption is endogenous, a simple comparison of the welfare indicators of adopters and non- adopters has no causal interpretation. That is, the above differences may not be the result of yam minisett technology adoption, but instead may be due to other factors, such as differences in household characteristics and the endowments mentioned earlier. To measure the impact of adoption, it is necessary to take into account the fact that individuals who adopt improved varieties might have achieved a higher level of welfare even had they not adopted. Therefore, multivariate analysis was applied to test the impact of yam minisett technology adoption on household welfare.
Determinants of Farmers’ Adoption of Yam Minisetts Technology
The results from the probit analysis of yam minisetts technology adoption and the variables used in the matching procedures are reported in Table 3. The standard errors in the result, indicates that adoption of yam minisett technology is clearly (nonlinearly) related to age at 1% significant level, and that the educational level appears not to be significant. Extension agents may be proxies for access to information. It is significant in explaining the variation in the adoption decision. Agricultural extension is the system of learning and building human capital of farmers through the provision of information and demonstrations, exposing farmers to technologies which can increase agricultural productivity and, in turn, income and welfare. Farmers who are frequently visited by extension agents tend to be more progressive and more likely to experiment with yam minisett technology. This positive effect of farmer technology awareness variable is consistent with Shiferaw, et al. for improved pigeonpea varieties in Tanzania and also with Kristjanson, et al. for cowpea varieties, while Kaliba, et al. also reported the same result for maize varieties and Gebreselassie and Sanders for sorghum in Ethiopia [20, 21, 22, 23]. Furthermore, household head income and access to credit also affects the propensity score, while household size, sex, primary occupation and farming experience does not seem to explain adoption. The adoption regression suggests the importance of age, household head income and access to income in influencing yam minisetts technology adoption.
| Variables | Coefficients | Standard Error | Z-value | P > /Z/ | |||||||||
|---|---|---|---|---|---|---|---|---|---|---|---|---|---|
| Age | -0.1092*** | 0.2807 | -3.89 | 0 | |||||||||
| Sex | -0.8315 | 0.4262 | -0.2 | 0.845 | |||||||||
| Household Size | 0.0924 | 0.0982 | 0.94 | 0.347 | |||||||||
| Educational Level | 0.0006 | 0.0407 | 0.01 | 0.989 | |||||||||
| Access of Credit | 1.5728*** | 0.3567 | 4.41 | 0 | |||||||||
| Household Income | -1.46E-06* | 7.64E-06 | -1.91 | 0.056 | |||||||||
| Primary occupation | -0.3292 | 0.253 | -1.3 | 0.193 | |||||||||
| Farming experience | -0.0171 | 0.015 | -1.14 | 0.255 | |||||||||
| extension agent visit | 0.8781*** | 0.341 | -3.71 | 0.011 | |||||||||
| Constant | 5.8297 | 1.3556 | 4.3 | 0 | |||||||||
| Pseudo R2 = 0.3445 | |||||||||||||
| LR chi-square= 51.97 | |||||||||||||
| Log likelihood= -49.4525 |
Table 3: Probit model results of determinants of households’ adoption of yam minisetts technology. Source: Field survey 2017 NOTE
Common Support Region: Estimation of the Propensity Score
After estimating values of yam minisetts technology adoption for adopters and non-adopters, the second step was estimating the propensity score by imposing a common support condition. Among adopters (treatment) and non adopters (control), the predicted propensity score ranged from 0.0638 to 0.9973, with a mean of 0.5428. The common support condition is satisfied. Thus, the common support assumption is satisfied in the region of [0.0638, 0.9973]. In other words, households whose estimated propensity scores are less than 0.0638 and larger than 0.9973 are not considered for the matching exercise. As a result of this restriction, 40 adopters and 85 non-adopters were discarded from the analysis. The density distributions of the propensity scores for adopters and non-adopters also support this result where there is a good overlap.
| Percentiles | Smallest | |||||||||
|---|---|---|---|---|---|---|---|---|---|---|
| 1% | 0.0637548 | 0.0637548 | ||||||||
| 5% | 0.0882503 | 0.074029 | ||||||||
| 10% | 0.1617709 | 0.074029 | Obs | 95 | ||||||
| 25% | 0.2996792 | Sum of Wgt. | 95 | |||||||
| 50% | 0.5337203 | Mean | 0.542787 | |||||||
| Largest | Std. Dev. | 0.27907 | ||||||||
| 75% | 0.7514829 | 0.9893608 | ||||||||
| 90% | 0.9662895 | 0.9893608 | Variance | 0.077878 | ||||||
| 95% | 0.9819028 | 0.9973139 | Skewness | 0.01489 | ||||||
| 99% | 0.9973139 | 0.9973139 | Kurtosis | 1.926072 |
Table 4: Estimated propensity score. Source: Computed from field survey 2017
Estimation of Average Adoption Effect (ATT): Matching Algorithms
Table 5 reports the estimates of the average adoption effects estimated by Nearest Neighbor Matching (NNM), Kernel Based Matching (KBM), Radius Matching and Stratification methods. All the results were based on implementation of common support and caliper, so that the distributions of adopters and non-adopters were located in the same domain. As suggested by Rosenbaum and Rubin, we used a caliper size of one-quarter of the standard deviation of the propensity scores. Bootstrap standard errors based on 50 replications are reported [10]. Outcome variable used in the analysis is the natural logarithm of per capita consumption expenditure (hereafter consumption expenditure). The consumption expenditure is transformed into logarithmic because it is very right-skewed. The logarithmic transformation eliminates this skewness. The results indicate that adoption of improved yam minisett technology has a positive and significant effect on consumption expenditure and thus, has the power to lift the poor farmers above the poverty line.
consumption expenditure of similar pairs of households that belong to different technological status (i.e., adopters and non-adopters). The increase in consumption expenditure can help adopters reduce their poverty level. These findings are consistent with recent studies on the impact of modern crop varieties on household welfare. Hossain et al and Mendola in Bangladesh, Janaian et al in India, and Wu et al in China showed that the adoption of improved rice varieties has a significant positive impact on household income and a negative impact on poverty status [6, 24, 25]. Becerril and Abdulai using propensity score matching methods found that improved maize adoption significantly increases per capita expenditure and reduces poverty in Mexico [26]. Kijima et al also showed that NERICA rice adoption reduces poverty without deterioration in income distribution in Uganda [27]. Kassie, et al. using PSM methods found that the adoption of improved groundnut varieties in rural Uganda increase crop income and reduce poverty [27].
The ATT in nearest neighbor matching (NNM), Radius matching and stratification methods were found to be significant at 10%, 5% and 1% respectively. This indicates a positive relationship which increases the consumption expenditure per capita of the yam farming households using the algorithms. This is the average difference in
| ATT estimator | ATT | Standard Error | t-value | No of treatment | No of control | ||||||||||||
| Nearest neighbor matching (NNM) | 0.346* | 0.19 | 1.822 | 260 | 175 | ||||||||||||
| Kernel matching (KBM) | 0.262 | 0.153 | 1.716 | 260 | 215 | ||||||||||||
| Radius matching | 0.288*** | 0.111 | 2.609 | 260 | 215 | ||||||||||||
| Stratification | 0.462*** | 0.138 | 3.353 | 260 | 215 |
Table 5: Estimation of the true effect of yam minisett technology adoption on per capita expenditure. Source: Computed from field
Estimation of the True Impact of Yam Minisett Technology Adoption on Poverty Status of Yam Farmers Household
The matching procedure applied to the probability of the yam farmers’ household to be poor indicated that adopters were less likely to be poor by about 6.8% - 91.9% across the ATT estimator (Table 6). This is consistent with a priori expectations. As consumption expenditure of yam farmers increases due to the effect of adoption, poverty level is expected to reduce because an increase in consumption expenditure shows that there is an increase in income. In this case, a unit increase in income due to adoption of yam minisett technology would decrease adopters’ propensity to fall below the poverty line. This finding qualitatively agrees with Mendola, and is statistically significant at 5% level [6].
| ATT estimator | ATT | Standard Error | t-value | No of treatment | No of control | ||||||||||||
| Nearest neighbor matching (NNM) | -0.919*** | 0.222 | -4.14 | 260 | 175 | ||||||||||||
| Kernel matching (KBM) | -0.158** | 0.064 | -2,46 | 260 | 215 | ||||||||||||
| Radius matching | -0.068*** | 0.022 | -3.09 | 260 | 215 |
Table 6: Impact of yam minisett technology adoption on poverty of adopting yam farmers household. Source: Computed from field sur
Conclusion and Recommendation
The study established that majority of the yam farming households in the State that does not adopt yam minisett technology were poorer than their counterparts and it also reflects that adoption of improved yam minisett technology has a positive and significant effect on consumption expenditure and thus, has the power to lift the poor farmers above the poverty line. The results generally confirm the potential direct role of agricultural technology adoption on improving rural household welfare, as higher incomes from improved technology also mean less poverty. It was concluded that increase in the number of years of schooling of the respondents, having a small household size and, adopting the yam minisett technology would reduce the likelihood of being poor. Based on the findings from this research work, the following recommendations were made;
i. Government should provide farm inputs and improved seed varieties to the farmers at subsidized rate in order to attract youths who are active, agile and with more energy to dissipate to agricultural production. ii. Government and financial institutions should make credit facility to be accessible to rural dwellers. Proper orientation should be given to them on credit utilization so that the credit could have positive influence on their income and livelihood. iii. Technology should be improved because it has the capacity to lift people above poverty. iv. Government should improve extension services by providing input and remuneration in order to enhance awareness and proper dissemination of information.
References
-
Sanusi WA, Salimonu KK (2006) Food security among households: Evidence from Yam production economics in Oyo State, Nigeria. Agricultural Journal 1(4): 235-239.
-
FAO (Food and Agriculture Organization) (2006) FAO STAT. Statistics Division of Food and Agriculture Organization.
-
Orkwor GC, Asiedu CIA (1999) Agronomy in Food Yams, Advance in Research, National Root Crops Research Institute (NRCRI), Umudike, Nigeria.
-
Federal Ministry of Agriculture, FMA (2001) Annual Review. Abuja, Nigeria: Federal Capital Development Authority.
-
DFID (2003) Agriculture and poverty, reduction: unlocking the potential. ADFID policy paper.
-
Mendola M (2007) Agricultural Technology Adoption and Poverty Reduction: A Propensity-Score Matching Analysis for Rural Bangladesh. Food Policy 32(3): 372-393.
-
IITA (2004) Annual Report of the International Institute of Tropical Agriculture, IITA report, Ibadan, Nigeria.
-
Orkwor GC, Asiedu R, Ekanayake IJ (2000) Food Yams: Advances in Research, IITA, Ibadan and NRCRI, Umudike, Nigeria. pp: 249.
-
Foster J, Greer J, Thorbecke E (1984) A class of decomposable poverty measures. Econometrica 52(3): 761-766.
-
Rosenbaum PR, Rubin DR (1983) The Central Role of the Propensity Score in Observational Studies for Causal Effects. Bometrika 70(1): 41-55.
-
Diaz JJ, Handa S (2006) An Assessment of Propensity Score Matching as a Non Experimental Impact Estimator: Evidence from Mexico’s PROGRESA Program. The Journal of Human Resources 41(2): 319-345.
-
Caliendo M, Kopeinig S (2008) Some Practical Guidance for the Implementation of Propensity Score Matching. Journal of Economic Surveys 22(1): 31-72.
-
Awotide BA (2012) Poverty and Income Inequality among Fish Farming Household in Oyo State, Nigeria. Agricultural Journal of Medwell Journals 7(2): 111- 121.
-
Ayoade AR (2013) The Adoption Impact of Improved Cassava Varieties on The Social Life of Rural Farmers in Orire Local Government Area of Oyo State. International Journal of Humanities and Social Science 3(12): 278-286.
-
Tsue PT, Obekpa JUC, Iorlamen TR (2013) Analysis of poverty and its determinants among cassava farmers in Apa Local Government Area, Benue State, Nigeria. Journal of Agricultural Economics and Development 2(7): 296-300.
-
Balogun OL, Obi-Egbedi O (2012) Resource use efficiency and productivity of cocoa farmers in Idanre LGA of Ondo state, Nigeria. Am J Social Manage Sci 3(2): 60-67.
-
Apata TG (2006) Income and Livelihood Diversification among Farming households in Crude- oil polluted areas of Ondo State, Nigeria. Department of Agricultural Economics, University of Ibadan.
-
Omoregbe FE, Edeogbon CO (2006) Diversification of Livelihood among Rural Households in Owan West Local Government Area, Edo State. Global Journal of Social Sciences 5(1): 9-12.
-
Ayinde IA (2003) Analysis of poverty level among farmers in Ogun State, Nigeria. ASSET 3(3): 27-35.
-
Shiferaw BA, Kebede TA, You L (2008) Technology adoption under seed access constraints and the economic impacts of improved pigeonpea varieties in Tanzania. Agricultural Economics 39(3): 309-323.
-
Kristjanson PM, Okike I, Tarawali S, Singh BB, Manyong VM (2005) Farmers’ perceptions of benefits and factors affecting the adoption of improved dualpurpose cowpea in the dry savannas of Nigeria. Agricultural Economics 32(2): 195-210.
-
Kaliba AR, Verkuijl H, Mwangi W (2000) Factors affecting adoption of improved maize seeds and use of inorganic fertilizer for maize production in the intermediate and lowlands of Tanzania. Journal of Agricultural and Applied Economics 1: 1-13.
-
Wubeneh NG, Sanders JH (2006) Farm-level adoption of sorghum technologies in Tigray, Ethiopia. Agricultural System 91(1-2): 122-134_._
-
Hossain M, Bose ML, Mustafi BAA (2006) Adoption and productivity impact of modern rice varieties in Bangladesh. Developing Economies 4(2): 149-166.
-
Wu H, Ding S, Pandey S, Tao D (2010) Assessing the impact of agricultural technology adoption on farmers’ well-being using propensity score matching analysis in Rural China. Asian Economic Journal 24(2): 141-160.
-
Becerril J, Abdulai A (2010) The impact of improved maize varieties on poverty in Mexico: A propensity score marching approach. World Development 38 (7): 1024-1035.
-
Kijima Y, Otsuka K, Sserunkuuma D (2008) Assessing the impact of NERICA on income and poverty in central and western Uganda. Agricultural Economics 38(3): 327-337.
- Enhancement of Vegetative Growth and Fruit Yield in Cucumber (Cucumis sativus L.) via Spiritual Blessing (Biofield) Energy Intervention
- Production of Açaí (Euterpe oleracea Mart.) under Different Agroforestry System Management Intensities in Amazonian Floodplain (Varzea) Forests
- Coffee and the Production Region: What is the Secret to the Expression "Quality"?
- Experiential Agripreneurship Training in Sub-Saharan Africa: Integrating a Business Incubator into Postgraduate Livestock Education at the University of Buea
- Advances in Agricultural High-Quality Development
- Linking Compost Residue to ABAGE in Plants - a Short Note