Decomposition Analysis of Maize Production in India
The present study has examined state-level maize scenario in India. The results showed that the overall growth of maize production in Gujarat due to yield effect or technological intervention i.e., 175.93% was the highest among the states, while it was lowest in West Bengal i.e., 16.43%. The area under maize is substantially increased, and the area effect contributes about 154.12% to the production of maize. In India, the contribution of the yield effect or technological intervention was 61.28%, while the area effect contribution was only 29.12%. The study has suggested that for comprehensive policy mechanism support of enhanced insurance coverage, better investment in agricultural research and education, and modern technology development need to be extended to the maize producer.
Introduction
Maize is one of the emerging and most important food crops in the world today and staple food in developing countries. It is estimated that together with rice and wheat, maize provides at least 30% of food calories to more than 4.5 billion people in 94 developing countries in the world [1]. Maize is also a key ingredient in livestock and poultry feed and is used extensively in industrial products, including biofuels, starch oil, pharmaceutical, and alcoholic beverages. The study of Paroda and Kumar [2] predicted that the maize area would grow further to meet the future food, feed and other demands especially in view of the booming livestock and poultry producing sectors in the country. It is cultivated 150 million hectares in year 2018 about 160 countries, having wider diversity of soil, climate, biodiversity and management practice that contributes 36%, i.e. 782 metric tons of the global grain production [3]. The crop has high production potential, provided the available improved varieties and composites reach the farming community.
In India, the Maize crop is ranked as the third most important food grain crop and the fifth most producer in the world [2]. Maize area has slowly expanded over the past few years to meet the future demand. The government report shows that maize production in the country has increased by nearly 2.5 times over the past two decades, but the growth rate of production has decelerated from 6% in the 2000s to 3.5% in 2010. Maize production declined by 3.6% in 2018-19 but is estimated to increase by 1.3% i.e., 28.1 million tonnes in 2019-20 due to higher yield (DAC, Government of India) [3]. Maize has excellent potential for crop diversification in rice- wheat cropping system areas of North-western plains, where substantial groundwater depletion has occurred. However, maize has low profitability compared to competing crops like rice due to low and fluctuating prices and yield. Farm get harvest prices of maize were much lower than MSP (Minimum Support Price) since 2012 expect the year 2016-17.
The nature of the demand for maize is also changing. Maize is an important food crop, but over the past decade, its demand for livestock feed and other newly-maize food products has increased. This has largely been driven by rapid economic growth in highly populated regions in Asia, the Middle East and Latin America leading to increased demand for poultry and livestock products from more affluent consumers [5].
With evidences, the present study examines the extent and dimensions of maize growth in India. How maize will contribute to livestock management in efficient manner.
**Materials and Method**
**Data Sources**
The current study is purely based on secondary data drawn from the Directorate of Economics and Statistics, Land Use Statistics, Department of Agriculture, Cooperation and Farmers Welfare (DACNET) [3]. Government of India. Data on the state-wise area under maize crop has been taken into consideration to analyse the extent and coverage of maize production in India. For our suitability of analysis, data on two different periods have been taken into consideration, i.e. 2009-10 and 2019-20. In order to understand the consumption pattern of maize, the poultry industry is one of them, where maize is used as poultry feed. Thus, the poultry population has been taken into consideration. Poultry population data has taken from the Department of Animal Husbandry and Dairy, Government of India. In addition, export data on maize has taken from the Directorate General of Commercial Intelligence and Statistics, Government of India. The study has covered 29 major Indian states namely, such as Andhra Pradesh, Assam, Bihar, Gujarat, Haryana, Himachal Pradesh, Karnataka, Kerala, Jammu & Kashmiri, Madhya Pradesh, Maharashtra, West Bengal. It also included the newly formed states like Jharkhand, Chhattisgarh, Uttarkhand and Telangana.
**Estimation Method**
**Compound Annual Growth Rate**
The pace of a region's agricultural development can be ascertained by measuring growth in area, production and yield of crops. In the present study, compound growth rates of area, production and yield for the selected states for each period were estimated to study the growth in the area, production and yield. Compound growth rates were estimated with the following exponential model:
$$Y = ae^{bt}$$
**Decomposition Analysis**
To measure the relative contribution of area and yield to the total output change. The decomposition analysis model, as given below, will be used. Sharma and Subramanyam [6] redeveloped the model, and several research scholars used this model and studied the growth performance of crops. The method state that if $[A]_0,P_0$ and $Y_0$, respectively area, production and productivity in the based year and $A_n,P_n$ and $Y_n$ are values of the respective variables in nth year item.
$$P_o = A_o * Y_o \text{ and, } P_n = A_n * Y_n \dots(\text{i})$$
Where, $A_o$ and $A_n$ represent the area and $Y_o$ and $Y_n$ represents the yield in the base year and nth year, respectively.
$$P_n - P_o = \Delta P, A_n - A_o = \Delta A, Y_n - Y_o = \Delta Y \dots(\text{ii})$$
From equations (i) and (ii), we can write
$$\Delta P = A_o \Delta Y * 100 + Y_o \Delta A * 100 + \Delta Y \Delta A * 100$$
$$Yield\ effect = \frac{A_o \Delta Y * 100}{\Delta P}, Area\ effect = \frac{Y_o \Delta A * 100}{\Delta P}, Interaction = \frac{\Delta Y \Delta A * 100}{\Delta P}$$
Thus, the total change in production can be decomposed into three components: yield effect, area effect and the interaction effect due to change in yield and area.
**Results and Discussion**
**Global Trends of Area, Production, and Yield of Maize Crop**
Maize is an important cereal in many developed and developing countries in the world. It is widely used for animal feed and industrial raw materials like biofuels and alcoholic beverages in developed countries, whereas developing counties mostly use it for feed. Table 1 shows the maize area, productivity and yield across the world. It shows that the USA is dominating first place in the area and production, around 34 % in the world, followed by China 22.41% and Brazil 7.17%. In comparison, India ranks seventh in terms of area and production, around 2.42 %, next to Indonesia.
| Area (in '000 ha) | Production (in '000 tons) | Yield in (Kg./ha) | Production (in %) | |
|---|---|---|---|---|
| USA | 33079 | 392451 | 11864 | 34.2 |
| China | 42159 | 257174 | 6100 | 22.41 |
| Brazil | 16121 | 82288 | 5104 | 7.17 |
| Argentina | 7139 | 43462 | 6088 | 3.79 |
| Ukraine | 4564 | 35801 | 7844 | 3.12 |
| Indonesia | 5680 | 30254 | 5326 | 2.64 |
| India | 9200 | 27820 | 3024 | 2.42 |
| Mexico | 7123 | 27170 | 3815 | 2.37 |
| Romania | 2443 | 18664 | 7641 | 1.63 |
| Canada | 1431 | 13885 | 9705 | 1.21 |
| World | 193734 | 1147622 | 5924 | 100 |
Table 1: ** Maize Area, Production and yield in various countries.
Source: Authors estimation, 2023. Table 1: Maize Area, Production and yield in various countries.
Price trend of Maize in India
Figure 1 shows the harvest price trend of maize in India. The price of maize has increased gradually over the year. During the period of 2001-02 harvest price for maize was around Rs. 499 per quintal. The advancement of new varieties, as well as modern technology practices, has bought systematic changes in the price level. Recently, the harvest price for maize is around Rs. 1876 per quintal. The steady price increase is a positive motivation for poverty-ridden maize producers so that they can produce more in the coming years.
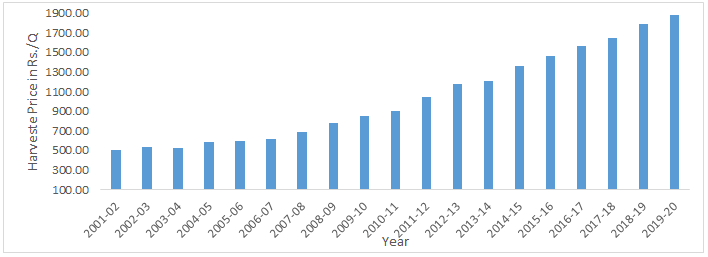
Source: Authors estimation, 2023. Figure 1: Price trend of Maize in India.
Maize Exports
Figure 2 represents India’s top 5 export destinations in terms of poultry products. Maize production has increased remarkably in the last two decades. The food grain basket is self-sufficient after the green revolution. The surplus of maize crops has been used for poultry feed. In recent years, the demand for chicken has increased in low-income groups.
As a result, maize crops is used for poultry feed to meet the demand for chicken meat. The top five countries are major export destinations such as (Oman 36%), followed by (Maldives, 23%), and (Indonesia, 16%). While, (Vietnam, 14%) and (Russia, 11 %) are also the major destination for poultry products. The rise in export volume has a positive impact on balance of trade.
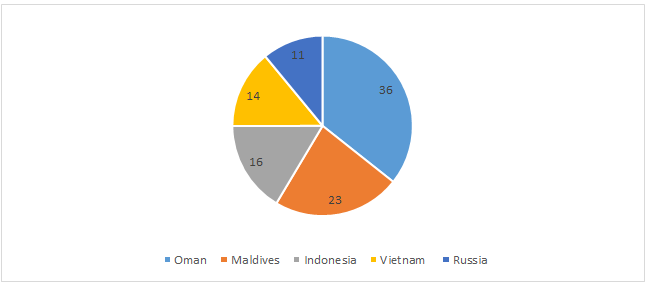
Source: Authors estimation, 2023. Note: figures are in percentage. Figure 2: Top Poultry Products Export destinations in India for the year 2020-21.
Trends of Poultry Population in India
Poultry refers to the domestication of birds that produce eggs and meat that can be consumed and commercial traded by farmers. India’s poultry population has considerably grown over the last two decades to meet the growing demand for eggs and meat. In the livestock sector, poultry is one of the most efficient enterprises for the rural areas’ low and marginal-income groups. The poultry industry provides cheap sources of high-quality proteins, minerals and vitamins to balance the human diet. Table 2 represents poultry population in India, among the states of India, Tamil Nadu has a higher number poultry population of around (120.8 million) followed by Andhra Pradesh (107.9 million) and Telangana (80.0 Million). While Odisha (27.4 million) and Kerala (29.8 million) poultry population. The total poultry population in the county is 851.8 million in 2019, and it increased by 14.39 % over 2012. The livestock report shows that the total commercial poultry in the country is 534.74 million in 2019, which increased by 4.5% over 2012 [9]. The increasing poultry population is hugely depending on the supply of poultry feed. Poultry feed mostly comes from maize crops. Thus, there is ultimately a demand for maize production. The sustainable development of the poultry sector can play a key role in achieving UN sustainable development goals. It can directly or indirectly improve the livelihood of millions of people.
| State | 2012 (Millions) | 2019 (Millions) | % Change |
|---|---|---|---|
| Tamil Nadu | 117.3 | 120.8 | 2.9 |
| Andhra Pradesh | 80.6 | 107.9 | 25.3 |
| Telangana | 80.8 | 80 | -1 |
| West Bengal | 52.8 | 77.3 | 31.69 |
| Maharashtra | 77.8 | 74.3 | -4.71 |
| Karnataka | 53.4 | 59.5 | 10.25 |
| Assam | 27.2 | 46.7 | 41.76 |
| Haryana | 42.8 | 46.3 | 7.56 |
| Kerala | 24.3 | 29.8 | 18.46 |
| Odisha | 19.9 | 27.4 | 27.37 |
| India | 729.2 | 851.8 | 14.39 |
Table 2: ** Major Poultry Population in India.
Source: Authors estimation, 2023. Table 2: Major Poultry Population in India.
Extent of Maize Production in India
The compound annual growth rate of different states was calculated the study status of maize production. The study period was considered to be from 2009–10 to 2019–20. The CAGR statistics revealed that the cropped area under maize has increased in all the states except Gujarat, Rajasthan, and Uttar Pradesh. The highest growth in the cropped area was in West Bengal (12.04% annual), while the lowest was in Andhra Pradesh (0.3% annual). Further, the productivity growth rate in all states shows that Tamil Nadu was at the top of the list, while Karnataka was last among the states. Maharashtra states shows that the decrease in the maize yield i.e., 24.52q/ha in TE-2009-10 to 21.74q/ha in TE-2019- 20 (Table 3).
| Area (Million Hectares) | Production (Million Tons) | Yield (quintal/hectare) | |||||||
|---|---|---|---|---|---|---|---|---|---|
| States | TE | TE | CAGR (%/ annum) | TE | TE | CAGR (%/ annum) | TE | TE | CAGR (%/ annum) |
| 2009-10 | 2019-20 | 2009-10 | 2019-20 | 2009-10 | 2019-20 | ||||
| Andhra Pradesh | 0.29 | 0.3 | 1.55 | 1.47 | 1.97 | 6.07 | 50.55 | 65.36 | 4.46 |
| Bihar | 0.64 | 0.67 | 0.85 | 1.55 | 2.28 | 3.45 | 24.39 | 33.86 | 2.58 |
| Gujarat | 0.47 | 0.42 | -0.28 | 0.62 | 0.75 | 1.95 | 13.06 | 18.14 | 2.24 |
| Karnataka | 1.12 | 1.36 | 4.64 | 3.1 | 3.96 | 5.36 | 27.66 | 29.16 | 0.69 |
| Madhya Pradesh | 0.84 | 1.34 | 1.88 | 1.11 | 3.91 | 6 | 13.19 | 29.17 | 4.05 |
| Maharashtra | 0.7 | 1.04 | 7.41 | 1.73 | 2.26 | 9.43 | 24.52 | 21.74 | -1.89 |
| Rajasthan | 1.07 | 0.87 | -0.95 | 1.64 | 1.63 | 1.29 | 15.38 | 18.78 | 2.26 |
| Tamil Nadu | 0.25 | 0.35 | 7.46 | 1.07 | 2.63 | 17.64 | 42.59 | 75.36 | 9.44 |
| Telangana | 0.52 | 0.58 | 4.15 | 2.04 | 2.55 | 5.79 | 39.56 | 44.05 | 1.58 |
| Uttar Pradesh | 0.8 | 0.73 | -1.33 | 1.15 | 1.61 | 1.2 | 14.34 | 22.04 | 2.56 |
| West Bengal | 0.09 | 0.27 | 12.04 | 0.32 | 1.63 | 17.86 | 36.63 | 60.75 | 5.2 |
| India | 8.06 | 9.33 | 2.19 | 18.47 | 28.41 | 4.99 | 22.91 | 30.47 | 2.74 |
Table 3: ** Major maize producing states in India.
Source: Authors estimation, 2023. Table 3: Major maize producing states in India.
Sources of Growth in Maize Yield: Decomposition Analysis Results
Figure 3 depicts the decomposition analysis results of maize production in terms of area, yield, and interaction effect. The sources of growth for Andhra Pradesh show that the yield effect (i.e., 86.66%) was most responsible for increasing the production of maize, while the area effect contributed a negligible amount. All the major maize production states revealed that the maize production growth due to the yield effect or technological intervention, which shows that more than 45% effects except Maharashtra, West Bengal and Karnataka. While the area effected maize growth in the states of Maharashtra, West Bengal, Telangana and Karnataka. In order to increase the production in maize growth in the area effected states needs to be technological development and its proper implementation [10, 11].
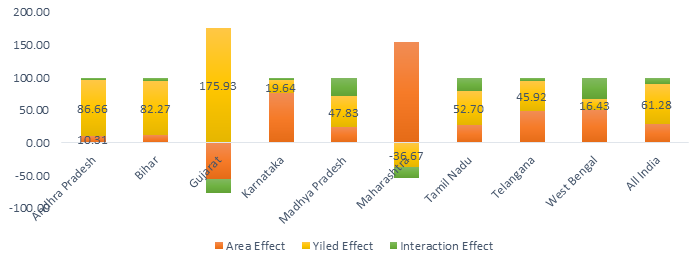
Source: Authors estimation, 2023. Figure 3: Sources of Growth in Maize Production.
Further, the yield effect in production in Gujarat was the highest among the states (i.e., 175.93%), while it was lowest in West Bengal (i.e., 16.43%). It is also reported in Figure 3 that the area under maize is substantially increased, and the area effect contributes about 154.12% to the production of maize. In India, the contribution of the yield effect was
61.28%, while the area effect contribution was only 29.12%. Figure 4 revealed that the consumption percentage of maize has been increased over the year in the states of India due to the growing demand of food pattern and urban living style of people [8, 9].
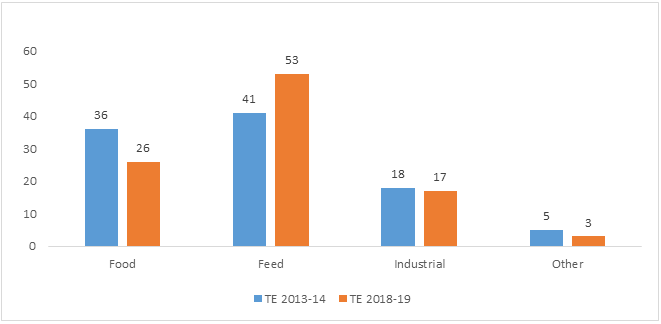
Source: Authors estimation, 2023. Note: figures are in percentage. Figure 4: Change in share of maize consumption in 2013-14 and 2018-19.
Conclusion and Policy Recommendations
The present study tries to capture the performance trend of maize production in the last twenty years in India and identify the trading scenario, especially in the poultry industry. In addition, this study has also highlighted the priorities of maize research in the field of research and development at regional as well as national levels. Undoubtedly, India is the fifth largest producer of maize in the world. During the last two decades, maize production in India has significantly increased due to growing feed industry demand and the production of biofuels, starch oil, pharmaceutical, and alcoholic beverages. The study observed that maize has a high potential for product diversification in the era of economic liberalisation. In the contemporary period, demand for maize is shifting from food to feed for livestock and an essential ingredient for poultry feed. For instance, traditional maize foods have replaced new types of maize-based products among people in urban areas, especially corn soups, corn fleck, vegetable, and edible oils. It is also found that the poultry industry is one of the emerging markets in India and other countries. The demand for chicken has increased, and is a substitute for animal protein among the lower-income strata. The study shows that middle East-Asia countries like Oman and other South-East Asian countries like Maldives, Indonesia, and Vietnam are the leading export destination for poultry products. In the case of maize, neighbouring countries like Bangladesh, the Republic of Vietnam, Nepal, and Malaysia are the major export destination. In order to increase productivity as well as expand the volume of export, there is a need to invest more in research and development with the help of appropriate technologies for farming communities. In addition, future maize production will largely depend on how markets are developed, the production and marketing need to be strengthened with appropriate institutes and export promotion. There is a need for new innovative technologies for poultry production, as the growing demand for chicken is increasing. There is a need to develop new mechanisms to synthesise MSP for the maize crops and crop-specific insurance to benefit the small and marginal maize producers [12, 13].
The study’s findings are critical for assessing the performance of the maize crop in India and providing direction for future research. However, the results of this study need to be interpreted with caution because of certain limitations. First, we have used data only from 2009–10 to 2019–2020, while for robust analysis, the data period should be at least 30 years. Second, our analysis only considers the supply side of the equation; the demand for maize in the domestic and international markets must also be considered. Lastly, an economic analysis of the cost of cultivation in the high-yield and low-yield states is also needed using the case study method.
Conflict of Interest
The authors declare that they have no conflict of interest.
References
-
Shiferaw, Bekele (2011) Crops that feed the world 6. Past successes and future challenges to the role played by maize in global food security. Food security 3(3): 307- 327.
-
Paroda, RS, P. Kumar. (2000) Food production and demand in South Asia. Agricultural Economics Research Review 13(1):1-25.
-
FAOSTAT (2020) World Food and Agriculture, Statistical Pocketbook 2020.
-
DAC&FW (2020) Agricultural Statistics at a Glance 2020, Ministry of Agriculture & Farmers Welfare, Department of Agriculture, Cooperation & Farmers Welfare, Directorate of Economics & Statistics, 2020.
-
Delgado, Christopher L (2003) Rising consumption of meat and milk in developing countries has created a new food revolution. The Journal of nutrition 133(11): 3907S-3910S.
-
6. Sharma PV, Subramanyam S (1984) A note on the decomposition of the growth rate of aggregate crop output. Agricultural Situation in India 39(9): 691-694.
-
Kalamkar SS, Narayanmoorthy A (2003) Impact of Liberalisation on Domestic Agricultural Prices and Farm Income: An Analysis across States and Crops. Indian Journal of Agricultural Economics 53(3): 353-364.
-
Singh S, Sanatan N (2018) Application of Indicators to Identifying Climate Vulnerable Areas in Sub-tropical regions of India. Asian Journal of Multidimensional Research 7(11): 234-251.
-
DAHD (2019) 20th Livestock Census State/District Wise Report 2019. Vol-II &III. Department of Animal Husbandry, Dairying and Fisheries, Ministry of Agriculture, Government of India.
-
Birhanu, Ayalew, and Sekar I (2016) Trends and regional disparity of maize production in India. Journal of Development and Agricultural Economics 8(9): 193-199.
-
Kiran AS, Umesh KB, Shankara MH (2018) Growth and Instability in Agriculture- A case of Maize Production in India. Processing of 30th International Conference of Agricultural Economist 5(11): 119-125.
-
Lyngkhoi, Dipriya R, Bera BK, Chatterjee S (2021) Economic Analysis of Production of Maize in Meghalaya and Constraints Associated with it. Economic Affairs 66(3): 395-399.
-
Joshi PK, Singh NP, Singh NN, Gerpacio RV, Pingali PL (2005) Maize in India: Production Systems, Constraints, and Research Priorities. Mexico.
- Enhancement of Vegetative Growth and Fruit Yield in Cucumber (Cucumis sativus L.) via Spiritual Blessing (Biofield) Energy Intervention
- Production of Açaí (Euterpe oleracea Mart.) under Different Agroforestry System Management Intensities in Amazonian Floodplain (Varzea) Forests
- Coffee and the Production Region: What is the Secret to the Expression "Quality"?
- Experiential Agripreneurship Training in Sub-Saharan Africa: Integrating a Business Incubator into Postgraduate Livestock Education at the University of Buea
- Advances in Agricultural High-Quality Development
- Linking Compost Residue to ABAGE in Plants - a Short Note