Determinants of Rust Resistant Wheat Technology Adoption in Misha District, Ethiopia
A study was conducted to analyze factors influencing adoption of rust-resistant improved wheat variety in Misha district, in sourhern Ethiopia. The analysis was based on a household survey data collected from 387 randomly selected households. A binary logistic regression was used to examine factors influencing the adoption of rust-resistant improved wheat variety. The study has found that age and education level of household head, land size, livestock holding, frequency of extension contact, and access to credit services were factors that significantly affected the adoption of rust-resistant improved wheat variety. The deployment of improved varieties is the most important factor in raising agricultural productivity and farm households' access to food security in Ethiopia. Thus, adopting rust-resistant improved wheat technology is one way of improving farmers' wheat production and decreasing yield loss due to currently occurring wheat rust diseases. The findings of this study imply that any development intervention through improved wheat technology should take into account the aforementioned socioeconomic characteristics to enhance the adoption rate of new technology.
Introduction
Wheat is one of the major staple and crucial food security crops in Ethiopia. Next to maize wheat is the second most consumed cereal crop in Ethiopia. It is a staple food in the diets of several Ethiopians, providing about 15% of the caloric intake Food and Agriculture Organization (FAO) [1], placing it second after maize and slightly ahead of teff, Investigation Paper sorghum, and enset, which contribute 10-12% each [2]. It has multipurpose uses in making human foods, such as bread, biscuits, cakes, sandwiches, and others. Besides, wheat straw is commonly used as a roof thatching material and as feed for animals [3].
Demand for wheat is growing rapidly in Ethiopia, reflecting population growth and shifting dietary patterns linked to urbanization that are mirrored across other eastern and southern African countries [4]. Despite this low productivity, the demand for wheat has been increasing in both urban and rural areas of the [5]. Although there are recent productivity gains, shortfalls remain and drastically narrowing the gap between supply and demand; self- sufficiency in wheat production is a high national priority. Food security problems and the need to decrease spending of scarce foreign currency reserves on costly wheat imports have paramount importance to the Government of Ethiopia [6].
During the 2019 production season, the national average wheat productivity of Ethiopia was 2.97 tons per hectare (t/ ha), which was lower than the average productivity of Zambia and Egypt whose productivity was 6.68 t/ha and 6.38 t/ha, respectively [7]. The low productivity is attributed to several factors including biotic (diseases, insects, weeds, and others) and abiotic (low and high rainfall, temperature, and low adoption of new agricultural technologies). Among the biotic factors, wheat rust has been the most devastating disease in Ethiopia causing up to 100% yield losses on susceptible varieties during the epidemic year [8, 9]. The adoption of improved wheat variety and improved agricultural practices are some of the mechanisms for productivity enhancement. Rust-resistant improved wheat variety is among wheat technologies for improving wheat productivity. Therefore, to increase wheat productivity in disease-prone areas there is a need to adopt rust-resistant wheat variety. However, factors affecting the adoption of rust-resistant wheat varieties were rarely studied. Thus, this study was conducted to analyze factors affecting the adoption of rust-resistant wheat technology in Misha district.
Moreover, although there are related studies on factors that affect the adoption of improved wheat technology, their findings vary across time and places for instance: Bekele H, et al. [10] and Chilot Y, et al. [11] reported that access and use of credit significantly and positively influenced the adoption of improved wheat variety and intensities of use. On the other hand, Tuesday Z, et al. [12] and Tesfaye S, et al. [13] found that access to credit did not affect the adoption of improved wheat variety. Chilot Y, et al. [11] and Hiwot H [14] reported that the education level of the head of the household positively and significantly influenced both the likelihood of adoption and the intensity of improved wheat variety use. On the contrary, Tesfaye S, et al. [13] reported that the education level of household heads negatively and significantly affected the adoption of improved wheat variety. Others, Bekele H, et al. [10] reported that the education level of the household has not affected the adoption decision of improved wheat variety. Tesfaye Z, et al. [12] reported that extension contact and participation of farmers in on-farm demonstrations had positively and significantly affected the adoption of improved bread wheat variety. On the other hand, Hiwot H [14] reported that contact with extension agents has not affected the adoption of improved wheat variety. Tesfaye S, et al. [13] reported that livestock ownership had a significant and positive effect on the adoption of improved wheat variety. On the other side, Bekele H, et al. [10] and Hiwot H [14] reported that Livestock numbers did not affect the adoption of improved wheat variety. Therefore, this study also aimed to identify the factors that affect the adoption of rust-resistant improved wheat technology in Misha district.
Materials and Methods
Description of the Study Area
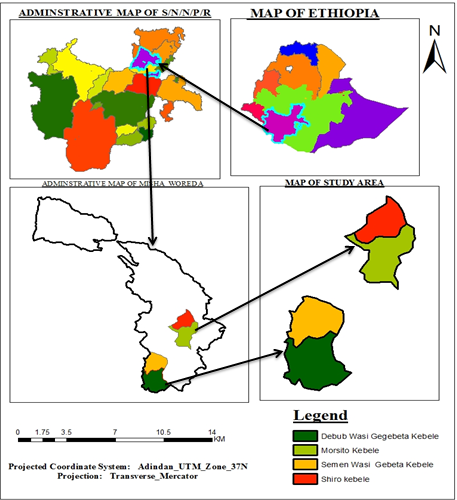
This study was conducted in Misha district, which is found in Hadiya administrative zone of the Southern Nations Nationalities and Peoples Regional State of Ethiopia. The district is located at a distance of 253 km from Addis Ababa, 207 km from Hawassa, and 18 km from Hossana. The geographic location of the district is at 7°08’ N latitude and 37°81’ E longitude. Agricultural activity is the main means of livelihood for the majority of the Misha district population. In terms of economic activities, the Woreda community fully experienced animal rearing and crop production (mixed farming system). The most dominant cereal crops produced in this district are wheat, teff, maize, sorghum, bean, pea, and other cash crops like chat, coffee, and vegetables [15, 16]. Hadiya Zone is one of the major wheat-producing areas in Ethiopia and it is recognized as one of the wheat belts in the country Central Statistical Agency (CSA) [17]. Misha district is one of the potential wheat production districts of Hadiya zones which have been found to have a high prevalence of wheat rust (Figure 1) [9].
Map of the Study Area
Sample Size Determination
A simplified formula by Yamane T [18] was used to determine the required sample size at a 95% confidence level, and 5% (0.05) level of precision.
$$n = \frac{N}{1 + N(e)^2}$$
- Where:
- $n$ = the required sample size
- $N$ = population size
- $e$ = is the level of precision
In Misha district, there were about 11,683 wheat-producer households (Misha District Agricultural Development Office Report, 2021). Therefore, the sample size was determined as follows:
$$n = \frac{11,683}{1 + 11,683(0.05)^2} = 387 \text{ households}$$
Sampling Procedure
The sampling method used for this study was a mixed method of purposive and simple random sampling. First, purposive selection of potential wheat production kebeles of the woreda was conducted based on the data on production potential of each kebele from the woreda agricultural and rural development office to get sufficient data. In the meantime, four wheat potential production kebeles were selected. Finally, a sample of households from each kebele was selected through a simple random sampling technique based on probability proportional to the size of the population for each kebeles.
Method of Data Collection
Primary data were collected using a structured questionnaire that comprised information related to household demographics, socioeconomic characteristics, and institutional factors. On the other hand, secondary data were collected from Woreda and Kebele agricultural and development offices reports, reviews of different documents such as research and reports of different organizations, published journal articles, books, and proceedings related to this study.
Method of Data Analysis
In this study, descriptive statistics involving mean, and percentage of frequencies were used to assess the characteristics of the sample households. The logistic regression model was used to analyze factors affecting the farmer’s decision to adopt rust-resistant improved wheat technology.
Adoption of agricultural practice is a qualitative or categorical dependent variable (adopter or not-adopter), which is influenced by various factors. It is possible to analyze using Ordinary Least Squares (OLS) for binary choice models, however, this results in heteroscedastic error terms, that is, the variance of the error term is not constant for all observations so that parameter estimates obtained are inefficient, thus classical hypothesis tests, such as t-ratios, are inappropriate. All parameter estimates of models are asymptotically consistent, efficient, and normal if the models use maximum likelihood estimation (MLE) procedures [19, 20].
Logistic regression can help us to predict a response variable based on continuous, discrete, dichotomous, or a mix of these predictor variables to determine the percent of the variance in the response variable explained by the predictor variables, to rank the relative importance of the predictor variables and to assess interaction effects. Hosmer DW [21] pointed out that the logistic distribution (logit) has an advantage over the others in the analysis of dichotomous outcome variables in that it is an extremely flexible and easily used model from a mathematical point of view and results in a meaningful interpretation. The parameter estimates of the model were asymptotically consistent and efficient.
Thus, to identify factors affecting the decision to adopt rust-resistant improved wheat variety, demographic, socioeconomic characteristics, and institutional factors or variables was used, in logistic regression analysis. If the response of the $i$th farmer to the question of adoption is denoted by a random variable $Y_i$ and a corresponding probability (i.e., probability of adopting rust-resistant improved variety by pi such that the probability of adoption ($Y_i = 1$) = pi and the probability of non-adoption ($Y_i = 0$) = 1 – pi.
The logistic model is specified by:
$$Y_i = \beta_0 + \beta_i X_i + U_i$$
- Where:
- $Y_i$: be a dichotomous outcome random variable with categories 1 (adopter) and 0 (non-adopter).
- $X_i$: denotes the collection of predictor variables.
- $U_i$: denotes the error term, which has an independently distributed random variable with a mean of zero.
In the regression model, because the dependent variable in this case adoption is taking the value 1 or 0, the use of LPM has a major problem that the predicted value can fall outside the relevant range of 0 to 1 probability value. Therefore, the model was estimated through using Maximum Likelihood Estimation (MLE). So, the logistic cumulative probability function for adopters is represented by:
... 1 1 1 zi $$ P _ {i} = \frac {1}{1 + e ^ {- z i}} = \frac {e ^ {z i}}{1 + e ^ {z i \dots}} $$ …………………………………………… (2) Where:
Pi is the probability that the ith farmer adopted the rust-
resistant improved wheat variety and that Pi is non-linearly
related to Zi (i.e., Xi and βs).
$$ Z _ {i} = \beta_ {0} + \beta_ {1} X _ {1} + \dots + \beta_ {n} X _ {n} ^ {\prime} \mathrm {e} ^ {\prime}, $$
represents the base of natural logarithms: Then, (1-P), the
probability of non-adopter of rust-resistant improved wheat
variety is presented as:
1 1 1 i zi P e − = +
………………………………….…………... (3) And then, by dividing equation (2) by equation (3), the odds ratio in favor of adopting the rust-resistant improved variety obtained as follows:
1 1 1 zi zi i zi i
$$ \frac {p _ {i}}{1 - p _ {i}} = \frac {1 + e ^ {z i}}{1 + e ^ {- z i}} = e ^ {z i} $$ ........................................................... (4) Then the dependent variable is transformed by taking the natural log of equation 4 specified by:
$$ L _ {i} = L _ {n} \left(\frac {p _ {i}}{1 - p _ {i}}\right) = Z _ {i} = \beta_ {0} + \beta_ {1} X _ {1} + \dots + \beta_ {n} X _ {n} + U _ {i} \tag {5} $$
Li is the log of the odds ratio, L is the logit,
Zi: is a function of n-explanatory variables, i.e., 0 1 1 ... i n n Z X X β β β = + + +
, Pi probability of adoption
which, ranges between 0 and 1.
0 1 1 ... 1 i i n i n n i i
Diagnostic Test of the Logistic Regression Model
This study used logistic regression to assess factors affecting the adoption of rust-resistant wheat variety. For the analysis to be valid, the model has to satisfy the assumptions of logistic regression. Therefore, before using the model to make any statistical inference, the study checked that the logistic regression model used fits sufficiently well using major diagnostic tests of the logistic regression model. Thus, this study used the Hosmer-Lemeshow goodness-of-fit test to examine the overall model fitness, variance inflation factor (VIF) to test multicollinearity problem with continuous explanatory variables, multicollinearity and contingency coefficient to detect the existence of multicollinearity between desecrates variables.
Definition of Variables and Hypothesis
Dependent Variable: the dependent variable is the adoption decision of rust-resistant improved wheat variety. The variable takes the value of 1 for the household that adopted rust-resistant improved wheat variety during the 2020/2021 production season and 0 for a household that did not cultivate rust-resistant improved wheat variety.
Independent Variable: For this study independent variables were selected based on the literature of past research findings on the adoption and impact of agricultural technology. Major variables expected to influence the adoption of improved wheat variety were selected. The list of variables and their expected signs are listed in Table 1 below.
| Description of the variable | Variable type | Expected sign of variables | |
|---|---|---|---|
| Sex_hh | Sex of household head; 1 if household head is male 0, otherwise | Dummy | + |
| Age_hh | Age of household head in years | Continuous | - |
| Educ_level | Education level of household head in years of schooling | Continuous | + |
| TFAMSIZE | Total number of family size of a household | Continuous | + |
| Landsize | Total landholding or ownership in hectare | Continuous | + |
| Farm_Exp | Farming experience of household head in years | Continuous | + |
| LHTLU | Livestock ownership in tropical livestock unit (TLU) | Continuous | + |
| FRQEXN | Frequency of extension contact during cropping season in numbers | Continuous | + |
| MCOP | membership of farmers’ cooperative 1, if a household is a member of farmers’ cooperative, 0 otherwise | Dummy | + |
| ACRD | Access to credit services, 1 if there is access to credit, 0 otherwise | Dummy | + |
| Mrk_Dist | Distance to the nearest market in walking minutes | Continuous | - |
| DPR | dependency ratio in percent | Continuous | - |
Table 1: Description of Independent Variables and Expected Signs.
Results and Discussion
Descriptive Statistics of Variables
The descriptive statistics of variables of sample farmers examined in this study are presented in Tables 2, 3. Table 2 presents dummy variables whereas Table 3 presents continuous variables.
Variables Adopters Non-adopters Total χ2 (chi2) Percent Frequency Percent Frequency Percent Frequency Sex_hh Female 37 23.57 69 30 106 27.39 Male 120 76.43 161 70 281 72.61 1.942 ACRD Yes 120 76.43 131 56.96 251 64.86 No 37 23.57 99 43.04 136 35.14 15.529* MCOP Yes 100 63.69 114 49.57 214 55.3 No 57 36.31 116 50.43 173 44.7 7.535* In Table 2, the chi-square test was computed for the dummy variables and it was found to be statistically significant for membership farmers’ cooperatives and access to credit services at a 1% level of significance. This indicates that there was a proportional difference between adopters and non-adopters in these variables.
| No | 37 | 30.51 | 116 | 30.45 | 175 | 44.7 | 7.535 |
Table 2: Summary of Frequency of Dummy Variables.
Table 3 shows the result of descriptive statistics for continuous variables. As shown from the table, t-statistics were computed for all continuous variables and it was found to be statistically significant for the Age of the household head, education level of the household head, distance to the nearest market in walking minutes, land size, livestock holding, and frequency of extension service at 5% and 1% level of significances. This implies that there was a significant difference in all these variables between adopters and non- adopters.
| Variables | Adopters | Non-adopters | Combined sample | t-stat. |
|---|---|---|---|---|
| Age of household head | 41.35 | 43.78 | 42.79 | 2.524** |
| Education level | 7.78 | 6.27 | 6.89 | 6.713*** |
| Farm experience | 17.22 | 17.65 | 17.48 | 0.496 |
| Distance to market | 33.43 | 36.57 | 35.29 | 2.230** |
| Family size | 7.42 | 7.1 | 7.23 | 1.668 |
| Land size (ha) | 0.8 | 0.68 | 0.72 | 5.213*** |
| Livestock holding (TLU) | 6.74 | 5.62 | 6.08 | 4.068*** |
| Frequency of extension service | 4.29 | 3.6 | 3.88 | 5.871*** |
| Dependency ratio | 76.23 | 80.87 | 78.99 | 0.675 |
Table 3: Summary and Mean Comparison of Continuous Variables.
Source: Own computation using Survey Data (2021). Note: , and *, indicate significance at a 5% level of significance, and 1% level of significance respectively. Table 3: Summary and Mean Comparison of Continuous Variables.
Estimation of Econometric Models
Diagnostic Test of the Logistic Regression Model The Goodness of Fit of Logistic Regression: This study used the Hosmer-Lemeshow goodness-of-fit test to examine the overall model fit. The Hosmer & Lemeshow test provides a global fit test, testing the ‘estimated model to one that has a perfect fit. If this test is not significant, then you have evidence of a correctly specified model. If it is significant, then you have evidence that the model is misspecified (Pituch and Stevens, 2016). Table 4 shows that (Hosmer- Lemeshow chi2 (8) = 8.07, Prob > chi2 = 0.4267), prob chi2 is greater than the critical value 0.05 which was insignificant; this result revealed that the model had an acceptable fit or correctly specified.
Goodness-of-fit test of logistic regression
(Table collapsed on quantiles of estimated probabilities) number of observations = 387 number of groups = 10 Hosmer-Lemeshow chi2(8) = 8.07 Prob > chi2 = 0.4267 Source: Own computation using survey data (2021). Table 4: Hosmer-Lemeshow Chi-Square Model Specification Test.
Multicollinearity Test
Multicollinearity Test of Continuous Explanatory Variables: From Table 5 below, all continuous explanatory variables had tolerance values closer to one, and variance inflating factors of all explanatory variables were below 2, which indicates that the VIF of all these explanatory variables was less than the critical VIF value 10. So, by using the rule of thumb (that is if the VIF of a variable exceeds 10, that variable is said to be highly collinear) there was no multicollinearity problem between explanatory variables.
| Variable | VIF | Tolerance | R-Squared |
|---|---|---|---|
| Age_hh | 1.3 | 0.7758 | 0.2242 |
| Educ_level | 1.1 | 0.9046 | 0.0954 |
| Farm_Exp | 1.4 | 0.7332 | 0.2668 |
| Mrk_Dist | 1.2 | 0.8389 | 0.1611 |
| TFAMSIZE | 1.1 | 0.9509 | 0.0491 |
| Landsize | 1.1 | 0.8749 | 0.1251 |
| LHTLU | 1.2 | 0.8423 | 0.1577 |
| FRQEXN | 1.2 | 0.8635 | 0.1365 |
| DPR | 1.1 | 0.8769 | 0.1231 |
| Mean VIF | 1.2 |
Table 4: Multicollinearity Test for Continuous Variables.
Source: Own computation using survey data (2021). Table 5: Multicollinearity Test for Continuous Variables.
Multicollinearity Test for Discrete Variables
This study used a contingency coefficient to detect the existence of multicollinearity between desecrates variables. As shown in Table 6 below, the contingency coefficients between explanatory variables were less than 0.75. So, using this rule of thumb method of detecting multicollinearity, there is no multicollinearity problem between these desecrates variables.
| Sex_hh | ACRD | MCOP | |
|---|---|---|---|
| Sex_hh | 0.707 | ||
| ACRD | 0.112 | 0.707 | |
| MCOP | 0.039 | 0.121 | 0.707 |
Source: Own computation using survey data (2021). Table 6: Contingency Coefficient for Discrete Variables. Determinants of Adoption of Rust-Resistant Improved Wheat Variety The Wald chi-square (Wald chi2 (12)) = 91.20, prob > chi2 = 0.0000). This implies that the null hypothesis which indicates all coefficients are simultaneously equal to zero is rejected at 1% level significance and the model has a good fit.
As shown in Table 7, age of the household head, education level of the household head, land size, livestock ownership, frequency of extension contact, and access to credit were variables that significantly affected the adoption of rust-resistant improved wheat variety. Age of household head: as presented in Table 7, age of the household negatively affected the adoption of rust-resistant improved wheat variety and was significant at a 1% level of significance level. As the age of household head increases by one year the probability or likelihood of adopting rust- resistant improved wheat variety decreases by 1.2%. This impels older people reluctant to accept new technology because they are afraid of the risks of new technologies as a result these older household heads are poor adopters of rust-resistant new technology. This finding is congruent with the studies by Sosina B, et al. [22], Berihun K, et al. [23], Moti J, et al. [24], and Udimal TB, et al. [25], confirming the younger age households are adopters as compared to their counterparts elders. Education level of household head: as presented in Table 7, the education level of household head positively affected the probability of adoption of rust-resistant improved wheat variety and was significant at a 1% level of significance. As the schooling of household heads increases by one year the probability of adopting rust-resistant improved wheat variety increased by 8.4%. This implies that farmers who attained high-level formal education gain better skills for gathering information from different sources as expected; as a result, it has a significant positive contribution to the adoption of new agricultural technologies as compared to non-educated farmers. This result is in line with the findings of Bekele K, et al. [23], Leake G [26], Hiwot H [14] reported that an increase in the level of education of a household increases the probability of adopting improved wheat variety. However, this is in contrast with a study by Tesfaye et al. (2016) reported that the level of education of a household head decreases the likelihood of adoption of improved wheat variety. Land size owned (landholding): as presented in Table 7, Land size owned by a household positively affected the probability of adoption and was significant at a 1% level of significance. An additional hectare increase in land size for households increases the probability of adopting rust- resistant improved wheat variety by 41%. This implies that farmers who have more land holdings are more likely to take the risk of new technologies. In addition, having more farmland is one option whereby farmers can be prompted to diversify their crop production and adopt newly emerging improved crop technologies. This result is inconsistent with the study by Regassa D, et al. [27] reported that having a large farmland size increases the probability of adopting high-yielding wheat verities. Similarly, Solomon A, et al. [28], Bekele K, et al. [23] and Degefu K, et al. [29] reported that as farm size increases the likelihood of adoption of the improved technology by farmers increases. Livestock holding: as presented in Table 7, livestock holding by a household has positively affected the adoption of rust- resistant improved wheat variety and was significant at a 5% level of significance. An additional unit increase in tropical livestock units of livestock holding for a household increases the likelihood of adopting rust-resistant improved wheat variety by 2.3%. This implies that having more livestock enables households to increase family income from the sales of livestock. Thus, farmers can easily meet their agricultural needs from sales income of livestock and livestock products. Thus, this increases the probability of the adoption of improved agricultural technology. This finding is in line with a study by Regassa D, et al. [27] reported that an increase in tropical livestock units increases the probability of adopting a high-yielding wheat variety. Similarly, this result is in line with studies by Solomon A, et al. [28], Hassen B, et al. [30], Berihun K, et al. [23], Tolesa A [31], and Milkias D [32] confirmed that livestock holding positively and significantly affect adoption. Frequency of extension contact: as presented in Table 7, frequent extension contacts positively affected the probability of adoption of rust-resistant improved wheat variety and were significant at a 1% level of significance. One additional day increase in the number of extensions contact increases the probability of adopting rust-resistant improved wheat variety by 8.5%. This is because farmers who have more frequent extension contact get more new information regarding new agricultural technology and associated agricultural practices; therefore they are more likely to adopt new improved agricultural technologies. This result agrees with the studies conducted by Solomon A, et al. [28], Moti J, et al. [24], Leake G, et al. [26], Sisay D [34], and Regassa D, et al. [27] found the frequency of extension contacts with extension agents positively and significantly influenced the adoption decision of agricultural technology. Access to credit services: as presented in Table 7, access to credit positively affected the adoption of rust-resistant improved wheat variety and was significant at a 1% level of significance. Having access to credit services increases the probability of adopting rust-resistant improved wheat variety by 18.2%. This is because, agricultural inputs or technologies are costly, as a result, there was a lack of enough money to purchase improved farm technologies, especially for smallholder farmers. This implies that having access to credit services solves such type of problem. Therefore, having access to credit services increases the likelihood of adopting improved wheat technology. This result agrees with the study by Milkias D [32], who reported access to credit had positively and significantly influenced the likelihood of adoption of improved wheat technology. Studies by Namwata BML, et al. [35], and Leake G, et al. [26] also confirmed access to credit facilities positively affects the adoption of improved agricultural technology [36].
| Coef. (Robust St.Err) | Marginal effect | |
|---|---|---|
| Age_hh | -0.053(0.015)*** | -0.012 |
| Sex_hh | 0.224(0.294) | 0.051 |
| Educ_level | 0.364(0.076)*** | 0.084 |
| Farm_Exp | 0.017(0.017) | 0.004 |
| Mrk_Dist | -0.011(0.011) | -0.002 |
| TFAMSIZE | 0.103(0.069) | 0.024 |
| Landsize | 1.772(0.621)*** | 0.41 |
| LHTLU | 0.102(0.051)** | 0.023 |
| FRQEXN | 0.366(0.119)*** | 0.085 |
| ACRD | 0.823(0.288)*** | 0.182 |
| MCOP | 0.215(0.277) | 0.05 |
| DPR | -0.003(0.002) | -0.001 |
| Constant | -5.391(1.146) | |
| Number of obs | 387 | |
| Wald chi2(12) | 91.2 | |
| Prob > chi2 | 0 | |
| Pseudo R2 | 0.2277 |
Table 6: Determinants of Adoption (Logistic Regression).
Note: and * indicate significant at 5 %, and 1%, levels, respectively. Table 7: Determinants of Adoption (Logistic Regression).
Conclusion and Recommendation
The study examined factors affecting the adoption of rust-resistant wheat technology in the Misha district of Ethiopia. The findings of the study revealed that the education level of household head, land size, Livestock holding in TLU, extension contact, and access and availability of credit services of household have positive contributions to the adoption of rust-resistant improved wheat variety. On the other hand, the Age of the household head negatively affects the adoption of rust-resistant improved wheat variety.
The fact that access to extension services has a positive and significant effect on the adoption of rust-resistant improved wheat variety indicates; the crucial role that extension workers played in influencing farmers’ attitudes and raising farmers’ understanding of the advantages of better wheat technology. This suggests that to increase the production of sustainable food, farmers’ perceptions of the benefits and uses of better wheat technology must be increased. Therefore, the government and other stakeholders should work to expand the extension services through extension agents to enhance the adoption and dissemination of rust-resistant wheat varieties to farmers.
Access to credit facilities is one of the key factors that influenced the adoption decision of households. As compared to farmers without access to credit facilities, those with credit facilities are more likely to adopt rust-resistant wheat technology. Access to credit services enhances the adoption of improved agricultural technologies particularly those unaffordable to smallholder farmers through its effect of reducing the existing cash constraint for undertaking agricultural decisions and accessing high-value agricultural inputs. Therefore, to encourage farmers to adopt rust- resistant wheat technology, credit services should be made available to farmers at a reasonable rate.
In addition, farmers who own little land and livestock were poor adopters of rust-resistant technology. This is due to the fact that they have low wealth ownership as compared to their counterpart farmers. Seed distribution is required to empower poor farmers by giving priority to them and providing credit facilities for agricultural technologies. This will help to improve the adoption of rust-resistant technology.
References
-
FAO (Food and Agriculture Organization) (2015) Food Balance Sheets. FAOSTAT.
-
Minot N, Warner J, Lemma S, Kasa L, Abate GT, et al. (2015) The Wheat Supply Chain in Ethiopia: Patterns, Trends, and Policy Options. International Food Policy Research Institute, pp: 62.
-
Mesfin OG (2015) Bread wheat production in small scale irrigation users agro-pastoral households in Ethiopia: Case of Afar and Oromia regional state. International Journal of Agricultural Economics and Extension 3(5): 144-150.
-
Mason NM, Jayne TS, Shiferaw B (2015) Africa’s rising demand for wheat: trends, drivers, and policy implications. Development Policy Review 33(5): 581- 613.
-
Bekele S, Kassie M, Moti J, Chilot Y (2014) Adoption of improved wheat varieties and impacts on household food security in Ethiopia. Food Policy 44: 272-284.
-
Hodson DP, Moti J, Kindie T, Chilot Y, Beyene H, et al. (2020) Ethiopia’s transforming wheat landscape: tracking variety use through DNA fingerprinting. Scientific reports 10(1): 1-13.
-
FAOSTAT (2019) crops and livestock products.
-
Belayneh A, Friedt W, Ordon F (2012) Stem rust seedling resistance genes in Ethiopian wheat cultivars and breeding lines. African Crop Science Journal 20(3): 149- 162.
-
Alemayehu A, Yilma D, Selamawit T (2020) Status of wheat rust diseases in Hadiya Zone, Ethiopia. Journal of Biology, Agriculture and Healthcare 10(5): 33-37.
-
Bekele H, Verkuijl H, Mwangi W, Tanner D (2000) Adoption of improved wheat technology in Adaba and Dodola Woredas of the Bale Highlands, Ethiopia. CIMMYT, pp: 26.
-
Chilot Y, Moti J, Groote H, Menale K, Takele M, et al. (2013) Analysis of Adoption and Diffusion of Improved Wheat Technology in Ethiopia Analysis of Wheat Technology. CIMMYT.
-
Tesfaye Z, Girma T, Tanner D, Verkuijl H, Aklilu A, et al. (2001) Adoption of improved bread wheat varieties and inorganic fertilizer by small-scale farmers in Yelmana Densa, and Farta districts of Northwestern Ethiopia. CIMMYT.
-
Tesfaye S, Bedada B, Mesay Y (2016) Impact of improved wheat technology adoption on productivity and income in Ethiopia. African Crop Science Journal 24(1): 127-135.
-
Hiwot H (2018) Impacts of adopting improved wheat varieties on food security in Girar Jarso woreda, north Shewa zone, Oromia region, Ethiopia. Master’s thesis. Addis Ababa University, Ethiopia.
-
Shigute E, Anja A (2018) Small ruminant production and constraints in Misha Woreda, Hadiya Zone, Southern Ethiopia. International Journal of Livestock Production 9(8): 192-197.
-
Girma W, Meseret C, Anteneh A (2019) Species Diversity and Use of Home gardens in Misha Woreda, Hadiya Zone of the Southern Nations, Nationalities and Peoples Regional State, Ethiopia. International Journal of Food Science and Agriculture 2(7): 118-129.
-
Central Statistical Agency (CSA) (2015) Ministry of Finance and Economic Development Agricultural Sample Survey 2014-2015, pp: 188.
-
Yamane T (1967) Statistics: an introductory analysis. In: 2nd (Edn.), Harper and Row: New York University.
-
Gujarati DN (2004) Basic econometrics. In: 4th (Edn.), Tata McGraw-Hill publishing company: New Delhi, India.
-
Greene WH (2012) Econometric analysis. In: 7th (Edn.), Pearson education, USA.
-
Hosmer DW, Lemeshow S (2000) Applied logistic regression. In: 2nd (Edn.), New York.
-
Sosina B, Girma K, Bekele S, Ricker-Gilbert J (2014) Impact of improved maize adoption on welfare of farm households in Malaawi: a panel data analysis. World Development 59: 120-131.
-
Berihun K, Bihon K, Kibrom A (2014) Adoption and impact of agricultural technology on farm income: Evidence from southern Tigray, Northern Ethiopia. International Journal of Food and Agricultural Economics 2(4): 91-106.
-
Moti J, Minale K, Marenya P (2015) Impact of improved maize variety adoption on household food security in Ethiopia: an endogenous switching regression approach.
-
Udimal TB, Jincai Z, Mensah OS, Caesar AE (2017) Factors influencing the agricultural technology adoption: The case of improved rice varieties (Nerica) in the Northern Region, Ghana. Journal of Economics and Sustainable Development 8(8): 137-148.
-
Leake G, Adam B (2015) Factors determining allocation of land for improved wheat variety by smallholder farmers of northern Ethiopia. Journal of Development and Agricultural Economics 7(3): 105-112.
-
Regassa D, Degye G (2019) Determinants of High Yielding Wheat Varieties Adoption by Small-Holder Farmers in Ethiopia. Journal of Natural Sciences Research 9(12): 14-23.
-
Solomon A, Bekele S, Simtow F, Mekbib G (2011) Agricultural technology adoption, seed access constraints and commercialization in Ethiopia. Journal of Development and Agricultural Economics 3(9): 436- 447.
-
Degefu K, Mengistu K, Nigussie D, Feyisa H (2017) Determinants of adoption of wheat production technology package by smallholder farmers: Evidences from eastern Ethiopia. Turkish Journal of Agriculture- Food Science and Technology 5(3): 267-274.
-
Hassen B, Bezabih E, Belay K, Jema H (2012) Determinants of chemical fertilizer technology adoption in North Eastern highlands of Ethiopia: the double hurdle approach. Journal of Research in Economics and International Finance 1(2): 39-49.
-
Alemu T (2014) Adoption and Impact of Improved Agricultural Practices and Wheat Production Efficiency of Smallholders in Arsi Zone of Ethiopia. Doctoral dissertation, Haramaya University, Ethiopia.
-
Dawiet M (2020) Analysis on Determinants of Adoption of Improved Wheat Technology in Liben Jewi District, Oromia Region, Ethiopia. International Journal of Applied Agricultural Sciences 6(3): 36-43.
-
Moti J, Chilot Y, Menale K, Groote HD, Bekele S (2013) Knowledge, adoption and use intensity of improved maize technology in Ethiopia. Presented in 4th International Conference of the African Association of Agricultural Economists, pp: 22-25.
-
Debebe S (2016) Agricultural technology adoption, crop diversification and efficiency of maize- dominated smallholder farming system in Jimma Zone, Southwestern Ethiopia. Doctoral Dissertation. Haramaya University, Ethiopia.
-
Namwata BML, Lwelamira J, Mzirai OB (2010) Adoption of Improved Agricultural Technology for Irish Potatoes (_Solanum Tuberosum_) Among Farmers in Mbeya Rural District, Tanzania: A Case of Ilungu Ward. Journal of Animal and Plant Science 8(1): 927-935.
-
Abeyo B, Badebo A, Gebre D, Listman M (2020) Achievements in fast track variety testing, seed multiplication and scaling of rust-resistant varieties: Lessons from the wheat seed scaling project, Ethiopia. CDMX, Mexico.
- Enhancement of Vegetative Growth and Fruit Yield in Cucumber (Cucumis sativus L.) via Spiritual Blessing (Biofield) Energy Intervention
- Production of Açaí (Euterpe oleracea Mart.) under Different Agroforestry System Management Intensities in Amazonian Floodplain (Varzea) Forests
- Coffee and the Production Region: What is the Secret to the Expression "Quality"?
- Experiential Agripreneurship Training in Sub-Saharan Africa: Integrating a Business Incubator into Postgraduate Livestock Education at the University of Buea
- Advances in Agricultural High-Quality Development
- Linking Compost Residue to ABAGE in Plants - a Short Note