Impact of Soil Pore Size Distribution on Crop Growth in Relation to Plant Available Water (PAW) and Soil Organic Carbon (SOC) in Arid/Semi-Arid Regions
Soil structural status in relation to soil pore size distribution, soil water retention, and plant available water (PAW) influence crop plant growth. Also, soil organic carbon content (SOC) usually influence soil structural stability, soil pore size and may affect crop growth, especially in arid/semi-arid regions with low SOC. Our studies focused on soil structure under clay dispersion and conventional and no-tillage systems included cultivation of cover crop in arid/semi-arid region of north-eastern Iran, in 2020 and 2022, respectively. According to our findings, PAW directly depended on soil pore size distribution, the more micropores the more water retention. Consequently, smaller soil pores due to clay dispersion improved water retention in soils and crop growth increased with enhancing PAW. SOC usually is low in arid/semi-arid regions of the world, therefore, addition of soil organic matter by crop residue retention may help in improving soil condition. Based on our results, cover crop residue retention in no-till system increased SOC, and SOC positively influenced soil functions such as soil structural stability, soil pore size (using X-ray images), and root growth. Therefore, soil pore size distribution as influenced by soil structural status could be considered as a principal factor in crop growth in arid/semi-arid region of north-eastern Iran.
Abbreviations
PAW: Plant Available Water; SOC: Soil Organic Carbon.
Introduction
The soil pore system influences many soil functions and properties Shein EV, et al. [1], for example it has a major effect on soil physical properties and soil health, and controls water movement and solute transport Guo Y, et al. [2]. Changes in the soil pore size distribution, due to clay dispersion, soil compaction and swelling etc., may affect soil available water. Soil water content could also affect soil physical, chemical and biological properties and can alter nutrients uptake by plants and finally crop growth. It was also reported that soil water retention increased at range of high matric suctions, where smaller pores are responsible for water retention Asgarzadeh H, et al. [3]. There are different methods to define the soil available water for plants. The conventional plant available water (PAW) has been defined as difference between water contents at field capacity (FC) and permanent wilting point (PWP) (PAW = FC-PWP), which was used for years Kirkham MB [4]. Increase in the water retention might increase PAW, where FC and PWP are influenced by smaller soil pores, as a consequence crop growth condition will be affected by soil available water Farahani E, et al. [5]. Clay dispersion has been considered as the main process which can cause plugging of soil pores in salt affected soils Emami H, et al. [6, 7], therefore clay dispersion was reported mostly as a destructive phenomenon in literature. Dispersion of clay particles typically leads to unsuitable conditions for root growth, decreases water infiltration rate, increases risk of run-off, flooding and erosion, and may cause soil surface crusting Dexter AR, et al. [8, 9]. Problems of dispersive soils could be because of soil stability disruption which restricts water infiltration [10], enhances vulnerability of soil against water erosion Shahab H, et al. [11], and causes nutrients loss by overland flow Gholoubi A, et al. [12]. However, depending on how dispersed clay particles influence soil structure and pore size distribution, different aspect of clay dispersion role on soil functions might be expected.
Advanced agricultural practices to manage soil organic carbon (SOC) could improve soil ecosystem services. Iran mostly includes arid and semiarid regions with low SOC content, therefore, SOC management is essential for sustainable agriculture in Iran. Excessive tillage practices usually enhance SOC decomposition and soil degradation, therefore reduce soil quality Chenu C, et al. [13, 14]. However, conservation tillage systems increase SOC content Bhattacharyya R, et al. [15], improve soil aggregation Martínez E, et al. [16] and may increase total porosity and water retention Bhattacharyya R, et al. [17]. Conservation tillage with increasing SOC protects the soil from degradation and thereby develops soil quality Lampurlanés J, et al. [18]. Economic and environmental benefits of reduced tillage and no-till are driving a fast adoption of conservation tillage, around the world Liu K, et al. [19]. No-till systems consisted of cover crops cultivation and crop residue retention created continuous macro-pores and increased air-filled porosity at low matric suctions due to accumulation of SOC and resulted in better plant growth parameters Abdollahi L, et al. [20].
Because of the importance of pore size distribution in soil functions, we focused on soil pore size determination and crop growth assessment in a dispersive soil and in two tillage systems in northeastern Iran in our study. Therefore, quantitative determination of soil pore size which is typically based on the analysis of soil water retention data has been studied. This method creates a relationship between volume of water discharged at a given matric suction and pore size, however does not estimate shape and orientation of soil pores [1]. X-ray computed tomography (X-ray CT Scan) as a qualitative 3-dimensional analysis of internal soil structure and a suitable noninvasive technique to evaluate changes in soil porous system Garbout A, et al. [21, 22] has also been used in this study. In addition, crop growth condition was investigated directly by shoot and root growth measurements in our first work (2020) and indirectly using prediction of root growth condition by SOC content and root residue determination in our second study (2022).
Soil Pore Size Distribution in Connection with PAW, SOC and Crop Growth
The Experiment of Impact of Soil Pore Size on PAW and Crop Growth in a Dispersive Soil
Measurements: According to Farahani et al. [5], soil composite samples were collected from the soil surface (0– 0.3 m depth) of an agricultural loamy soil (the original soil), which is located at Ferdowsi university of Mashhad campus, north-eastern Iran (Table 1). The experiment was performed as completely randomized design with three replications. The soil has been treated with monovalent cation of K, to project clay dispersion, from concentration of 13.6 to 27.2 and 27.2 to 54.4 cmolc kg-1 in EC=3 and 6 dS m-1, respectively.
| Clay (% by weight) | Silt | Sand | OC | %CaCO 3 | Ece (dS m-1) | pHs | K (mg kg-1) | Na | Ca | Mg | CEC (cmolc kg-1) |
|---|---|---|---|---|---|---|---|---|---|---|---|
| 20.6 | 47.3 | 32.2 | 0.64 | 15.9 | 1.2 | 7.8 | 2.8 | 34.5 | 46.8 | 19.5 | 10.5 |
Table 1: Intrinsic Physical and Chemical Properties of the Original Soil.
OC=organic carbon; ECe= electrical conductivity of saturated extract; pHs= pH of saturated paste; CEC= cation exchange capacity. Table 1: Intrinsic Physical and Chemical Properties of the Original Soil.
The measurements were hereafter done on the treated soil samples. The soil water retention was determined on undisturbed soil cores (diameter: 3.5 cm; height: 4 cm) at matric suctions of 0, 50, 100, 300, 500, 1000 and 5000 hPa, using pressure plate apparatus. Then, the van Genuchten equation (Eq. (1)), see Van Genuchten MT [23], with the Mualem restriction (m = 1–1/n) was fitted to the measured data using the RETC software Genuchten MV, et al. [24]:
1 1 [1 )n n s r h θ θ θ α − = − + (1)
( ) (
where θs and θr are the saturated and residual water contents (cm3 cm−3), respectively, α is a scaling factor (hPa−1) and n is a shape parameter of the soil water retention curve.
The PAW was also calculated using soil water retention data and parameters by SAWCal (soil available water calculator) software Asgarzadeh H, et al. [25]. To determine soil pore size distribution the volumetric water content retained in soil at matric suctions up to 50 hPa was defined as macro-porosity, between 50–300 hPa and >300 hPa Marshall TJ [26] were considered as meso-porosity and micro-porosity, respectively.
To determine amount of dispersible clay in water in the soil samples, 20 g of the disturbed treated soil (< 2 mm) was placed in a 250-ml cylinder, and 200 ml of distilled water was added slowly down the sides of the cylinders to avoid soil disturbance Marchuk A, et al. [27]. After 12 h, dispersed particles were gently stirred into suspension and left to stand for 2 h. 10 ml suspension was taken from 10 cm depth, oven dried at 105 °C for 24 h, and dispersible clay in relation to total clay was determined [27].
To assess impact of PAW values on crop growth, maize was planted in the treated soils. NPK and micro fertilizers were also applied to prepare suitable condition for crop growth. Irrigation was done by weight change of the pots in relation to their initial weights using distilled water. At the end of maize vegetative growth, plants were harvested and shoot and root weights were measured to calculate shoot:root ratio per pot, as a well-known parameter to show rate of plant growth.
Data Interpretation: According to [5], adding monovalent cations (K) into the soils created clay dispersion in the treated samples, because monovalent cations may increase diffuse double layer (DDL) thickness of the clay particles and lead to clay dispersion. The differences between CEC of the original soil and the treated samples were not statistically significant, which means K ions were not fixed by clay layers and played a role in dispersion. The dispersible clay percentage increased significantly (p < 0.05) with increasing K concentration compared to the original soil (Figure 1). Also, clay dispersion at EC = 6 was lower than EC = 3 dS m−1, which primarily could be due to the higher electrolyte concentration that reduces dispersion Quirk JP, et al. [28].
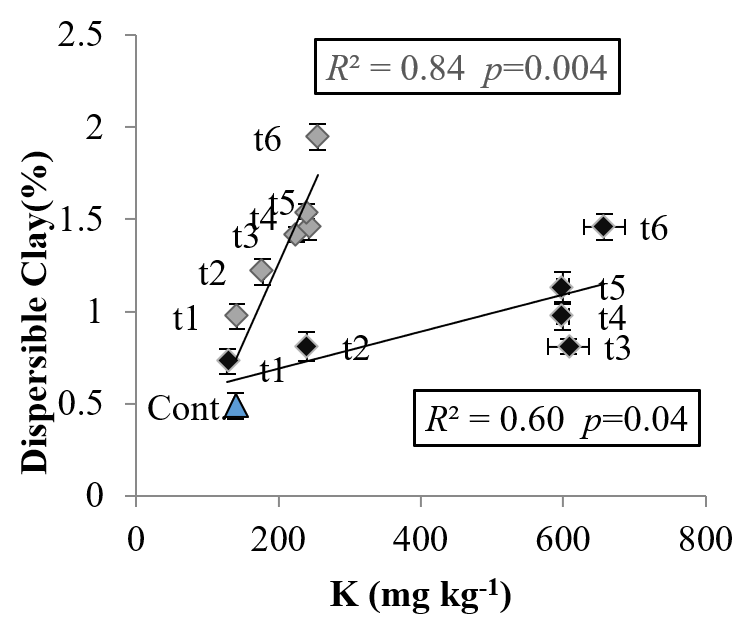
Grey Symbols: EC=3 dS m-1; Black Symbols: EC=6 dS m-1; T1 to T6 Indicate the Treatments (Concentration Of 13.6 To 27.2 and 27.2 To 54.4 cmolc kg-1 at two EC Levels) and Cont. is the Original Soil. Error Bars Indicate ± 1 Standard Error. Figure 1: Percentage of Dispersible Clay as a Function of K Concentration.
The meso- and the micro-porosity increased significantly (p < 0.05) in most of the treated samples in comparison with the original soil at both EC (Figure 2), however the macro- porosity did not differ significantly in the treated samples compared to the original soil. Clay particle rearrangement causes aggregate destruction and reduces pore size, which is referred to as short-range migration of dispersed clay particles into the soil pores Chen Y, et al. [29]. In reference Marchuk A, et al. [30], they worked on changes of pore size distributions in a sandy loam soil contained monovalent cations (Na and K) using X-ray tomography, and found non-connected pores filled with dispersed clay particles. In reference Marchuk S, et al. [31], they studied two soils (sandy loam and clay) as influenced by K treatments and reported that large pores (17.4–69.2 μm) decreased with increase in K concentration, while small pores (0–17.4 μm) increased.
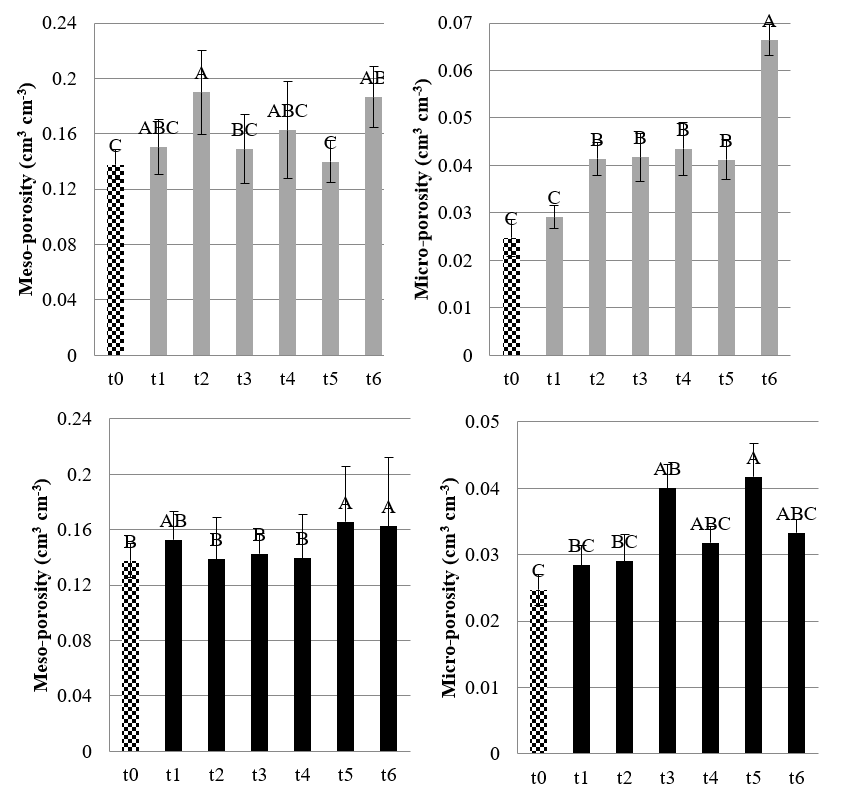
Grey Columns: EC=3 dS m-1; Black Columns: EC=6 dS m-1; T1 to T6 Indicate the Treatments (Concentration Of 13.6 to 27.2 and 27.2 to 54.4 cmolc kg-1 at two EC Levels) and T0 is the Original Soil. In Each Chart Same Letters are Not Statistically Significant at P<0.05. Error Bars Indicate ± 1 Standard Error.
Results of the fitted parameters of van Genuchten model, see [23], on water retention data demonstrated that PAW(FC- PWP) increased with increasing K concentration, and PAW of the treated soils were larger than in the original soil at both EC levels (Table 2). This observation was because of clay dispersion impacts on soil structure, in particular on soil pore size, which discussed earlier. The maximum PAW were attributed to the highest K amounts at both EC (Table 2).
| EC dS m-1 | Treatments | PAW (cm3 cm-3) |
|---|---|---|
| Original soil | 0.133B | |
| 3 | t1 | 0.179AB |
| t2 | 0.231A | |
| t3 | 0.191AB | |
| t4 | 0.206AB | |
| t5 | 0.171AB | |
| t6 | 0.253A | |
| 6 | t1 | 0.182AB |
| t2 | 0.168AB | |
| t3 | 0.183AB | |
| t4 | 0.171AB | |
| t5 | 0.208A | |
| t6 | 0.196AB |
Table 2: Values of PAW in the Treated Samples and the Original Soil.
In each column same letters are not statistically significant at p<0.05. Table 2: Values of PAW in the Treated Samples and the Original Soil.
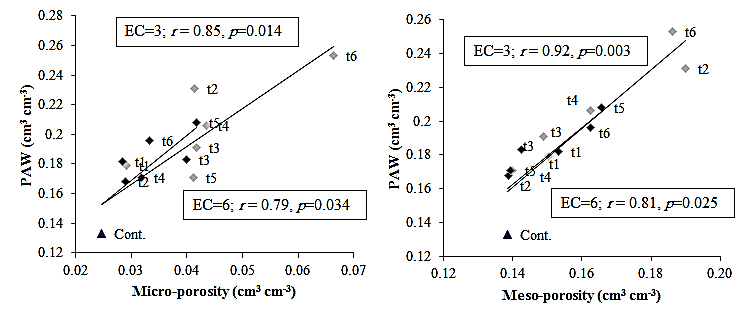
Grey symbols: EC=3 dS m-1; black symbols: EC=6 dS m-1; t1 to t6 indicate the treatments (concentration of 13.6 to 27.2 and 27.2 to 54.4 cmolc kg-1 at two EC levels) and Cont. is the original soil.
The PAW and the meso- and micro-porosity positively related at both EC (Figure 3). As discussed earlier, the soil pore size became smaller in most of the treated samples due to clay dispersion, therefore increase in PAW with increasing the meso- and micro-porosity seems logical. Since smaller pores are responsible for water retention at matric suctions of 100 and 15000 hPa (equivalent to FC and PWP, respectively), water contents at FC and PWP were effective on calculation of PAW in this study. The more water retention at FC and PWP, the more PAW amounts. In comparison with the original soil, maximum increments in FC and PWP were observed in the treatments included highest K concentrations at both EC.
In reference Nang ND, et al. [32], they worked on changing PAW in a salt affected Australian soil, and found the highest PAW in the samples with maximum dispersible clay, and justified the shift toward smaller pores was a result of clay dispersion. Furthermore, in Zangiabadi M, et al. [33], they studied the effect of soil pore size distributions on PAW values in 30 different soils from northeastern Iran and demonstrated reduction of soil pores diameter resulted in increase of soil water retention and PAW. However, in Hardy SM [34], they studied sodic soils (with high ESP values), and reported that high concentration of Na led to reduction in PAW, it is in contrast to our findings. High amounts of ESP collapse soil structure and block the soil pores McMullen B [35], which results in PAW reduction.
The shoot:root ratio of maize, as an index of crop growth, enhanced significantly with increasing PAW at EC = 6 dS m-1 (shoot:root = 25.847 PAW - 1.3066, R² = 0.64, p=0.03), whereas no significant relationship was observed at EC = 3 dS m-1. This indicated that crop growth conditions were improved in the treated soils at higher EC level. Generally, negative impacts of clay dispersion on soil structure have been reported in previous literature, however, in this study, a positive impact on plant available water and plant growth was found, because clay dispersion increased water retention. The effects of clay dispersion on soil functions are complicated and dependent on cation concentration Marchuk A, et al. [36], EC [28, 29, 30, 31, 32, 33, 34, 35, 36], soil texture Rengasamy P, et al. [37] and clay mineralogy Farahani E, et al. [38]. In our study, clay dispersion caused by cations and increased water retention and PAW. Because water retention was the physical plant growth limiting factor, plant growth conditions were improved, and plant growth increased by clay dispersion at EC = 6 dS m−1. However at EC = 3 dS m−1, according to root weight data (unpublished data) root development decreased due to the higher clay dispersion and soil hardening and therefore, plant growth did not increase although PAW increased. Consequently, as long as the dispersed clay does not increase resistance against root growth, the increase in water retention, due to change in soil pore size by migration of the dispersed clay particles, may positively influence physical crop growth conditions in arid/semi-arid regions of northeastern Iran.
The Experiment of Relationship between Soil Pore Size, SOC and Crop Growth in Two Tillage Systems
Measurements: According to Farahani et al. [39], plots of tillage systems (conventional and no-till), included wheat- maize rotations and cover crop cultivation, were established in 2017 at the “Agricultural and Natural Resources Research Center”, northeastern Iran (Table 3). The initial SOC content was 0.36% in the studied soil, which is clearly low but looks typical in the arid/semiarid regions of Iran, since 61.6% of agricultural soils contain less than 1% SOC Moshiri F, et al. [40]. No-tillage (NT) included completely avoiding any tillage practice, and seed was sown with a no-till drill and normal row planters for wheat and maize, respectively. In conventional tillage (CT), tillage was done with mouldboard plow (to 25 cm depth), followed by tandem disking twice (to 10 cm depth). Pneumatic precision seeders and row planters were used to grow maize and wheat, respectively.
| Clay (%) | Silt | Sand | CaCO3 | SOC | Ece (dS m-1) | pHs |
|---|---|---|---|---|---|---|
| 35.92 | 29.28 | 34.8 | 11.03 | 0.36 | 1.27 | 7.39 |
Table 3: Physical and Chemical Properties of the Initial Soil.
SOC=soil organic carbon; ECe= electrical conductivity of saturated extract; pHs= pH of saturated paste. Table 3: Physical and Chemical Properties of the Initial Soil.
Details of crop and cover crop (clover) cultivation from the start of the experiment (2017) to sampling (2020) were as follows: wheat was cultivated and harvested in November 2017 and June 2018, respectively. Clover was sown in July 2018 using a wintersteiger drill in NT, and was harvested in May 2019 with a mower. Maize was grown and harvested in June and October 2019, respectively. Wheat in a rotation was planted and harvested in November 2019 and June 2020, respectively. In CT treatments only stubble of the crop was left on the plots, while crop residues were retained and mixed with the soil surface in NT after clover harvest. Soil sampling was done in July 2020 (after wheat harvest) with two sampling depths (0–15 and 15–30 cm) and three replications in a randomized complete block design in both tillage systems.
Percentage of micro- and macro-aggregates (<250 and >250 μm, respectively), as influenced by SOC content, was determined with the 0.25 mm sieve. Air-dried aggregates were put on the sieve and shaken in dry condition and the amount of micro- and macro-aggregates was calculated as mass of aggregates that passed the sieve and the aggregates on the sieve, respectively, divided by total mass of the soil sample Totsche KU, et al. [41]. SOC content in the samples were determined using wet oxidation method Walkley A, et al. [42]. Root growth condition has also been assessed by root residue evidence in the tillage plots.
To investigate soil pore system, 3-dimensional X-ray imaging was performed with a medical scanner (Planmeca Viso G7 - Helsinki, Finland). Three replicates for each soil depth (0–15 and 15–30 cm) of undisturbed core samples (with a diameter and height of 4.5 and 6.25 cm; 100 cm3) were scanned in air-dry condition. The voxel size was 75 μm, maximum X-ray energy of 100 kV and 100 mA was used to scan each soil core.
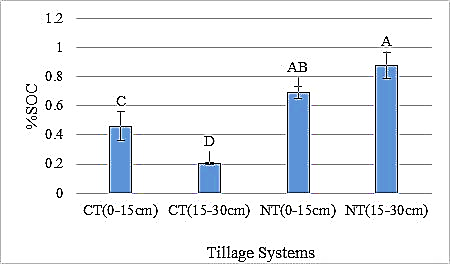
Data Interpretation: The SOC content after 3 years of establishment (2017–2020) increased significantly compared to the initial soil, however NT plots showed higher SOC content than CT (Figure 4). NT had 92% and 144% increase of SOC at 0–15 and 15–30 cm depth, respectively, in comparison with the initial soil (Tables 3 & Figure 4). Apparently in NT system, the amelioration of physical conditions encouraged root growth in the depth of 15–30 cm, thus root residues content and SOC was increased at this depth after harvesting the plants. An increase of SOC by 28% in CT (0– 15 cm) compared to the initial soil can be attributed to the mixing crop root residues with the soil within the tillage layer of 25 cm. Although, in CT (15–30 cm) 44% decrease in SOC was observed compared to the initial soil, possibly due to the decomposition of organic matter by tillage practices.
The higher SOC content in NT compared to CT was mostly due to the cover crop (clover) cultivation and crop residues retention in NT system. Cover crops increase SOC content and improve soil properties, leading to more biomass carbon input and extending the advantages of conservation tillage. Seeding cover crops after wheat harvest enhanced SOC in a NT system with wheat–sorghum rotation in Kansas Blanco- Canqui H, et al. [43]. Soils in arid/semiarid areas mostly contain low SOC contents, therefore clay particles can present great impact on soil structure and create organo-mineral complexes, which help with organic matter accumulation Levy GJ, et al. [44]. It was observed that soil structural stability correlated with clay content, and this relationship being stronger in clay contents of ≥35%. High structural stability indices has been reported in two soils contained 38% and 45% clay and 46% and 30% sand, respectively. It means sand content will not influence soil stability if clay content is high enough to ameliorate structural stability [44]. Clay content of the studied soil was 36% (Table 3) and could increase the SOC content in NT, consisted of crop residues retention, compared to the initial soil. Higher clay contents in soils may cause more molecules of organic carbon to adsorb on clay particle surfaces and form more organo- mineral complexes, which consequently can protect SOC from microbial and enzymatic decomposition and increase SOC storage Jagadamma S, et al. [45, 46].
SOC influences porosity and pore size distribution, for example, in Emerson WW, et al. [47], they found enhancement of pore size with increasing SOC percentage in two sandy and silty soils. It was demonstrated that greater SOC content increased soil physical quality indices, especially pore size distribution functions. Aggregate size could also be regarded as a structural stability index in soils, which may be influenced by SOC content Reynolds WD, et al. [48, 49]. Trend of macro-aggregates changes among the treatments in NT and CT systems was similar to the SOC contents in our study, implying that NT (at both depths) with higher SOC had more macro-aggregates. The lowest percentage of macro- aggregates also belonged to CT in depth of 15-30 cm, with the lowest SOC (Figure 4 & Table 4). In reference [43], they found that increasing SOC developed macro-aggregation, hence soil aggregate size can increase by 1.5 mm when SOC increases by 1%, and pore size between aggregates can also increase. A study in a semi-arid region of China compared conventional and conservation tillage and reported that macro-aggregates percentage increased by 41.2% and 56.6% for no-till system without and with crop residue retention, respectively Wu J, et al. [50]. They also mentioned that macro-aggregates are the major pools of SOC and total nitrogen. Therefore, it can be inferred from our results that the highest SOC in NT produced more macro-aggregates at both depths.
| Treatments and Depths | micro-aggregates (<250 μm) % | macro-aggregates (>250 μm) % |
|---|---|---|
| CT (0-15) | 4.6b | 95.4c |
| CT (15-30) | 6.5a | 93.5d |
| NT (0-15) | 2.6c | 97.4b |
| NT (15-30) | 1.6d | 98.5a |
Table 4: Mean Comparison of Percentages of Micro- and Macro-Aggregates of the Treatment Plots.
CT=conventional tillage; NT=no-tillage; Different letters were statistically different in p<0.05. Table 4: Mean Comparison of Percentages of Micro- and Macro-Aggregates of the Treatment Plots.
According to cross-sectional X-ray images of the soil pores (Figure 5), the core samples at depth of 0–15 cm had a lower soil pore volume than those at 15–30 cm in both tillage systems. Regardless of soil depth, CT had a higher total porosity compared to NT, which is due to ploughing the soil in CT system. Moreover, the highest total porosity was observed in CT (15–30), revealed that it had the lowest compaction (bulk density) among the treatments (values of bulk density in the treatments were not significantly different in this study, so not shown). In general, low soil porosity and high bulk density in a NT system can originate from the absence of soil disturbance Bescansa P, et al. [51, 52, 53, 54]. The loose soil structure of ploughed horizons typically has an isotropic, well-connected pore system, whereas pores in unploughed soils may be more anisotropic and less connected Schlüter S, et al. [55]. Furthermore, in CT (0-15) moderate soil compaction caused by tillage machineries in soil surface, resulted in lower total porosity compared to the subsoil (Figure 5). The greater subsoil porosity in tillage systems could be attributed to soil moisture distribution during growing season in arid/semi-arid region of northeastern Iran. According to measurement of the in situ water content during the experiment, the surface soils had lower moisture than the subsoil in both tillage systems. This probably caused by high evaporation from the soil surface (0–15 cm depth) in spring and summer (corresponds to the most of vegetative and reproductive growth of winter wheat) in arid/semi-arid region of northeastern Iran. In reference Enkova LK, et al. [56], they studied three agricultural soils in western Slovakia (with different textures and SOC) and reported that the more soil moisture the more porosity. Moreover, the soil moisture distribution at different depths could potentially influence root growth. In Hodgkinson L, et al. [57] it was reported that root growth and development was higher under moist condition. Therefore, it can be assumed that there was less root growth and root canals at the depth of 0–15 cm compared to the depth of 15– 30 cm in our study.
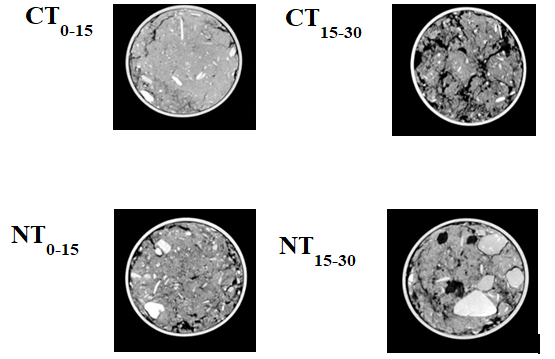
(Dark areas = pores, grey areas = solids, white areas = gravels), CT: conventional tillage; NT: no-tillage. Figure 5: X-Ray Computed Tomography Images of Soil Pores for the Treatments at Two Depths (0–15 and 15–30 cm).
Root density could be a possible reason for the non- significant differences in bulk density values in our study. Based on the visible big root canals in X-ray images in NT (15-30), it apparently had better plant growth and higher root density than CT. The cultivation of cover crop, more SOC, and therefore the stable aggregates increased root growth in NT system. Soil loosening through tillage practices in CT and root density and SOC in NT may therefore explain a non- significant difference in bulk density in two tillage systems. Cover crops created continuous macro-pores and increased air-filled porosity at low matric suctions in a no-till system [25].
Conclusions
- In first part of our study, clay dispersion created short-range migration of dispersed clay particles into the large pores, as a result soil pore size distribution shifted towards smaller pores (meso- and micro-pores). Therefore, PAW increased by changing of soil pore size distribution, the more meso-/micro-pores, the more water retention.
- A positive impact of clay dispersion on PAW and plant growth was found in this study, because of increase in water retention. It revealed that depending on how dispersed clay particles influence soil structure especially pore size distribution, an improving role of clay dispersion on soil functions may be expected.
- In second part of our study, application of NT (included seeding clover (cover crop) along with retaining crop residues on the soil surface) maximized SOC to 144% compared to the initial soil and in turn resulted in the highest amount of macro-aggregates and pore diameter compared to CT.
- X-ray imaging provided a comprehensive view of the changes in soil structure due to tillage systems and proved the advantages of conservation tillage compared to conventional ploughing in the arid/semi-arid regions of Iran.
- Therefore, it can be concluded that NT system with cover crop cultivation and crop residue retention could be recommended in arid/semi-arid regions of northeastern Iran to enhance SOC content and consequently improve soil structure, increase aggregate and pore size and finally promote plant growth.
- According to our findings, soil pore size distribution as a soil physical attribute showed essential roles on plant growth through improving soil water retention and root growth condition in our first and second study, respectively. It was observed that the effect of soil pore size distribution was mostly physical without any proved microbial or biotic interaction, thus it can be concluded that soil pore size may have important and unique role on plant growth in arid/semi-arid regions of Iran.
References
-
Shein EV, Skvortsova EB, Dembovetskii AV, Abrosimov KN, Il’In LI, et al. (2016) Pore-size distribution in loamy soils: A comparison between microtomographic and capillarimetric determination methods. Eurasian Soil Science 49: 315-25.
-
Guo Y, Fan R, Zhang X, Zhang Y, Wu D, et al. (2020) Tillage- induced effects on SOC through changes in aggregate stability and soil pore structure. Science of the Total Environment 703: 134617-134625.
-
Asgarzadeh H, Mosaddeghi MR, Mahboubi AA, Nosrati A, Dexter AR (2010) Soil water availability for plants as quantified by conventional available water, least limiting water range and integral water capacity. Plant and soil 335: 229-244.
-
Kirkham MB (2005) Principles of soil and plant water relations. In: 2nd (Edn), Elsevier, Netherlands.
-
Farahani E, Emami H, Fotovat A, Khorassani R, Keller T (2020) Soil available water and plant growth in relation to K: Na ratio. Geoderma 363: 114173-114180.
-
Emami H, Astaraei AR, Fotovat A, Khotabaei M (2014) Effect of soil conditioners on cation ratio of soil structural stability, structural stability indicators in a sodic soil, and on dry weight of maize. Arid Land Research and Management 28(3): 325-339.
-
Farahani E, Emami H, Keller T, Fotovat A, Khorassani R (2018) Impact of monovalent cations on soil structure Part I Results of an Iranian soil. International Agrophysics 32(1): 52-67.
-
Dexter AR, Czyż EA (2000) Soil physical quality and the effects of management. In Soil Quality, Sustainable Agriculture and Environmental Security in Central and Eastern Europe. Dordrecht: Springer Netherlands, pp: 153-165.
-
Czyz EA, Dexter AR, Terelak H, Pagliai M, Jones R (2002) Content of readily-dispersible clay in the arable layer of some Polish soils. Sustainable Land Management- Environmental Protection-A Soil Physical Approach. Advances in Geoecology Catena Verlag Germany 35: 115- 124.
-
Amiri E, Emami H, Mosaddeghi MR, Astaraei AR (2019) Shear strength of an unsaturated loam soil as affected by vetiver and polyacrylamide. Soil and Tillage Research 194: 104331-104338.
-
Shahab H, Emami H, Haghnia GH (2018) Effects of gully erosion on soil quality indices in northwestern Iran. Journal of Agricultural Science and Technology 20(6): 1317-1329.
-
Gholoubi A, Emami H, Alizadeh A, Azadi R (2019) Long term effects of deforestation on soil attributes: case study, Northern Iran. Caspian Journal of Environmental Sciences 17(1): 73-81.
-
Chenu C, Le Bissonnais Y, Arrouays D (2000) Organic matter influence on clay wettability and soil aggregate stability. Soil Science Society of America Journal 64(4): 1479-1486.
-
Marinari S, Masciandaro G, Ceccanti B, Grego S (2000) Influence of organic and mineral fertilisers on soil biological and physical properties. Bioresource technology 72(1): 9-17.
-
Bhattacharyya R, Kundu S, Pandey SC, Singh KP, Gupta HS (2008) Tillage and irrigation effects on crop yields and soil properties under the rice–wheat system in the Indian Himalayas. Agricultural water management 95(9): 993-1002.
-
Martínez E, Fuentes JP, Silva P, Valle S, Acevedo E (2008) Soil physical properties and wheat root growth as affected by no-tillage and conventional tillage systems in a Mediterranean environment of Chile. Soil and Tillage Research 99(2): 232-244.
-
Bhattacharyya R, Prakash V, Kundu S, Gupta HS (2006) Effect of tillage and crop rotations on pore size distribution and soil hydraulic conductivity in sandy clay loam soil of the Indian Himalayas. Soil and Tillage Research 86(2): 129-40.
-
Lampurlanés J, Angás P, Cantero-Martınez C (2001) Root growth, soil water content and yield of barley under different tillage systems on two soils in semiarid conditions. Field Crops Research 69(1): 27-40.
-
Liu K, Wiatrak P (2011) Corn production and plant characteristics response to N fertilization management in dry-land conventional tillage system. International Journal of Plant Production 5(4): 405-416.
-
Abdollahi L, Munkholm LJ, Garbout A (2014) Tillage system and cover crop effects on soil quality: II. Pore characteristics. Soil Science Society of America Journal 78(1): 271-279.
-
Garbout A, Munkholm LJ, Hansen SB (2013) Tillage effects on topsoil structural quality assessed using X-ray CT, soil cores and visual soil evaluation. Soil and Tillage Research 128: 104-109.
-
Jarvis N, Forkman J, Koestel J, Kätterer T, Larsbo M, et al. (2017) Long-term effects of grass-clover leys on the structure of a silt loam soil in a cold climate. Agriculture, Ecosystems & Environment 247: 319-328.
-
Van Genuchten MT (1980) A closed‐form equation for predicting the hydraulic conductivity of unsaturated soils. Soil science society of America journal 44(5): 892- 898.
-
Van Genuchten MV, Leij FJ, Yates SR (1991) The RETC code for quantifying the hydraulic functions of unsaturated soils. Environmental Protection Agency 600: 2-91.
-
Asgarzadeh H, Mosaddeghi MR, Nikbakht AM (2014) SAWCal: A user-friendly program for calculating soil available water quantities and physical quality indices. Computers and electronics in agriculture 109: 86-93.
-
Marshall TJ (1959) Relations between water and soil. Commonwealth Agricultural Bureau, England.
-
Marchuk A, Rengasamy P, McNeill A (2013) Influence of organic matter, clay mineralogy, and pH on the effects of CROSS on soil structure is related to the zeta potential of the dispersed clay. Soil Research 51(1): 34-40.
-
Quirk JP, Schofield RK (1955) The effect of electrolyte concentration on soil permeability. Journal of Soil science 6(2): 163-178.
-
Chen Y, Banin A (1975) Scanning electron microscope (SEM) observations of soil structure changes induced by sodium-calcium exchange in relation to hydraulic conductivity. Soil Science 120(6): 428-436.
-
Marchuk A, Rengasamy P, McNeill A, Kumar A (2013) Nature of the clay–cation bond affects soil structure as verified by X-ray computed tomography. Soil Research 50(8): 638-644.
-
Marchuk S, Marchuk A (2018) Effect of applied potassium concentration on clay dispersion, hydraulic conductivity, pore structure and mineralogy of two contrasting Australian soils. Soil and Tillage Research 182: 35-44.
-
Nang ND (2012) Plant Availability of Water in Soils Being Reclaimed from the Saline-sodic State. Adelaide University, Adelaide, Australia.
-
Zangiabadi M, Gorji M, Shorafa M, Khorasani SK, Saadat S (2020) Effect of soil pore size distribution on plant- available water and least limiting water range as soil physical quality indicators. Pedosphere 30(2): 253-262.
-
Hardy SM (2004) Soil sodicity and plant available water capacity maps used to plan sugarcane expansion and potential irrigation requirements in central Queensland. In: 13th (Edn), International Soil Conservation Organization Conference, Brisbane, Australia pp: 4-8.
-
McMullen B (2000) SOILpak for vegetable growers. In: 1st (Edn), NSW Agriculture, New South Wales, Australia.
-
Marchuk A, Rengasamy P (2012) Threshold electrolyte concentration and dispersive potential in relation to CROSS in dispersive soils. Soil Research 50(6): 473-481.
-
Rengasamy P, Marchuk A (2011) Cation ratio of soil structural stability (CROSS). Soil Research 49(3): 280- 285.
-
Farahani E, Emami H, Keller T (2018) Impact of monovalent cations on soil structure Part II Results of two Swiss soils. International Agrophysics 32(1): 69-80.
-
Farahani E, Emami H, Forouhar M (2022) Effects of tillage systems on soil organic carbon and some soil physical properties. Land Degradation & Development 33(8): 1307-1320.
-
Moshiri F, Samavat S, Balali MR (2017) Soil organic carbon: a key factor of sustainable agriculture in Iran. Global Symposium on Soil Organic Carbon pp: 21-23.
-
Totsche KU, Amelung W, Gerzabek MH, Guggenberger G, Klumpp E, et al. (2018 ) Microaggregates in soils. Journal of Plant Nutrition and Soil Science 181(1): 104-36.
-
Walkley A, Black IA (1934) An examination of the Degtjareff method for determining soil organic matter, and a proposed modification of the chromic acid titration method. Soil science 37(1): 29-38.
-
Blanco-Canqui H, Shapiro CA, Wortmann CS, Drijber RA, Mamo M (2013) Soil organic carbon: The value to soil properties. Journal of Soil and Water Conservation 68(5): 129-134.
-
Levy GJ, Mamedov AI (2002) High‐energy‐moisture‐ characteristic aggregate stability as a predictor for seal formation. Soil Science Society of America Journal 66(5): 1603-1609.
-
Jagadamma S, Lal R (2010) Distribution of organic carbon in physical fractions of soils as affected by agricultural management. Biology and Fertility of Soils 46: 543-554.
-
Zaffar M, Sheng-Gao LU (2015) Pore size distribution of clayey soils and its correlation with soil organic matter. Pedosphere 25(2): 240-249.
-
Emerson WW, McGarry D (2003) Organic carbon and soil porosity. Soil Research 41(1): 107-118.
-
Reynolds WD, Drury CF, Tan CS, Fox CA, Yang XM (2009) Use of indicators and pore volume-function characteristics to quantify soil physical quality. Geoderma 152(3-4): 252-263.
-
Shahab H, Emami H, Haghnia GH, Karimi A (2013) Pore size distribution as a soil physical quality index for agricultural and pasture soils in northeastern Iran. Pedosphere 23(3): 312-320.
-
Wu J, Stephen Y, Cai L, Zhang R, Qi P, et al. (2019) Effects of different tillage and straw retention practices on soil aggregates and carbon and nitrogen sequestration in soils of the northwestern China. Journal of Arid Land 11: 567-578.
-
Bescansa P, Imaz MJ, Virto I, Enrique A, Hoogmoed WB (2006) Soil water retention as affected by tillage and residue management in semiarid Spain. Soil and Tillage Research 87(1): 19-27.
-
Moret D, Arrúe JL (2007) Dynamics of soil hydraulic properties during fallow as affected by tillage. Soil and tillage research 96(1-2): 103-113.
-
Celik I, Turgut MM, Acir N (2012) Crop rotation and tillage effects on selected soil physical properties of a Typic Haploxerert in an irrigated semi-arid Mediterranean region. International Journal of Plant Production 6(4): 457-480.
-
Guedes Filho O, Blanco-Canqui H, Da Silva AP (2013) Least limiting water range of the soil seedbed for long- term tillage and cropping systems in the central Great Plains, USA. Geoderma 207: 99-110.
-
Schlüter S, Großmann C, Diel J, Wu GM, Tischer S, et al. (2018) Long-term effects of conventional and reduced tillage on soil structure, soil ecological and soil hydraulic properties. Geoderma 332: 10-19.
-
Enkova LK, Urik M (2012) Soil moisture and its effect on bulk density and porosity of intact aggregates of three Mollic soils. Indian Journal of Agricultural Sciences 82(2): 172-176.
-
Hodgkinson L, Dodd IC, Binley A, Ashton RW, White RP, et al. (2017) Root growth in field-grown winter wheat: some effects of soil conditions, season and genotype. European Journal of Agronomy 91: 74-83.
- Enhancement of Vegetative Growth and Fruit Yield in Cucumber (Cucumis sativus L.) via Spiritual Blessing (Biofield) Energy Intervention
- Production of Açaí (Euterpe oleracea Mart.) under Different Agroforestry System Management Intensities in Amazonian Floodplain (Varzea) Forests
- Coffee and the Production Region: What is the Secret to the Expression "Quality"?
- Experiential Agripreneurship Training in Sub-Saharan Africa: Integrating a Business Incubator into Postgraduate Livestock Education at the University of Buea
- Advances in Agricultural High-Quality Development
- Linking Compost Residue to ABAGE in Plants - a Short Note