Optimization and Formulation Design with In-Vitro Evaluation of Fast Disintegrating Tablets Containing Candesartan Solid Dispersions
The aim of this study was to assess the effects of processing parameters on the release of solid dispersion formulation from a fast dissolving tablet dosage form. Graphical and mathematical analysis such as the response surface methodology (RSM) and multiple response optimizations utilizing the polynomial equation were used to search for the optimal formulation and to quantify the effect of each formulation variables. To optimize the influence of superdisintegrant (crospovidone) and subliming agent (camphor) on the prediction of disintegration time (Y1), percentage friability (Y2) and wetting time (Y3), a two factor, three levels (32) full factorial design was used. Results of multiple regression analysis revealed that an optimum concentration of camphor and a higher percentage of crospovidone are required for obtaining rapidly disintegrating tablets. The optimized formulation was subsequently subjected to a short-term accelerated stability study. Processing parameters have shown a profound effect on the release of solid dispersion formulations from its hydrophilic carrier. The observed results of Y1, Y2 and Y3 coincided well with the predictions in the RSM optimization technique, indicating it was quite useful for optimizing pharmaceutical formulation. The release kinetic of drug from fast dissolving tablets followed the first-order release pattern. Experimental values obtained from the optimized formulations were in close to the predicted values, thus confirming the validity of the generated mathematical model. In conclusion, this study demonstrated the potential of statistical experimental design in elucidating the effects of the formulation variables on the rapidly disintegrating tablets containing solid dispersion of a hydrophobic drug
Introduction
Candesartan cilexetil is angiotensin II receptor antagonist widely used in the treatment of mild to moderate hypertension. It has low bioavailability, approximately 15% in humans, due to its low water solubility because of dissolution which becomes the rate limiting step for absorption and the quick release of candesartan in the gastrointestinal tract upon oral administration [1, 2, 3, 4, 5]. Therefore, the rapid oral candesartan absorption could be a prerequisite for the quick onset of its action. Several formulation approaches such as formulating the API in an amorphous form, crystal engineering, micronization or nanosizing, prodrugs, salt formation, cyclodextrins, solid dispersions or lipid based formulations, etc. of candesartan were developed [6, 7, 8, 9, 10, 11, 12, 13]. However,the dissolution rate and the oral bioavailability of candesartan from these formulations differed widely, methods were time consuming and costly and some formulations were bulky with poor flow characteristics and handling difficulties. Solid dispersions (SDs) of many lipophilic drugs with hydrophilic carrier matrix have been formulated for improving drug dissolution rate, which can be further improved by developing fast disintegrating tablets. Conventionally, fast-dissolving tablets are produced by superdisintegrants with key properties of fast absorption of water into the core of the tablets and disintegration of associated particles into individual components for fast dissolution [14, 15]. Maximizing pore structure of the tablets is another approach to develop fast dissolving tablets. Highly porous systems or porous excipients may absorb water faster giving faster disintegration that may prove advantageous to fast disintegrating tablets [16]. Since, a significant amount of time and efforts were involved to obtain meaningful results for a binary dispersion system by traditional experimental means, it is desirable to obtain an acceptable formulation using minimum amount of time and efforts. Factorial design is an efficient technique to find the relative significance of number of variables and their interaction on outcome of the study. The response surface methodology is a useful tool to obtain a suitable model with minimum experiments. Optimization procedure involving factorial designs and analysis of response surfaces is robust and a systematic tool used in developing different oral dosage formulations [17, 18, 19].
In this work, a two factor, three levels (32) full factorial design with nine experimental runs were performed to study the effects of formulation variables on the optimized fast disintegrating tablet formulations using optimized concentrations of disintegration-promoting and the subliming agent. Statistical models with interaction terms were derived to evaluate influence of crospovidone (X1) and camphor (X2) on tablet disintegration (Y1), percent friability (Y2) and wetting time (Y3). The optimized fast dissolving tablets were further subjected to physicochemical characterization, in-vitro release evaluation and accelerated stability studies.
Materials and Methods
Materials
Candesartan cilexatil (purity more than 99%, melting temperature =163° ± 0.5°C) was kindly donated as a generous gift by Dr.Reddy’s Labs, (Hyderabad, India). Polyvinyl pyrrolidone K30 was supplied by SD Fine Chem. Ltd, Mumbai, India. Crospovidone was purchased from Signet Chemicals Pvt. Ltd., Mumbai. Camphor and Lactose were obtained from Loba Chem. Pvt. Ltd, Mumbai. Magnessium stereate and Talc from Central Drug House (P) Ltd., Mumbai. All other chemicals and solvents were of analytical reagent grade.
Methods
Experimental Factorial Design: A 32 randomized full factorial design was used to investigate the influence of two formulation variables. In this design, 2 factors were evaluated, each at 3 levels and experimental trials were performed at all 9 possible combinations. The amounts of subliming agent, camphor (X1), and the superdisintegrant, crospovidone (X2), were selected as independent variables. The disintegration time, percentage friability and wetting time were selected as dependent variables. Checkpoint batch was also prepared to prove the validity of the evolved mathematical model. In addition, contour plots were used to graphically represent the effect of the independent variables.A statistical model incorporating interactive and polynomial terms was used to evaluate the responses. The responses were analyzed for ANOVA and 3D response graphs were constructed using Statgraphics® centurion XVI software. A mathematical model was generated for each response parameter and tested for significance. The behavior of the system was studied using response surface plots for each response under study.
Validation of statistical model: A statistical model, Y = b0 + b1X1 + b2X2 + b12X1X2 + b11 (X1)2 + b22(X 2)2, where Y is the dependent variables namely disintegration time, percentage friability and wetting time; b 0 is the arithmetic mean response of the 9 runs; and b1 and b2 are the estimated coefficients for the factors X1 and X2, respectively. The main effects (X1 and X2) represent the average result of changing one factor at a time from its low to high value. The polynomial terms (X1)2 and (X2)2 are included to investigate nonlinearity. An orthogonal design was used such that the factor levels were evenly spaced and coded for low, medium and high settings as −1, 0 and 1, respectively. Table 1 summarizes the dependent and independent variables evaluated and the constraints that were placed on the responses. The matrix of the factorial design is represented in Table 2. Each row in the matrix identifies an experiment and each experiment provides a result (response). The constant and regression coefficients were calculated using the same software.
| Constraints | |||||||||||||
|---|---|---|---|---|---|---|---|---|---|---|---|---|---|
| Name | Goal | Lower limit | Upper limit | ||||||||||
| Camphor | Is in range | -1 | 1 | ||||||||||
| Crospovidone | Is in rage | -1 | 1 | ||||||||||
| DT (s) | Is target =15 | 15 | 45 | ||||||||||
| Friability (%) | Is target = 0.6 | 0.51 | 0.63 | ||||||||||
| Wetting time (s) | Is target = 5 | 5 | 40 | ||||||||||
| Solution | |||||||||||||
| Camphor (X 1) | Crospovidone (X 2) | DT (s) | Friability (%) | Dissolution (%) | Desirability | ||||||||
| -0.51 | 0.63 | 29.56 | 0.599 | 92.99 | 0.998 |
Table 1: Summarizes the dependent and independent variables evaluated and the constraints that were placed on the responses.
| Experimental run | s | C | rospovidone (X 1 | ) | Camphor (X 2 | ) | ||
| 1 | -1 | 0 | ||||||
| 2 | 0 | 1 | ||||||
| 3 | 1 | 0 | ||||||
| 4 | -1 | -1 | ||||||
| 5 | 0 | -1 | ||||||
| 6 | 1 | -1 | ||||||
| 7 | 0 | 0 | ||||||
| 8 | -1 | 1 | ||||||
| 9 | 1 | 1 |
Table 2: Matrix of 32 full factorial designs. The polynomial equations derived from this optimization technique were used to pred
Table 2: Matrix of 32 full factorial designs. The polynomial equations derived from this optimization technique were used to predict the disintegration time, percentage friability and wetting time for fast disintegrating tablet formulations of candesartan in the experimental region. Fast dissolving tablets were prepared using these responses and measured practically. The predicted responses were evaluated against observed responses and closeness between them was verified. Response surface plots: Response surface plots were generated for each response to study the effect of both factors on each response.
Optimum formulation for fast dissolving tablets of candesartan: The optimized formulation was prepared with quantity of camphor and crospovidone as suggested by the Statgraphics® centurion XVI software. The optimized tablets were prepared and characterized for their physicochemical properties. Preparation of optimized tablets: Table 3 lists a typical fast disintegrating tablet formulation used in this study (Batch size was 10g). Tablets (100mg) containing selected solid dispersions were prepared by direct compression method. A minimum of 50 tablets were prepared for each batch. All formulations were prepared according to the matrix of the full factorial design varying the levels of the factors, i.e. concentration of disintegration-promoting agent (2-4% w/w) and concentration of subliming agents (3-9% w/w) as shown in Table 3. All the ingredients were passed through sieve no.6 and co-grounded in a glass mortar pestle for each formulation separately. The blend of excipients were compressed using a single punch tablet machine (Cadmach, Ahmedabad) to produce convex faced tablets weighing 100 mg each with 2 mm thickness and 11mm of diameter. Tablets were further subjected to drying under vacuum at 40oC for menthol and at 50oC for camphor to aid in sublimation and to increase tablet porosity.
| S. No | Ingredient | Quantity per tablet in mg | ||||||
| 1 | Candesartan cilexetil solid dispersion using PVPK30 (1:2) | 27 | ||||||
| 2 | Crospovidone | 2 | ||||||
| 3 | Camphor | 6 | ||||||
| 4 | Lactose | 17 | ||||||
| 5 | Mannitol | 20 | ||||||
| 6 | Avicel pH102 | 25 | ||||||
| 7 | Talc | 1 | ||||||
| 8 | Magnesium stearate | 2 |
Table 3: Typical Candesartan cilexetil fast disintegrating tablet formulation (100mg). Evaluation of the prepared optimized table
Table 3: Typical Candesartan cilexetil fast disintegrating tablet formulation (100mg). Evaluation of the prepared optimized tablets: All prepared optimized tablets were evaluated for uniformity of weight, hardness, friability and thickness according to official methods. Tablet thickness: Ten tablets were taken and their thickness was recorded using micrometer (Mityato, Japan). Uniformity of weight: As per IP, twenty tablets were taken and weighted individually and collectively using digital balance. The average weight of one tablet was calculated. The weight variation test would be satisfactory method of determining the drug content uniformity. Drug content was determined spectrophotometerically (V-530, JASCO, Japan) at 255 against Sorenson’s buffer as blank. Tablet hardness: Hardness of the tablets was determined by using Monsanto hardness tester. For a fast dissolving tablet, the hardness should be 1-3 kg/sqcm. Friability: Friability of the tablets was determined using Roche friabilator. This device subjects the tablets to the combined effect of abrasions and shock in a plastic chamber revolving at 25 rpm for 4 minutes and dropping the tablets at a height of 6 inch in each revolution. Pre-weighed sample of tablets was placed in the friabilator and were subjected to 100 revolutions. Tablets were de-dusted using a soft muslin cloth and reweighed. The friability (F%) is determined by the formula F %=( 1-w0/w) X100 Where, W 0 is initial weight of the tablets before the test and W is the weight of the tablets aftertest. Disintegration time: The disintegration time was measured using a modified disintegration method. In this test, a petri-dish (10-cm diameter) was filled with 10 mL of water. The tablet was carefully put in the center of the petri-dish and the time for the tablet to disintegrate completely into fine particles was noted.
Wetting time: A piece of tissue paper (12 cm X 10.75 cm) folded twice was placed in a small petri-dish (with internal diameter = 65 cm) containing 10 ml of Sorenson’s buffer (pH 6.8). A tablet was put on the paper and the time for the complete wetting was measured. Three trials for each batch were performed and the standard deviation was determined. In-vitro dispersion time: In vitro dispersion time was measured by dropping a tablet in a glass cylinder containing 6 ml of Sorenson’s buffer (pH 6.8). Three tablets from each formulation were randomly selected and in vitro dispersion time was performed. In Vitro drug release of optimized formulation 20: Dissolution of fast dissolving tablets in vivo is achieved in the mouth owing to the action of saliva, however amount of saliva in the mouth is limited and no tablet dissolution test was found in USP and IP to simulate in vivo conditions. A modified version of the simple but novel method developed was used to determine disintegration or dissolution time of the tablets [20]. A cylindrical vessel was used in which 10 mesh screen was placed in such way that only 2 ml of disintegrating or dissolution medium would be placed below the sieve. To determine dissolution, 6 ml of Sorenson’s buffer (pH 6.8), was placed inside the vessel in such way that 4 ml of the media was below the sieve and 2 ml above the sieve with temperature maintained at 37±1oC. Tablet was placed on the sieve and the whole assembly was placed on a shaker. Six milliliter aliquots were withdrawn at 0, 1, 2, 3, 4 and 5 min and an equal volume of fresh medium, pre-warmed at 37oC, was replaced into the dissolution media after each sampling to maintain the constant volume throughout the study. The collected samples were filtered, suitably diluted and analyzed at 255 nm using UV-visible spectrophotometer against the blank (Sorenson’s buffer). Mathematical drug release models: The best fit of the release data to zero and first order applied to determine the kinetics of drug release from optimized formulations. The following kinetic treatments were applied to the dissolution data to understand the release profile and release mechanism. Zero order kinetics: The slow release of drug during dissolution from dosage forms is represented by the equation Q t = Q 0+K 0t, Where Qt is the amount of drug dissolved in time t, Q 0 is the initial amount of drug in the medium (most times, Q=0) and K 0 is the zero order release constant. The exponential n equal to 1 is considered to follow zero order kinetics (case II transport). First order kinetics: The release profile of the drug proportional to the amount of drug remaining in its interior was first proposed by Gibaldi and Feldman (1967) and is given by the equation. Qt= Q0e-K1t ,where Q t is the amount of drug released in time t, Q0 is the initial amount of drug in the medium and K 1is the first order release constant For evaluation of release kinetics, the obtained release data were fitted into first and zero orderequations. Selection of the best model was based on the comparisons of the relevant correlationcoefficients.
Stability Studies
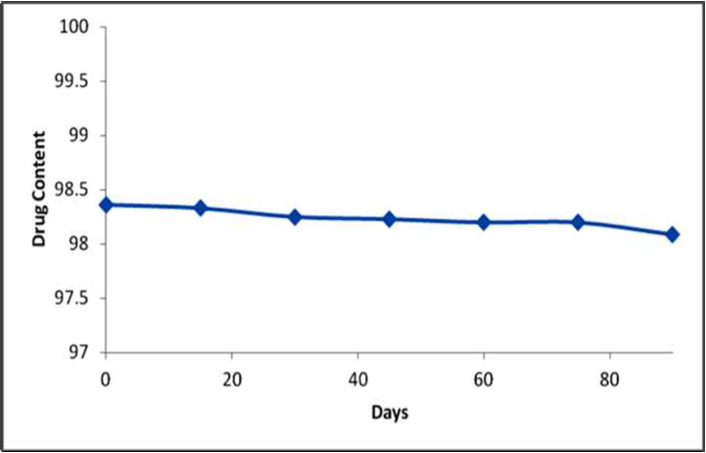
Temperature dependent stability studies: The optimized fast dissolving tablets of candesartan were packed in wide mouth air tight glass container and stored at (40 ± 2oC and 75 ± 5% RH) for a period of 3 months. The tablets were withdrawn periodically for 15 days and analyzed for physical characterization and drug content determination spectrophotometrically at 255 nm. Results are shown in Table 4. The similarity factor (f2) was used as a basis to compare dissolution profiles. The dissolution profiles of optimized formulation before and after stability testing were compared using a similarity factor (f2) which is calculated from the following formula:
f2=50.log{[1+(1/n)∑t=1n(Rt-Tt)2]-0.5.100} Where Rt and Tt indicate the cumulative percentage of formulation dissolved at each of the selected ‘n’ time points of the reference and test product respectively. When the two profiles are identical; f2 =100. An average difference of 10% at all measured time point’s results in an f2 value of 50. FDA has set a standard of f2 value between 50 and 100 to indicate similarity between two dissolution profiles.
| Temperature | |||||||||||||||||
|---|---|---|---|---|---|---|---|---|---|---|---|---|---|---|---|---|---|
| Days | |||||||||||||||||
| Weight | Hardness | Friability | Disintegration Time (s) | Drug Content | |||||||||||||
| 0 | 99.42 | 2.8 | 0.691 | 19 | 98.46 | ||||||||||||
| 15 | 99.41 | 2.8 | 0.702 | 19 | 98.31 | ||||||||||||
| 30 | 99.41 | 2.7 | 0.716 | 19 | 98.24 | ||||||||||||
| 45 | 98.89 | 2.7 | 0.714 | 18 | 98.23 | ||||||||||||
| 60 | 98.73 | 2.7 | 0.719 | 18 | 98.19 | ||||||||||||
| 75 | 98.61 | 2.7 | 0.734 | 18 | 98.19 | ||||||||||||
| 90 | 98.55 | 2.7 | 0.742 | 18 | 98.12 |
Table 4: Temperature dependent stability studies.
Results and Discussion
Outcome of Experimental Design
The results clearly indicate that the selected independent variables influence the disintegration time, percentage friability and wetting time values strongly. Based on the results obtained from this analysis and regression of statistically significant variables, statistical models were generated. The full model coefficients relating to disintegration time, percentage friability and wetting time are shown in (Table 5). The magnitude of coefficient and the mathematical sign (positive or negative) in the polynomial equations draw conclusions about synergistic and antagonistic effects. The significance of the model, at 5% significance level was estimated applying Analysis of variance (ANOVA). A model is considered significant if the p-value is less than 0.05. In addition, graphical analysis of responses was carried out. The results of the analysis of variance identified insignificant factors (Table 5). The coefficient values for disintegration time, percentage friability and wetting time indicate a good fit (Table 5). As a result, the estimates of response may be obtained from the equations like a relative small error of variance.
| Response | |||||||||||
|---|---|---|---|---|---|---|---|---|---|---|---|
| Model coefficients | |||||||||||
| Disintegration time | Percent friability | Wetting time | |||||||||
| b o | 41.8333 | 0.386667 | 10.1111 | ||||||||
| b 1 | 0.333333 | -0.0183333 | 0.833333 | ||||||||
| b 2 | -6.75 | -0.0405556 | -1 | ||||||||
| b 11 | -0.5 | -0.005 | -0.16667 | ||||||||
| b 12 | 0.25 | 0.005 | 0 | ||||||||
| b 22 | 0.333333 | 0.00444444 | 0.037037 |
Table 5: Summary of Regression Analysis Results. Figure: 1 summarizes the values for responses: Y1, disintegration time of fast d
Table 5: Summary of Regression Analysis Results. Figure: 1 summarizes the values for responses: Y1, disintegration time of fast disintegrating tablets (Figure 1a); Y2, percent friability of fast disintegrating tablets (Figure 1b); Y 3, wetting time of fast disintegrating tablets (Figure 1c). These data were analyzed using a statistical package (Statgraphics®, Version XVI) in order to generate mathematical models for each of the responses. The results of analysis for each response variable were as follows: Y1 (Disintegration time) = 41.8333 + 0.333333 X 1- 6.75 X2- 0.5 X22+0.25X 1X
2 Where F = 598.15, p = 0.001 and r2= 99.56; Y 2 (Friability percentage) = -1.26667 + 0.555556 X2 Where F = 96.75, p = 0.0221 and r2= 96.44; Y 3 (Wetting time) = 10.1111 - 1.0 X 2; Where F = 35, p = 0.0483 and r2= 93.90.
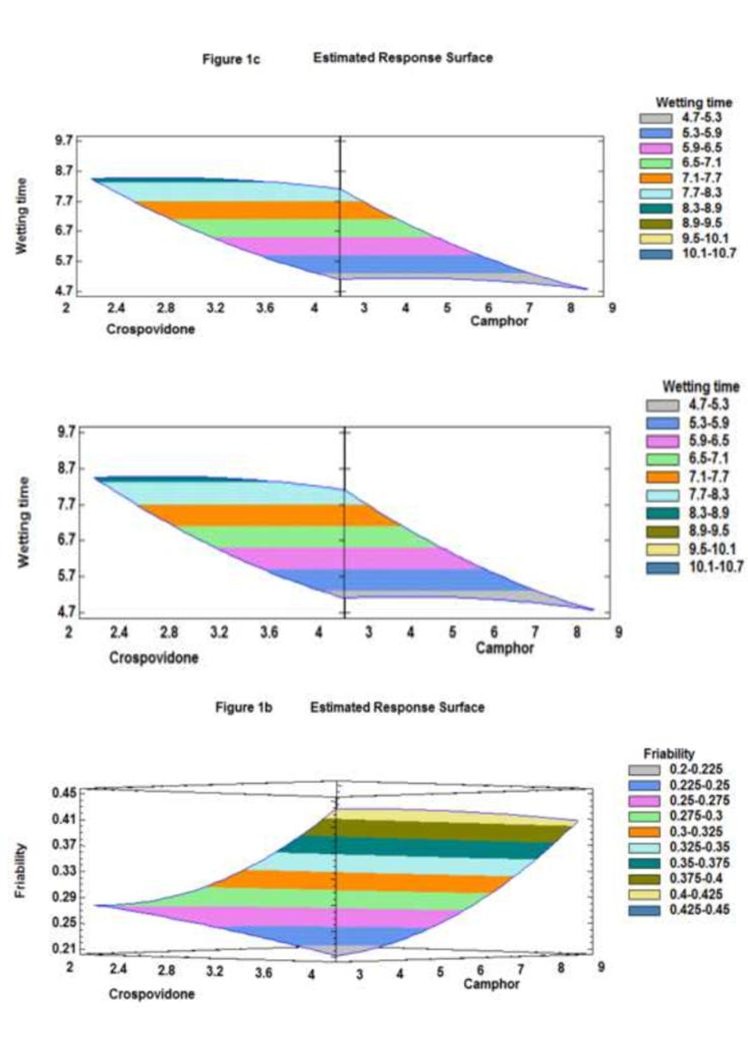
Figure 1a: Response surface plot showing the effect of X 1(crospovidone concentration) and X 2 (camphor concentration) on Y 1 (disintegration time of fast disintegrating tablets).
Figure 1b: Response surface plot showing the effect of X1(crospovidone concentration) and X2 (camphor concentration) on Y2 (% friability of fast disintegrating tablets).
Figure 1c: Response surface plot showing the effect of X1 (crospovidone concentration) and X2 (camphor concentration) on Y3 (wetting time of fast disintegrating tablets). The best-fit method was used to derive the above equations to describe quantitative effect of process variables (X1 and X2) and their interactions on the responses (Y1, Y2, Y3). The effects of these variables on the response were indicated by the values of the coefficients X1-X2 associated in the equations. Coefficients with more than one factor signify an interaction effect (e.g. X1X2) while those with higher order (e.g.X2) terms indicate quadratic relationships. A positive sign implies a synergistic effect while a negative sign stands for an antagonistic effect. These results of analysis allowed the important factors to be retained for the considered responses and thus the optimum factor level to be selected. The bar graphs were constructed in which the bars show synergistic (grey color) and antagonistic (blue color) effects of coefficients in the given model equations (Figures 2a-2c). Only statistically significant (p<0.05) coefficients were retained in the equations. It was noticed that selected independent variables (X1 and X2) had no interacting effect on dependent variables. The regression equations predicted responses for Y1 (99.56), Y2 (96.44), and Y3 (93.9) were within the confidence limits. The observed data at 95% confidence level using Lack of fit test (p-value greater than 0.05 for all the models) indicated that models were fitted adequately. The standard error of estimate for Y1, Y2, and Y 3 was 0.60, 0.024 and 0.60 respectively.
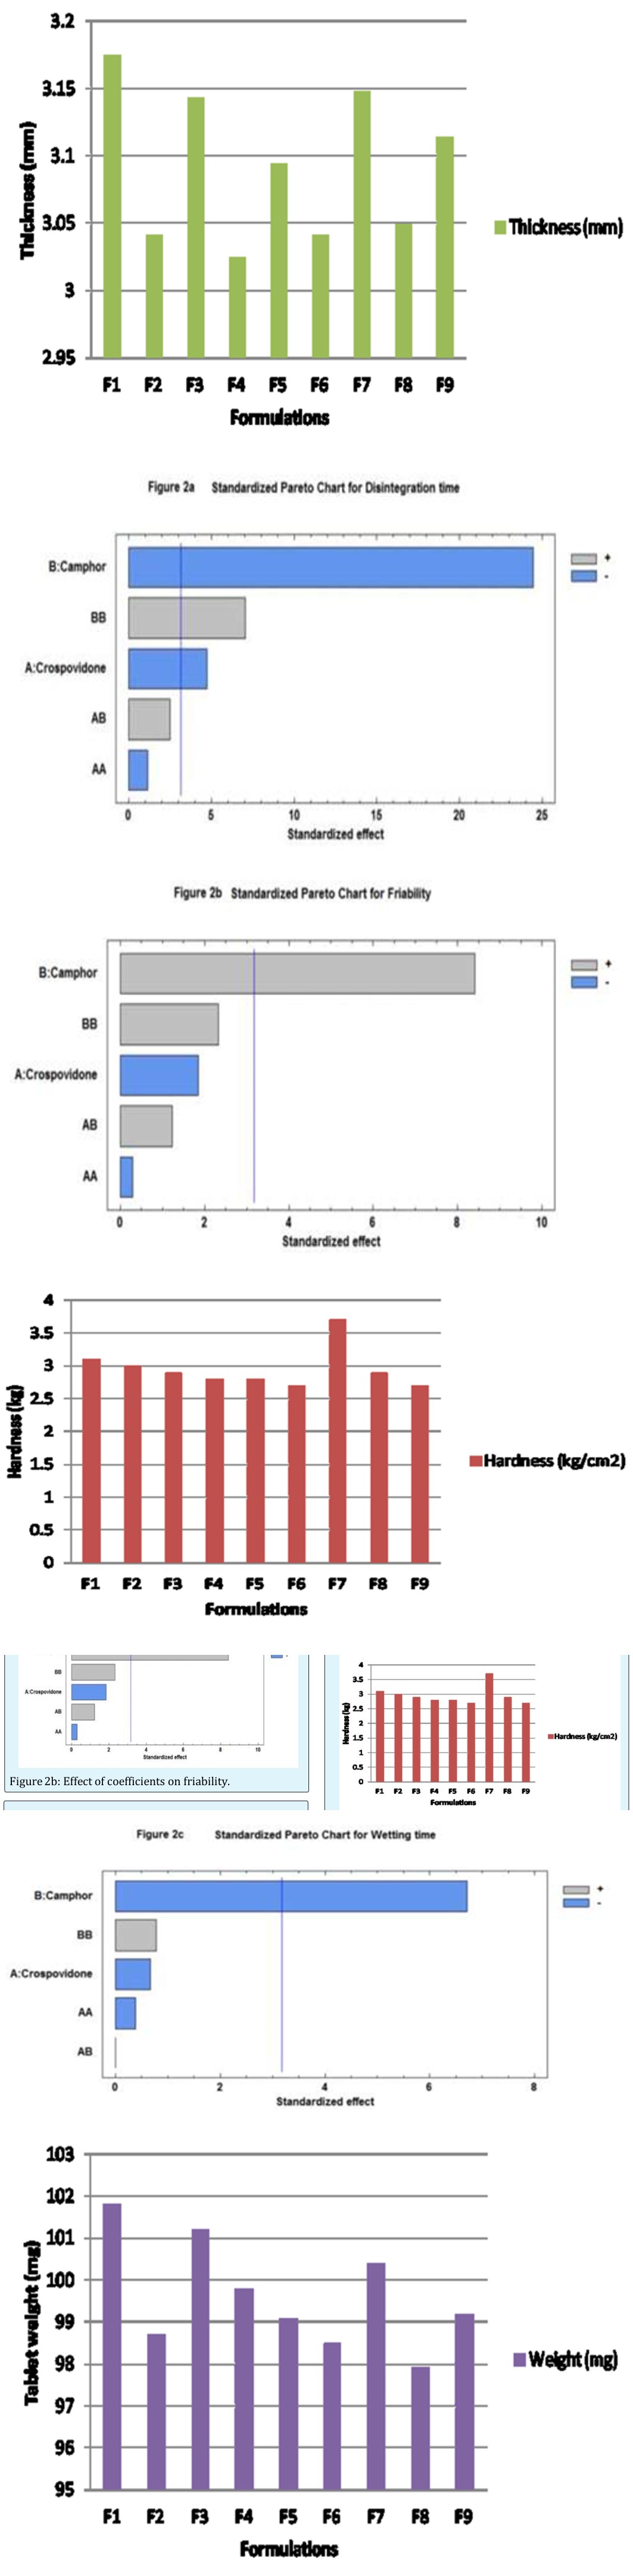
Figure 2a: Effect of coefficients on disintegration time.
Figure 3a: Thickness values of formulations according to the 32 full factorial design.
Figure 2c: Effect of coefficients on wetting time. Disintegration time, percent friability and wetting time values for all the nine formulations (Figure 3) varied from 10 to 25 s, 0.21 to 0.45% and 4.7 to 9.7 s respectively indicating that the selected variables have strong effect on disintegration time, percent friability and wetting time of the fast disintegrating tablets. These results were further validated applying analysis of variance for the responses (ANOVA) which indicated that assumed regression models were significant and applicable for each of the responses (p<0.05).
Figure 3b: Hardness values of formulations according to the 32 full factorial design.
Figure 3c: Tablet weight values of formulations according to the 32 full factorial design.
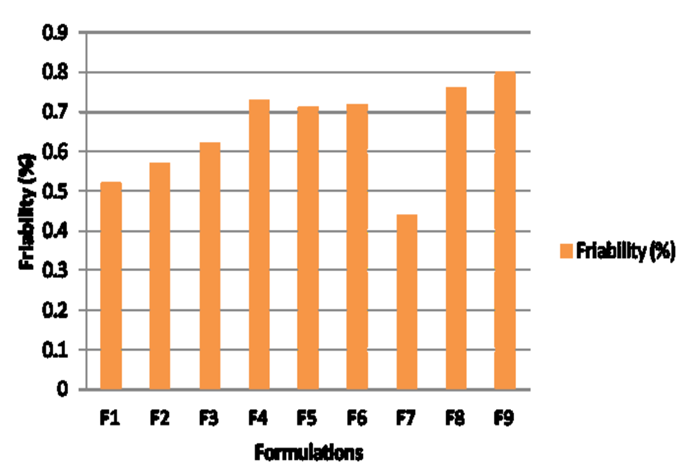
3d Figure 3d: Friability values of formulations according to the 32 full factorial design. One can conclude the factor X2 appears in all the three regression equations (1), (2) and (3). Hence, concentration of camphor (X2) (sublimant) was the main factor having an antagonistic effect on the disintegration and wetting time of an optimized formulation and synergistic effect on the friability of the optimized formulation. The Esq. (2)-(3) also indicate that friability and wetting time of fast disintegrating tablets were independent of concentration of crospovidone and any interaction among variables (X1 and X2). However, the effect of quadratic terms of the variable X2 was relevant only on disintegration time of the tablets (Y 1). This suggests that there is a curvature in the response. Goodness of fit of the model was considered statistically excellent with R2 values approaching to unity. R2 values were close to the unity for responses Y1, Y2 and Y3. The R-squared values for the responses Y1, Y2 and Y3 ranged from 93.90% to 99.56%. Hence, model was found statistically excellent for all three responses Y1,Y 2 and Y 3.
Evaluation of the Model Predictive Ability
In order to validate the predictive ability of the hypothesized model for each response around the optimized conditions, the agreement between predicted and observed responses was verified. The experimental and predicted values (Table 6) were within the confidence interval for each response, thus indicating statistical equivalence between experimental data and the predicted ones thus and demonstrating the validity of the applied model. Consequently, we can conclude that the statistical model is mathematically valid.
| Disintegration time | Percent friability | Wetting time | |||||||||||||||||
|---|---|---|---|---|---|---|---|---|---|---|---|---|---|---|---|---|---|---|---|
| Formulations | |||||||||||||||||||
| Observed | Predicted | Observed | Predicted | Observed | Predicted | ||||||||||||||
| 1 | 15 | 15 | 0.3 | 0.306667 | 7 | 6.44444 | |||||||||||||
| 2 | 12 | 11.3333 | 0.4 | 0.416667 | 5 | 5.11111 | |||||||||||||
| 3 | 13 | 12.6667 | 0.25 | 0.27 | 6 | 6.11111 | |||||||||||||
| 4 | 25 | 24.75 | 0.28 | 0.278333 | 8 | 8.44444 | |||||||||||||
| 5 | 23 | 23.3333 | 0.24 | 0.25 | 9 | 8.44444 | |||||||||||||
| 6 | 21 | 20.9167 | 0.22 | 0.211667 | 8 | 8.11111 | |||||||||||||
| 7 | 14 | 14.3333 | 0.32 | 0.293333 | 6 | 6.44444 | |||||||||||||
| 8 | 11 | 11.25 | 0.42 | 0.415 | 5 | 5.11111 | |||||||||||||
| 9 | 10 | 10.4167 | 0.42 | 0.408333 | 5 | 4.77778 |
Table 6: Factorial design observed and predicted values.
Response-Surface Study
Response surface plots were generated for each response to study the effect of each factor. The regression Esq. (1)–(3) presented in the form of a response surface plots in Figures 1a-1c, shows the influence of independent variables X1 and X2 on the response variables Y1, Y2 and Y3 .A graphically depicting maxima and minima in the response surface plot allow visual observation of the significance of the regression equations.
As it can be seen from the plot, that disintegration time was dependent on both factors. Concentration of Crospovidone (X1) and Camphor (X2) had significant effect on the disintegration time of the optimized fast disintegrating tablet formulation (Figure 4). A decrease in the disintegration time was observed from 25 to 20.5 seconds with an increase in the concentration of Crospovidone (X1) from 2 to 4 mg while 25 to 10 seconds decrease with increase in camphor levels (X2) from 3 to 9
mg. This significant (p<0.05) decrease in disintegration time with (X1) is due to fast absorption of water into the core of the tablets and associated particles into individual components for fast dissolution [15] and with (X2) decrease in disintegration time may be due to hydrophobic nature of camphor on the surface of the powder particles (Figure 1a).
![Figure 4: Cumulative drug release of candesartan cilexetil optimized tablet. It was clear from the equation (2 & 3) and Figure1b and Figure 1c that camphor (X 2) had influence on friability and wetting time of the tablets. Crospovidone (X1) is known to produce mechanically strong tablets, as there is less negligible and no effect on friability and wetting time respectively. But, in case of camphor (X2), an increase in friability from 0.21 to 0.45% is observed with increasing concentration of the sublimant from 3 to 9 mg. The effect on friability may be due to the maximizing pore structure of the powder particles, thus increasing porosity [16] with camphor. Thus optimum values of friability were selected keeping in view this trend. However, camphor (X2) is shown to have an antagonistic effect on wetting time i.e., a decrease in wetting time from 8.3 to 4.7 seconds was observed with increase in the levels of camphor from 3 to 9 mg, which may be due to hydrophobic nature of camphor on the surface of the powder particles. The results of multiple linear regression analysis showed that the coefficient b2 bear a negative sign for disintegration time. Therefore, increasing the concentration of camphor is expected to decrease the disintegration time. Higher porosity is expected in the tablets, if higher percentage of camphor is used. The water uptake and subsequent disintegration are thus facilitated. On the other hand, an increase in the concentration of camphor leads to increase in friability because the coefficient b1 bears a negative sign. When a higher percentage of camphor is used, more porous and mechanically weak tablets are produced. As indicated by negative sign of the coefficient b2, the increase in the incorporated amounts of crospovidone resulted in decrease in the friability.](/fulltextimages/1156/fig_4.png)
Figure 4: Cumulative drug release of candesartan cilexetil optimized tablet. It was clear from the equation (2 & 3) and Figure1b and Figure 1c that camphor (X 2) had influence on friability and wetting time of the tablets. Crospovidone (X1) is known to produce mechanically strong tablets, as there is less negligible and no effect on friability and wetting time respectively. But, in case of camphor (X2), an increase in friability from 0.21 to 0.45% is observed with increasing concentration of the sublimant from 3 to 9 mg. The effect on friability may be due to the maximizing pore structure of the powder particles, thus increasing porosity [16] with camphor. Thus optimum values of friability were selected keeping in view this trend. However, camphor (X2) is shown to have an antagonistic effect on wetting time i.e., a decrease in wetting time from 8.3 to 4.7 seconds was observed with increase in the levels of camphor from 3 to 9 mg, which may be due to hydrophobic nature of camphor on the surface of the powder particles. The results of multiple linear regression analysis showed that the coefficient b2 bear a negative sign for disintegration time. Therefore, increasing the concentration of camphor is expected to decrease the disintegration time. Higher porosity is expected in the tablets, if higher percentage of camphor is used. The water uptake and subsequent disintegration are thus facilitated. On the other hand, an increase in the concentration of camphor leads to increase in friability because the coefficient b1 bears a negative sign. When a higher percentage of camphor is used, more porous and mechanically weak tablets are produced. As indicated by negative sign of the coefficient b2, the increase in the incorporated amounts of crospovidone resulted in decrease in the friability.
Optimization of Formulation
The optimal settings of the experimental factors have been determined and are displayed as 2 mg and 6mg for crospovidone and camphor respectively. At these settings, the response variables generate a desirability of 0.77%.
Data Obtained from the Evaluation of the Prepared Optimized Tablets and Model Fitting
The candesartan cilexetil formulated using optimum composition of crospovidone and camphor were evaluated for the above physicochemical properties. The optimum formulation composition (Table 3) and their values for its physicochemical properties are represented in Figure 3a-3d respectively. The values were within the official limits indicating that the optimized tablets were quite hard and uniform in drug content. The disintegration time, percent friability and wetting time were 15s, 0.3% and 6.4s respectively with desirability values as 1.0 for disintegration time, 0.64 for friability and 0.71 for wetting time. This implies that the optimum concentration of crospovidone and camphor had synergistic effect on disintegration and wetting time while antagonistic effect on friability as elucidated from model fitting.
In-Vitro Release
The complete release profile of optimized formulation is shown in Figure 4. Nearly 79% of drug was released over a period of 60 seconds, followed by a distinct prolonged release up to 5 minutes. The release may be attributed to diffusion of the dissolved drug within the hydrophilic core of superdisintegrant into the dissolution medium. Release kinetics was evaluated by fitting obtained data into first and zero order equations. Based on the results, drug release from optimized formulation followed first order equation and related correlation coefficient (intercept =1.94; r2= 0.81; K = 0.38 min-1) was better than zero order kinetics (intercept=32.14; r2=0.61; K0=14.24mg/ml*min), thus showing that release was immediate with concentration gradient.
Stability Studies
Optimized formulations showed no significant
variation in all the parameters under the study at different storage conditions i.e. 400C and RH 75%. The results are shown in Table 7. The similarity factor was calculated for the comparison of the dissolution profile before and after stability studies. The f2 value was found to be more than 50 (69.45) thereby indicating a close similarity between both the dissolution profiles. Hence, the result of the stability studies confirmed that the developed formulation is stable under the study conditions as shown in the Figure 5.
| Temperature | |||||||||||||||||
|---|---|---|---|---|---|---|---|---|---|---|---|---|---|---|---|---|---|
| Days | |||||||||||||||||
| Weight | Hardness | Friability | Disintegration Time (s) | Drug Content | |||||||||||||
| 0 | 99.42 | 2.8 | 0.36 | 16 | 98.46 | ||||||||||||
| 15 | 99.41 | 2.8 | 0.46 | 16 | 98.31 | ||||||||||||
| 30 | 99.41 | 2.7 | 0.29 | 17 | 98.24 | ||||||||||||
| 45 | 98.89 | 2.7 | 0.28 | 17 | 98.23 | ||||||||||||
| 60 | 98.73 | 2.7 | 0.27 | 17 | 98.19 | ||||||||||||
| 75 | 98.61 | 2.7 | 0.26 | 17 | 98.19 | ||||||||||||
| 90 | 98.55 | 2.7 | 0.23 | 18 | 98.12 |
Table 7: Effect of Storage Condition on Optimized tablet formulation.
Conclusion
The present study developed a mathematical model connecting to the significant effects of independent variables (amount of crospovidone (X1) and camphor (X2) on the investigated characteristics of candesartan mouth dissolve tablets using 32 randomized full factorial design. The quantitative effect of these factors at different levels was predicted and estimated by response surface methodology and expressed in polynomial equations. Compared with the experimental optimized preparation, the observed responses were in close agreement with the predicted values of the optimized one, thereby demonstrating the feasibility of the optimization procedure in developing candesartan mouth dissolve tablets.
References
-
Vijaykumar N, Raviraj P, Venkateshwarlu V, and Harisudhan T (2009) Development and characterization of solid oral dosage form incorporating candesartan cilexetil. Pharm Dev Technol 14 (3): 290-298.
-
Arias MJ, Gines JM, Moyano JR, Rabasco AM (1994) The application of solid dispersion technique with D- mannitol to the improvement in oral absorption of triamterene. J Drug Target 2(1): 45-51.
-
Zerrouk N, Chemtob C, Arnaud P, Toscani S, Dugue J (2001) In vitro and in vivo evaluation of carbamazepine-PEG 6000 solid dispersions. Int J Pharm 225(1-2): 49-62.
-
Palmieri GF, Cantalamessa F, Di Martino P, Nasuti C, Martelli S, et al. (2002) Solid dispersions: in vitro and in vivo evaluation. Drug Dev Ind Pharm 28(10): 1241- 1250.
-
Lee S, Nam K, Kim MS, Jun SW, Park JS, et al. (2005) Preparation and characterization of solid dispersions of itraconazole by using aerosol solvent extraction system for improvement in drug solubility and bioavailability. Arch Pharm Res 28(7): 866-874.
-
Hancock BC, Zografi G (1997) Characteristics and significance of the amorphous state in pharmaceutical systems. J Pharm Sci 86(1): 1-12.
-
Blagden N, Matas MD, Gavan PT, York P (2007) Crystal engineering of active pharmaceutical ingredients to improve solubility and dissolution rates. Adv Drug Deliv Rev 59(7): 617-630.
-
Kesisoglou F, Panmai S, Wu Y (2007) Nanosizing-Oral formulation development and biopharmaceutical evaluation. Adv Drug Del Rev 59(7): 631-644.
-
Stella VJ, Nti-Addae KW (2007) Prodrug strategies to overcome poor water solubility. Adv Drug Del Rev 59(7): 677-694.
-
Serajuddin AT (2007) Salt formation to improve drug solubility. Adv Drug Del Rev 59(7): 603-616.
-
Brewster ME, Loftsson T (2007) Cyclodextrins as pharmaceutical solubilizers. Adv Drug Del Rev 59(7): 645-666.
-
Vasconcelos T, Sarmento B, Costa P (2007) Solid dispersions as strategy to improve oral bioavailability of poor water soluble drugs. Drug Discov Today 12(23-24): 1068-1075.
-
Hauss DJ (2007) Oral lipid-based formulations. Adv Drug Deliv Rev 59(7): 667-676.
-
Sammour OA, Hammad AM, Megrab AN, Zidan AS (2006) Formulation and Optimization of Mouth Dissolve Tablets Containing Rofecoxib Solid Dispersion. AAPS Pharm Sci Tech 7 (2): 167-175.
-
Kevin GC, Vinit EB, Ravindra JJ, Anil JS (2008) Fast- disintegrating aceclofenac tablets: formulation development using simplex lattice design. Thai J Pharm Sci 32: 77-81.
-
Bredenberg S, Duberg M, Lennernäs B, Lennernäs H, Pettersson A, et al. (2003) In vitro and in vivo evaluation of a new sublingual tablet system for rapid oromucosal absorption using fentanyl citrate as the active substance. Eur J Pharm Sci 20(3): 327-334.
-
Bhavsar MD, Tiwari SB, Amiji MM (2006) Formulation optimization for the nanoparticles in microsphere hybrid oral delivery system using factorial design. J Control Release 110(2): 422-430.
-
Bodea A, Leucuta SE (1997) Optimization of propranolol hydrochloride sustained release pellets using a factorial design. Int J Pharm 154: 49-57.
-
Gohel MC, Amin AF (1998) Formulation optimization of controlled release diclofenac sodium microspheres using factorial design. J Control Release 51(2-3): 115- 122.
-
Late SG, Yu YY, Banga AK (2009) Effects of disintegration-promoting agent, lubricants and moisture treatment on optimized fast disintegrating tablets. Int J Pharm 365(1-2): 4-11.
- Acido Labile or Gastro Irritant Apis and Enteric Release in Galenic Practice: An Overview
- A Study on Knowledge, Attitude and Practice of Hand Hygiene among Healthcare Professionals at a Tertiary Care Hospital, India
- Influence of Inoculum Concentration on In Vivo Incubation Period of Emmia lacerata, Pathogenesis and Management of Wilt in Pepper (Capsicum annuum L.)
- Vanilla’s Chemistry
- Marine Anti-Cancer Compounds and Adverse Effects of Global Warming on Oceans: An Overview
- Serological Investigation of Chikungunya Virus Antibody among Malaria-Suspected Febrile Patients in Some Healthcare Facilities in Rivers State