Analytical Method Development and Validation of Bendamustine in Bulk Using RP-HPLC
A simple, sensitive, precise, accurate and economical method was developed and validated for the estimation of Bendamustine in bulk or formulation by RP-HPLC method using Inertsil column ODS of dimensions ODS -2, (150 x 4.6) mm, 5 µm. The mobile phase (trifluoroacetic acid and acetonitrile ) was pumped at a flow rate of 1.5ml/min in the ratio of 68:32 and the eluents were monitored at 230 nm. Linearity was obtained in the concentration range of 10%-150% with R2 0.999. LOD and LOQ were found to be 2.9 µg/ml and 8.75 µg/ml. The method was statistically validated according to ICH guidelines. RSD was found to be less than 2% indicating high degree of accuracy and precision of the proposed HPLC method. The percentage recovery was in good agreement with the labeled amount in the pharmaceutical formulations.
Murali Krishna KS
Keywords: Treanda; HPLC; Trifluoroacetic acid
Introduction
Bendamustine bearing the name Treanda is a chemotherapic medication used in the treatment of chronic lymphocytic leukemia, multiple myeloma, and non-hodgkins lymphoma. Bendamustine is a white, water- soluble microcrystalline powder with amphoteric properties. It acts as an alkylating agent causing intra-strand and inter-strand cross-links between DNA bases. After intravenous infusion it is extensively metabolised in the liver by cytochrome p450. More than 95% of the drug is bound to protein – primarily albumin. Only free bendamustine is active. Elimination is biphasic with a half-life of 6–10 minutes and a terminal half-life of approximately 30 minutes. It is eliminated primarily through the kidneys. Combination therapy with bendamustine and rituximab has demonstrated superior efficacy to a standard rituximab- containing chemotherapy regimen in patients with previously untreated indolent B-cell non-Hodgkin lymphoma, and it is currently being compared against the standard first-line regimen in CLL: fludarabine, cyclophosphamide, and rituximab. Ongoing and planned studies are evaluating new strategies in which bendamustine is being combined with existing agents and with novel therapies to optimize use in different clinical settings [1, 2, 3, 4, 5, 6, 7, 8, 9, 10, 11, 12, 13, 14, 15].
Materials and Methods
| Instrument name | Manufacturer | ||||
|---|---|---|---|---|---|
| HPLC | Shimadzu LC 20 10 CHT pump, PDA Detector | ||||
| Column | Inertsil ODS -2, (150 x 4.6) mm, 5 µm | ||||
| UV spectrophotometer | Shimadzu, Thermo electron corporation | ||||
| Electronic balance | Sartorious | ||||
| Ultra sonicator | Spectral lab-model UCB50 | ||||
| Pipettes, burettes, beakers | Borosil, class-B |
Table 2: Instruments used in the present work.
| Chemicals | Manufacturer | ||||
|---|---|---|---|---|---|
| Bendamustine | Hetero laboratories | ||||
| Acetonitrile | Merck, Hyderabad | ||||
| Trifluoroacetic acid | Startech labs, Hyderabad |
Table 3: Chemicals and Reagents used in the present work.
Method Development and Validation of Bendamustine
Selection of Wavelength for Detection
Selection of solvent: The solubility of bendamustine was determined in a variety of solvents as per Pharmacopoeial standards. Solubility test was carried out in different solvents like distilled water, methanol, acetonitrile, dilute ethanol. From the solubility studies, it was found that bendamustine was soluble in methanol. Methanol was selected as suitable solvent as there will be no solvent interference while scanning in UV. Determination of wave length Maxima: UV spectrum of bendamustine in diluent (mobile phase composition) was recorded by scanning in the range of 200nm to 400nm. From the UV spectrum wavelength selected as 230 nm. At this wavelength bendamustine shows good absorbance. Preparation of mobile phase: The mobile phase is composed of a mixture of trifluoroacetic acid and acetonitrile in the ratio of 68:32(v/v). Prior to use, the mobile phase was degassed and filtered via 0.45 _μ_m membrane filter. Preparation of Buffer: Add 1.0 mL of Trifluoroacetic acid in 1000 mL water, sonicate for 10 minutes and filter using 0.45 µ filters.
- Chromatographic Conditions
- Instrument
- Shimadzu LC 20 10 CHT pump,
- PDA Detector
- Injection Volume
- 10 μl
- Mobile Phase
- Trifluoroacetic acid : Acetonitrile
- (68:32)
- Column
- Inertsil ODS -2, (150 x 4.6) mm,
- 5 µm
- Wavelength
- 230 nm
- Flow Rate
- 1.5 ml/mim
- Runtime
- 10 min
Table 1: Variables in HPLC.
Validation of Rp-Hplc Method
Validation is a key process for effective quality assurance. “Validation” is established documented evidence, which provides a high degree of assurance that a specific process or equipment will consistently produce a product or result meeting its predetermined specification and quality attributes. The Validation parameters are:
- Specificity
- Linearity
- System Suitability Parameters
- Precision
- Accuracy or Recovery
- Assay
- Ruggedness
- Robustness
- LOD and LOQ Specificity: Specificity is the ability to measure accurately and specifically the analyte in the presence of components that may be expected to be present in the sample. It is the measure of degree of interference (or absence thereof) in the complex sample mixtures such as the analyte mixed with the formulation excipients, known impurities and degradation product. Linearity: The linearity of an analytical procedure is its ability to obtain test results which are directly proportional to the concentration of analyte in sample. System suitability: The System suitability is an integral part of analytical procedure. The tests are based on the concept that the equipment, analytical operations and samples to be analyzed constitute an integral system that can be evaluated as such.
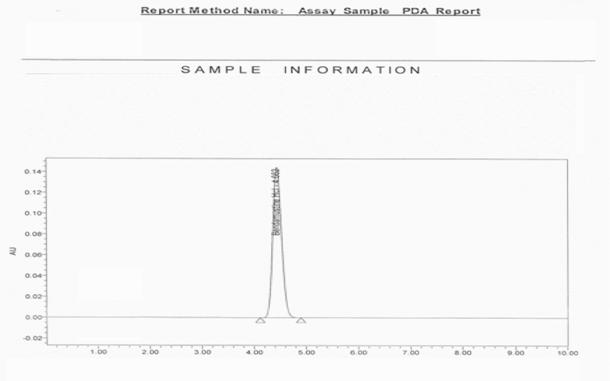
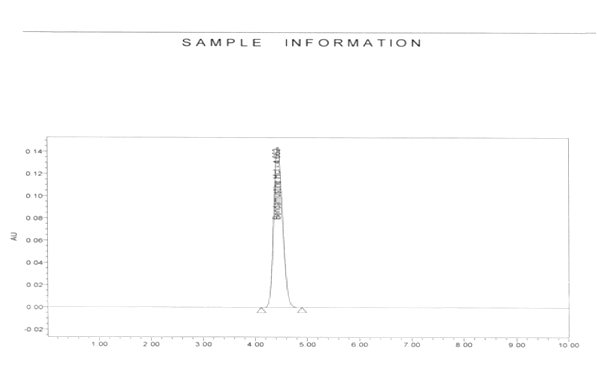
Precision: Precision is the degree of closeness of agreement among individual test results when the method is applied to multiple samplings of a homogenous sample. It is a measure of either the degree of reproducibility (agreement under different conditions) or repeatability (agreement under same conditions) of the method. Ruggedness: Ruggedness is the degree of reproducibility of the results obtained under a variety of conditions. Robustness: The robustness of an analytical procedure is a measure of its capacity to remain unaffected by small, but deliberate variations in method parameters and provides an indication of its reliability during normal usage. Robustness study is performed by analyzing the standard at different conditions. The results obtained with altered conditions are compared against results obtained under normal chromatographic conditions. Variation in Flow Rate (± 0. 2 mL/min): The standard was carried out by varying the flow rate of mobile phase to 1.3 mL/min. and 1.7 mL/min. in place of actual flow rate 1.5 mL/min. Variation in Column Oven Temperature (± 2°C): The standard was carried out by varying the column oven temperature of 23°C and 27°C in place of actual column oven temperature 25°C. Variation in Organic composition (± 2% of absolute): The standard was carried out by varying the mobile phase organic composition of 68:32 and 72:28 in place of actual Mobile phase organic composition 70:30. Accuracy: The accuracy of an analytical procedure expresses the closeness of agreement between the value that is accepted either as a conventional true value or an accepted reference value and the value found. To demonstrate the accuracy of assay test method, drug substance is spiked quantitatively in to placebo from 50% to 150% of working concentration of test concentration at each level with triplicate preparation and analyzed using the test method. Typical chromatogram of Accuracy at 100 % level for is shown in figure 4.
Results and Discussion
Selection of Chromatographic Method
Proper selection of the method depends on the nature of the sample (ionic or ionisable or neutral molecules), its molecular weight, pka value and stability. The drug selected in the present study is polar and so reversed phase or ion exchange chromatography can be used. The reversed phase HPLC was selected for the initial separation because of its simplicity and suitability. From the literature survey and with the knowledge of properties of the selected drug, ODS column was tried. ODS 150 X 4.5 mm 5μcolumn was chosen as stationary phase and mobile phase with different compositions such as methanol and water was used. The separations were not observed, so the combination of buffer and methanol was finalized. The buffer used was trifluoroacetic acid buffer.
Effect of Ratio of Mobile Phase
Under the chromatographic conditions mentioned above, the different ratios of buffer and acetonitrile were tried i.e. for trifluoroacetic acid buffer and acetonitrile 68:32 ratios were tried at which they gave good peaks and minimum retention time and good chromatogram with proper resolution. System Suitability
| Bendamustine Peak | ||||||||
|---|---|---|---|---|---|---|---|---|
| Injection # | ||||||||
| Retention Time | Area | |||||||
| 1 | 4.734 | 1439882 | ||||||
| 2 | 4.730 | 1420316 | ||||||
| 3 | 4.729 | 1426127 | ||||||
| 4 | 4.726 | 1427917 | ||||||
| 5 | 4.726 | 1418839 | ||||||
| Mean | 1426616 | |||||||
| % RSD | 0.6 | |||||||
| Tailing factor | 1.2 | |||||||
| Theoretical Plate | 5299 |
Table 4: Results of system suitability for bendamustine Acceptance Criteria • The Tailing factor for Bendamustine peak from first
Table 4: Results of system suitability for bendamustine Acceptance Criteria
- The Tailing factor for Bendamustine peak from first injection of standard solution should be not more than 2.0.
- Theoretical Plates for Bendamustine peak from first injection of standard solution should be not less than 2000.
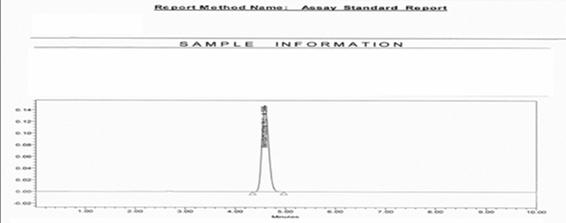
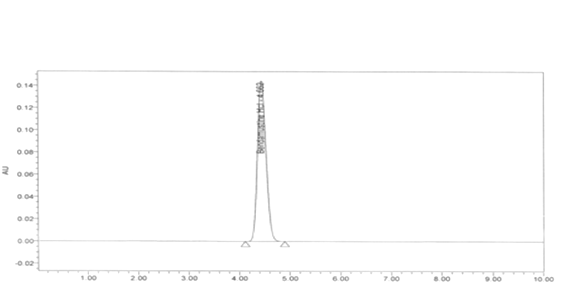
- The relative standard deviation for Bendamustine peak from five replicate injections of standard solution should be not more than 2.0%. Conclusion: The results met the acceptance criteria; hence the method is system suitable for its intended use. Linearity: The linearity of an analytical procedure is its ability to obtain test results which are directly proportional to the concentration of analyte in sample. The linearity of Bendamustine Hydrochloride is established by analyzing Linearity solutions of different concentrations from 10 % to 150 % of working concentration of method for Assay. The Linearity curve is plotted for area versus concentration. The results are summarized in table 5. Typical chromatogram of Linearity at 100 % level is shown in figure1. The linearity graph of is shown in figure 1. Typical chromatogram of Linearity at 100 % level is shown in figure 2.
| Linearity Level | Bendamustine HCl (µg/mL) | Area | ||||||
|---|---|---|---|---|---|---|---|---|
| 10 % | 5 | 142361 | ||||||
| 20 % | 10 | 286356 | ||||||
| 50% | 25 | 711354 | ||||||
| 80 % | 40 | 1137043 | ||||||
| 90 % | 45 | 1281833 | ||||||
| 100 % | 50 | 1426716 | ||||||
| 125 % | 63 | 1751978 | ||||||
| 150 % | 75 | 2111795 | ||||||
| Correlation coefficient (R) : 0.9999 | Y-intercept: 7930.9 | |||||||
| Slope : 27800 | Y-intercept bias at 100% level :0.6 |
Table 5: Results for linearity of bendamustine.
A r e a
| Sample # | Retention Time (Average) | % Assay | ||||||
|---|---|---|---|---|---|---|---|---|
| 1 | 4.163 | 101.0 | ||||||
| 2 | 4.170 | 100.5 | ||||||
| 3 | 4.174 | 100.5 | ||||||
| 4 | 4.171 | 101.6 | ||||||
| 5 | 4.174 | 101.8 | ||||||
| 6 | 4.179 | 101.6 | ||||||
| Mean | 101.2 | |||||||
| % RSD | 0.6 |
Table 6: Results of Intermediate Precision. Acceptance Criteria: • The relative standard deviation of results obtained from six s
| Amount | Amount | Average | ||||||||||||||||||
|---|---|---|---|---|---|---|---|---|---|---|---|---|---|---|---|---|---|---|---|---|
| A | ccuracy Lev | el | Sample # | % Recovery | % RSD | |||||||||||||||
| (mg added) | (mg found) | % Recovery | ||||||||||||||||||
| 50% | 1 | 47.235 | 47.515 | 100.6 | 100.5 | 0.1 | ||||||||||||||
| 2 | 47.329 | 47.578 | 100.5 | |||||||||||||||||
| 3 | 47.207 | 47.399 | 100.4 | |||||||||||||||||
| 100% | 1 | 94.479 | 94.468 | 100.0 | 99.4 | 0.9 | ||||||||||||||
| 2 | 94.329 | 94.114 | 99.8 | |||||||||||||||||
| 3 | 94.404 | 92.880 | 98.4 | |||||||||||||||||
| 150% | 1 | 141.367 | 139.762 | 98.9 | 99.1 | 0.3 | ||||||||||||||
| 2 | 141.432 | 140.186 | 99.1 | |||||||||||||||||
| 3 | 141.301 | 140.407 | 99.4 | |||||||||||||||||
| % Recovery for 9 levels | 99.7 | |||||||||||||||||||
| % RSD for 9 levels | 0.8 |
Table 7: Results for accuracy of bendamustine. Accuracy (Recovery): To demonstrate the accuracy of assay test method, drug substa
Table 7: Results for accuracy of bendamustine. Accuracy (Recovery): To demonstrate the accuracy of assay test method, drug substance is spiked quantitatively in to placebo from 50% to 150% of working concentration of test concentration at each level with triplicate preparation and analyzed using the test method. The result for Bendamustine HCl is tabulated in Table 7. Typical chromatogram of Accuracy at 100 % level for is exhibited in figure 4.
Acceptance Criteria:
- % Recovery at each level and overall % recovery should be between 98.0 and 102.0 for Bendamustine HCl.
- The % RSD at each level and overall recovery should not be more than 2.0. Conclusion: The results are well within the acceptance criteria; hence the method is accurate for its intended use.
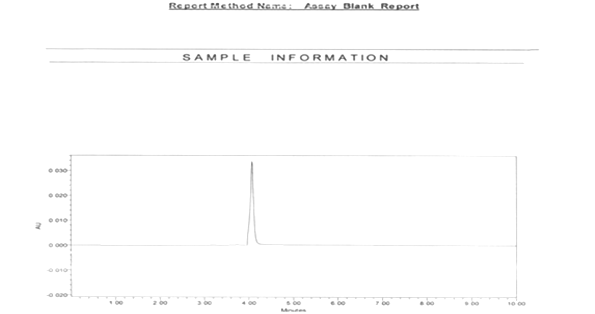
Specificity is the ability of the analytical procedure to assess unequivocally the analyte in the presence of components which may be expected to be present.
| Name | Retention time (min.) | Results | ||||||
|---|---|---|---|---|---|---|---|---|
| Diluent | No Peak detected | No interference observed | ||||||
| Placebo 25mg per vial | No Peak detected | No interference observed | ||||||
| Placebo 100mg per vial | No Peak detected | No interference observed | ||||||
| Bendamustine Hydrochloride in Standard solution | 4.595 | N/A | ||||||
| Bendamustine Hydrochloride in Sample solution 25mg per vial | 4.670 | N/A | ||||||
| Bendamustine Hydrochloride in Sample solution 100mg per vial | 4.664 | N/A | ||||||
| Bendamustine Hydrochloride in Spiked sample solution | 4.662 | NA |
Table 8: Specificity Results for bendamustine. Acceptance Criteria: • There should be no interference at the retention time of No
Bendamustine peak in the Chromatograms obtained from the diluent and the placebo solutions.
Conclusion:
Ruggedness is the degree of reproducibility of the results obtained under a variety of conditions. It was checked that the results were reproducible under differences in conditions, analysts and instruments.
Procedure: The standard solution and sample solution were injected by different analysts and the area for injections in HPLC was measured.
| Injection | Analyst 1 | Analyst 2 | ||||||
| Rt | 4.734 | 4.731 | ||||||
| Peak Area | 1439882 | 1426127 |
Table 9: Results for ruggedness of bendamustine.
The robustness of an analytical procedure is a measure of its capacity to remain unaffected by small, but deliberate variations in method parameters and provides an indication of its reliability during normal usage. Robustness study is performed by analyzing the standard at different conditions. The results obtained with altered
| Flow Rate | Actual Flow Rate | Flow Rate | ||||||||||||||||||
|---|---|---|---|---|---|---|---|---|---|---|---|---|---|---|---|---|---|---|---|---|
| Injection # | 1.3 mL/min. | 1.5 mL/min. | 1.7 mL/min. | |||||||||||||||||
| RT | Area | RT | Area | RT | Area | |||||||||||||||
| 1 | 4.417 | 1604526 | 4.734 | 1439882 | 4.170 | 1245237 | ||||||||||||||
| 2 | 4.417 | 1608707 | 4.730 | 1420316 | 4.169 | 1243739 | ||||||||||||||
| 3 | 4.417 | 1610521 | 4.729 | 1426127 | 4.169 | 1245069 | ||||||||||||||
| 4 | 4.417 | 1601094 | 4.726 | 1418839 | 4.169 | 1249676 | ||||||||||||||
| 5 | 4.418 | 1608861 | 4.726 | 1427917 | 4.169 | 1242068 | ||||||||||||||
| Mean | NA | 1606742 | NA | 1426616 | NA | 1245158 | ||||||||||||||
| % RSD | NA | 0.2 | NA | 0.6 | NA | 0.2 | ||||||||||||||
| Tailing factor | 1.2 | 1.2 | 1.1 | |||||||||||||||||
| Theoretical Plates | 5598 | 5299 | 4842 |
Table 10: Results of Robustness-Variation in Flow rate for Bendamustine.
Variation in Column Oven Temperature (± 2°C): The standard was carried out by varying the column oven temperature of 23°C and 27°C in place of actual column oven temperature 25°C. The results are summarized. The results are summarized in Table 11.
| Column Oven Temperature | Actual Column Oven Temperature 25°C | Column Oven | |||||||||||||||||
|---|---|---|---|---|---|---|---|---|---|---|---|---|---|---|---|---|---|---|---|
| 23°C | Temperature 27°C | ||||||||||||||||||
| Injection # | |||||||||||||||||||
| RT | Area | RT | Area | RT | Area | ||||||||||||||
| 1 | 4.857 | 1412117 | 4.734 | 1439882 | 4.571 | 1421139 | |||||||||||||
| 2 | 4.857 | 1405844 | 4.730 | 1420316 | 4.570 | 1422116 | |||||||||||||
| 3 | 4.857 | 1392908 | 4.729 | 1426127 | 4.568 | 1423122 | |||||||||||||
| 4 | 4.857 | 1403670 | 4.726 | 1418839 | 4.567 | 1421483 | |||||||||||||
| 5 | 4.857 | 1406250 | 4.726 | 1427917 | 4.567 | 1420494 | |||||||||||||
| Mean | NA | 1404158 | NA | 1426616 | NA | 1421671 | |||||||||||||
| % RSD | NA | 0.5 | NA | 0.6 | NA | 0.1 | |||||||||||||
| Tailing factor | 1.2 | 1.2 | 1.2 | ||||||||||||||||
| Theoretical plate | 4999 | 5299 | 5314 |
Table 11: Results of Robustness-Variation in Column Oven Temperature for Bendamustine. Variation in Organic composition (± 2% of a
Table 11: Results of Robustness-Variation in Column Oven Temperature for Bendamustine. Variation in Organic composition (± 2% of absolute) The standard was carried out by varying the mobile phase organic composition of 68:32 and 72:28 in place of actual Mobile phase organic composition 70:30. The results are summarized. The results are summarized in Table 12.
| Mobile phase composition | Actual Mobile phase composition (70:30) | Mobile phase composition | |||||||||||||||||
|---|---|---|---|---|---|---|---|---|---|---|---|---|---|---|---|---|---|---|---|
| (68:32) | (72:28) | ||||||||||||||||||
| Injection # | |||||||||||||||||||
| RT | Area | RT | Area | RT | Area | ||||||||||||||
| 1 | 4.731 | 1436831 | 4.734 | 1439882 | 4.454 | 1392300 | |||||||||||||
| 2 | 4.731 | 1413689 | 4.730 | 1420316 | 4.454 | 1386460 | |||||||||||||
| 3 | 4.731 | 1409539 | 4.729 | 1426127 | 4.455 | 1390738 | |||||||||||||
| 4 | 4.731 | 1415929 | 4.726 | 1418839 | 4.456 | 1387169 | |||||||||||||
| 5 | 4.732 | 1423610 | 4.726 | 1427917 | 4.456 | 1391037 | |||||||||||||
| Mean | NA | 1420460 | NA | 1426616 | NA | 1389541 | |||||||||||||
| % RSD | NA | 0.8 | NA | 0.6 | NA | 0.2 | |||||||||||||
| Tailing factor | 1.2 | 1.2 | 1.2 | ||||||||||||||||
| Theoretical plates | 5603 | 5299 | 4568 |
Table 12: Results of Robustness-Variation in organic composition for Bendamustine Hydrochloride. Acceptance criteria: • The Tailin
Table 12: Results of Robustness-Variation in organic composition for Bendamustine Hydrochloride. Acceptance criteria:
- The Tailing factor for Bendamustine peak from first injection of standard solution should be not more than 2.0.
- Theoretical Plates for Bendamustine peak from first injection of standard solution should be not less than 2000.
- The relative standard deviation for Bendamustine peak from five replicate injections of standard solution should be not more than 2.0%. Conclusion: The system suitability meets for each altered conditions. The results obtained with altered conditions are comparable with the results obtained with normal conditions. The robustness result indicates that the test method is robust enough as demonstrated by altering the
Summary and Conclusion
A simple, sensitive and reproducible HPLC method for determination of bendamustine has been developed in bulk and tablet dosage forms. The validation parameters were found to be highly agreeable, indicating small sample volume, short retention time, system suitability, specificity, linearity, limits of detection and quantification, precision, accuracy and robustness. Hence, the proposed method can be easily applied for the quantification of bendamustine in routine quality control laboratories.
References
-
Dubbelman AC, Rosing H, Darwish M, D'Andrea D, Bond M, et al. (2013) Pharmacokinetics and excretion of bendamustine in patients with relapsed or refractory malignancy. Drugs R D 13(1): 17-28.
-
Neil O, Maryadele J (2006) The Merck index: an encyclopedia of chemicals, drugs, and biologicals. Merck Research Laboratories, Whitehouse Station, NJ, Merck.
-
Friedberg JW, Cohen P, Chen L, Sue Robinson K, Forero-Torres A, et al. (2008) Bendamustine in Patients With Rituximab-Refractory Indolent and Transformed Non-Hodgkin's Lymphoma: Results From a Phase II Multicenter, Single-Agent Study. J Clinical Oncology 26(2): 204-210.
-
Lissitchkov T, Arnaudov G, Peytchev D, Merkle KH (2006) Phase-I/II study to evaluate dose limiting toxicity, maximum tolerated dose, and tolerability of bendamustine HCl in pre-treated patients with B- chronic lymphocytic leukaemia (Binet stages B and C) requiring therapy. Journal of Cancer Research and Clinical Oncology 132(2): 99-104.
-
Teichert J, Sohr R, Baumann F, Hennig L, Merkle K, et al. (2005) Synthesis and characterization of some new phase ii metabolites of the alkylator bendamustine and their identification in human bile, urine, and plasma from patients with cholangiocarcinoma. Drug Metabolism and Disposition 33(7): 984-992.
-
Matt Kalaycio (2008) Clinical Experience with Bendamustine: A new treatment for patients with chronic lymphocytic leukemia. Clinical Leukemia 2(4): 223-229.
-
Teichert J, Baumann F, Qi Chao, Franklin C, Bailey B, et al. (2007) Characterization of two phase I metabolites of bendamustine in human liver microsomes and in cancer patients treated with bendamustine hydrochloride. Cancer Chemotherapy and Pharmacology 59(6): 759-770.
-
Rasschaert M, Schrijvers D, Van den Brande J, Dyck J, Bosmans J, et al. (2007) A phase I study of bendamustine hydrochloride administered day 1+2 every 3 weeks in patients with solid tumours. British Journal of Cancer 96: 1692-1698.
-
Preiss R, Sohr R, Matthias M, Brockmann B, Huller H (1985) The pharmacokinetics of bendamustine (Cytostasane) in humans. Die Pharmazie 40(11): 782- 784.
-
Ivanka Pencheva, Anita Bogomilova, Neli Koseva, Danka Obreshkova, Kolio Troev (2008) HPLC study on the stability of bendamustine hydrochloride immobilized onto polyphosphoesters. Journal of Pharmaceutical and Biomedical Analysis 48(4): 1143- 1150.
-
Mathrusri Annapurna M, Pavani S, Anusha S, Harika Mahanti, Venkatesh B (2012) New analytical methods for the determination of Bendamustine hydrochloride: An anti-neoplastic drug. J Chem Pharm Res 4(3): 1696-1701.
-
(2005) ICH Validation of analytical procedures: Text and methodology Q2 (R1). International Conference on Harmonization.
-
(2003) ICH Stability Testing of New Drug Substances and Products Q1A (R2). International Conference on Harmonization.
-
Grever MR, Andritsos LA, Lozanski G (2008) Chronic lymphoid leukemias, Abeloffs Clinical Oncology, Elsevier 4th (Edn.), Philadelphia, pp: 2293-2308.
-
Sasi kiran goud E, Krishna reddy V (2013) Development and validation of RP-HPLC method for determination of related substances of Bendamustine hydrochloride in bulk drug. Der Pharmacia Sin 4(1)**:** 29-36.
- Acido Labile or Gastro Irritant Apis and Enteric Release in Galenic Practice: An Overview
- A Study on Knowledge, Attitude and Practice of Hand Hygiene among Healthcare Professionals at a Tertiary Care Hospital, India
- Influence of Inoculum Concentration on In Vivo Incubation Period of Emmia lacerata, Pathogenesis and Management of Wilt in Pepper (Capsicum annuum L.)
- Vanilla’s Chemistry
- Marine Anti-Cancer Compounds and Adverse Effects of Global Warming on Oceans: An Overview
- Serological Investigation of Chikungunya Virus Antibody among Malaria-Suspected Febrile Patients in Some Healthcare Facilities in Rivers State