Valuation Mapping of Rural Areas in Central Turkey: A Model Proposal Case Study
In addition to the usual concerns that governments face, managing agriculture and agricultural areas is a significant issue. As a result, a country's agricultural production is highly dependent on its land potential. The transformation of agricultural areas into construction sites will be more attractive for the proprietors if they are not valued at their actual worth. This study applies and compares two different valuation methods, income and nominal land value approaches, to evaluate land in rural area, Cankiri Province, Catalelma Village, Central Turkey. In Turkey, income valuation method is typically applied for dealing with financial matters related to agricultural areas. On the other hand, one of the statistical methods, nominal valuation, was also used in the study area by applying the spatial analysis functions of geographical information system (GIS). In this study, four sample parcels representing three different land use capability classes (two irrigable, one medium, and one barren) were selected for comparison of two valuation methods. The results obtained during this research demonstrate that the nominal valuation approach produced more accurate results than the income method, and it may be used in the country's local administrative units due to available data.
Introduction
The rapid population growth and the nutrition of the expanding population are two of the most significant issues facing the globe today. This problem is particularly significant in many growing and underdeveloped countries. Because it is not possible to increase the amount of agricultural lands in response to the increasing population rate, the increasingly scarce resource land can be used in the most effective and efficient manner, and it is regarded as a solution to satisfy the increasing population requirement. Soil is an essential factor in agricultural production. Humans and other living things in nature rely on food to survive. As a result, a country’s agricultural production is highly dependent on its land potential. Agricultural land is an important resource in the global ecosystem, for it covers 36.9% of the world’s land area [1].
Turkey, for a very long time, had no demand from other countries for numerous agricultural yields. However, the situation has begun to change rapidly, particularly in the last ten years, owing to primarily incorrect policies. For instance, in Turkey, farming areas declined from 26.3 million hectares in 2001 to 23.1 million hectares in 2020 [2].
Agriculture input costs, such as petroleum and fertilizer, have risen faster than expected, while compensation and financial aid to farmers have decreased, and instead of exporting, related politicians prefer importing policies in that field. On the other hand, land and building prices have recently risen faster than the rate of inflation. As a result, farming areas are transformed into construction sites. In industrialized areas, changes in housing prices are more likely to lead to changes in land prices, whereas in rural areas, changes in land prices are more likely to lead to changes in housing prices [3].
Urban land is required in order to improve and develop urban life in a planned manner, as certain of its functions encourage settlement on the land. This need and demand results in both the conversion of rural land to urban land and an increase in the value of land along the city’s growth path [4]. A commission made up of government representatives and locals values agricultural areas for expropriation and taxation in accordance with established guidelines. To achieve social fairness and sustainable development, land taxation should be implemented to track land value appreciation when investing in the construction of public amenities for the general good [5].
Valuation is an art of estimating meaningful present worth of any commodity or property based on experience, logical approach, relevant statistical data and certain common sense at a stated time [6]. To perform a land valuation, both subjective and objective valuation factors must be addressed and modeled. The method used to value real estate might vary depending on the country’s culture, geography, and regional characteristics such as environmental, social, and economic aspects, development situation, legislation, purpose of use, marketing standards, inflation rate, and interest rates.
A rural property is a property that has its value based on the level of productivity associated with the property in regards to location, soil type, climate and topography [7]. Although there are many studies on land analysis in urban areas worldwide [8, 9, 10, 11], the research in rural areas remains limited, particularly in Turkey. Previous research conducted by reviewed the results of an extensive survey carried out by rural property valuers in Australia, in relation to the impact of farm management on rural property values and sustainable rural land use. Christopolou [12] used Unified Modelling Language (UML) concepts and diagrams to describe and design area’s structure with no prior selection of the variables. Moreover, have conducted a case study on rural area valuation for land consolidation purposes in Ghana. They determined 13 factors for implementing the project. This high number of factors were caused due to consolidation related factors, such as shape, size etc. of the parcels to be considered. The following study performed by kilic, et al. [13] implemented a case study related with determination of real estate prices at urban lands transformed from agricultural areas. Examined land value determination of agricultural areas using GIS and analyzed effects of topography in Croatia.
This paper addresses land evaluation in rural areas of Central Turkey by applying two different valuation methods; income and nominal land valuation approaches, so far lacking in the scientific literature. As far as we know, no previous research has investigated and compared the implementation and compatibility of these two approaches in rural areas, Central Turkey.
An Overview of Land Valuation Methods
There is a wide choice of various methods for estimating a land’s value available in the literature Nisaci [14]. Valuation methods are divided into three categories: conventional, statistical, and contemporary valuation methods. The most suitable land valuation method is determined by a number of aspects, including the land’s location, purpose of use, age, and nature. Two methods - income (conventional) and nominal (statistical) land value approaches-were primarily used in this study, since the income method is currently the most commonly used approach in Turkey. The nominal valuation technique, on the other hand, is based on the spatial analysis functions of a geographical information system (GIS). There are spatial and attribute data as well as high resolution ortho images covering the whole country present in Ministry of Agriculture. Therefore this method is adopted as a reference for valuation of rural areas during this study.
Income Valuation Method
It is a method based on the estimation of the annual income of income - generating real estates. When this method is used to appraise land, buying land is viewed as an investment, and the price of the property is viewed as the capital invested in the purchase of future land income [15]. To calculate the value of a property using this approach, the net operating income of a property is divided by its capitalization rate [16] as it shown in the Equation 1 below.
$$D = R / f$$
Where D is the actual land sale value (Turkish Lira, TL), R is the annual net average income (Turkish Lira, TL) and f is the capitalization rate (percentage, %). Net income is obtained by subtracting all annual expenses for the real estate from the annual gross income of the real estate, and the value is estimated by taking into account the net income during the evaluation phase. The future income of the property is calculated by taking into account the country’s inflation [17]. As a result, it is possible to have problems in applications for countries whose economic system is not predictable.
Nominal Land Valuation Method
Nominal valuation provides calculated parametric scores of weighted criteria which affect real estate values [18]. This approach provides a distribution of land values as parametric quantities using scientific approaches without requiring the market value [19]. Nominal valuation is stochastic method based on statistical models that require analysis by computers since these method is applied for a large number of real estate [10].
It is based on scoring the characteristics or the effecting criteria of real estates. The total nominal land value can be expressed using the following formula.
$$ V i = S i * \sum k _ {j: 1} \left(F j i * W j\right) \tag {2} $$
Where V is the nominal value (Turkish Lira, TL), S is the parcel-pixel area (m2), F is the factor value, W is the factor weight (percentage, %), k is the number of factors.
Case Study On Rural Area Valuation In Turkey
Property tax legislation was enacted in 1970, but several revisions have been made to bring it up to date. According to the property tax law, landowners must pay an annual tax of 3-6 % of the fair value of their property [20]. The type of land, which is categorised as barren, medium, or irrigable, determines the fair value of a square meter. A commission formed of authorities and residents defines this value.
Study Area Cankiri Province Catalelma Village
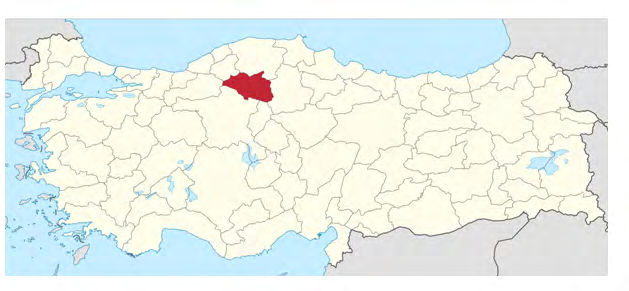
Geographically, Cankiri province is located between 32° 30’ and 34° east longitude and 40° 30’ and 41° north latitude in the Central Anatolia Region. According to Turkish Statistical Institute (TUIK), there are approximately 200.000 residents living in this area. The following provinces surround Cankiri; Bolu in the west, Karabuk in the northwestern region, Kastamonu in the north, Ankara and Kirkkale in the south, and Corum in the east. Apart from the Center, Cankiri is divided into 11 districts. It has a surface area of 7,490 km2, an altitude range of 550 to 2565 meters, and a topographically rough and hilly structure. There are also 3 towns and 371 villages there. The location of Cankiri province in Turkey is shown in (Figure 1) below.
Catalelma village
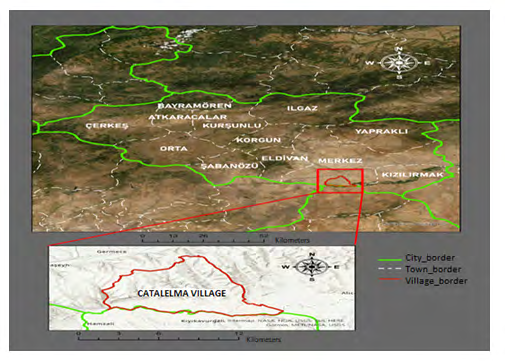
Catalelma village is one of the central villages of Cankiri province. Based on TUIK’s 2021 istatistical data, it has 379 residents. As reported by the General Directorate of Land Registry and Cadastre (TKGM), the surface area of it is 5198 ha. There are registered pasture areas within the borders of the village. The village is situated along the Kizilirmak River. A dense part of it remains in the Hamzali dam irrigation area (Figure 2).
Data Collection for Income Valuation
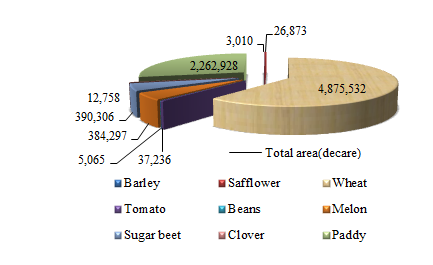
Harvest types and cultured areas were received from the Cankiri Provincial Directorate of Agriculture [21], as well as transaction rates for the first five months of 2021 (January - May) from the Catalelma village local authority (Figure 3).
Capitalisation Rate Calculation in Study Area
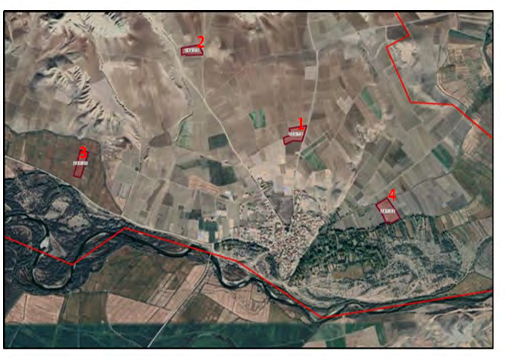
The determination of local capitalization is the most challenging aspect of rural area valuation. This ratio can vary from region to region, from area to area, and even within a village because of topography, dominant wind direction, and ecology, the depth of the soil and its potential for irrigation. Also, all those data is not promptly available [22]. In this study, the actual land sale values and annual net income of four agricultural lands (Figure 4) that are representative of the study area and have recently sold are used to compute the capitalization rate.
Over a period of five months, the actual land net sales values were obtained by inspection and discussion with the relevant Land Registration Directorate, the village local authority, and village residents. The annual net average income determined in the study region was used in the computation of the capitalization rate along with real purchase and sale prices. The total annual net income collected from the survey in the study area was calculated to be 4400 TL, and the total land sale value was found to be 73650 TL therefore capitalization rate for the study region was determined to be 5.9% on average.
Study Area Valuation Using the Income Valuation Method
As indicated in (Figure 4), four parcels were chosen for the income valuation method, with yields of wheat in 1-2, paddy in 3, and sugar beet in 4. The soil layer was found to be moderately productive in the first parcel, low productive in the second parcel, and high productive in the third and fourth parcels.
Net average annual income was calculated using the product quantities and production costs obtained in 2021 as given in Table 1.
| Area,m² | Harvest type | Production amount, ton | Unit price/ ton | Income, TL | Expenditure, TL | Net income, TL | |
|---|---|---|---|---|---|---|---|
| 1 | 18786.4 | Wheat | 7.5 | 2700 TL | 20250 | 18790 | 1460 |
| 2 | 13409.7 | Wheat | 5.2 | 2700 TL | 14040 | 13400 | 640 |
| 3 | 16324.9 | Paddy | 10.6 | 3750 TL | 39750 | 32600 | 7150 |
| 4 | 24646 | Sugar beet | 172.5 | 420 TL | 72450 | 49200 | 23250 |
Table 1: Parcel value table by income method.
A closer look at the data in (Table 1) indicates that the biggest net income was provided from sugar beets, with the maximum area, production amount and lowest unit price/tone. Table 2 illustrates highest parcel values (TL) for irrigable areas.
| Area, m² | Annual net average income, TL | Land type | Capitalization rate | Parcel value, TL | |
|---|---|---|---|---|---|
| 1 | 18786.35 | 1460 | Medium | 5.9 | 24745.76 |
| 2 | 13409.72 | 640 | Barren | 5.9 | 10847.45 |
| 3 | 16324.86 | 7150 | Irrigable | 5.9 | 121186.44 |
| 4 | 24645.98 | 23250 | Irrigable | 5.9 | 394067.8 |
| Parcel no | |||||
| 1 | 18786.35 | Medium | 35694.06 | 24745.76 | |
| 2 | 13409.72 | Barren | 13007.42 | 10847.45 | |
| 3 | 16324.86 | Irrigable | 39669.41 | 121186.44 | |
| 4 | 24645.98 | Irrigable | 59889.73 | 394067.8 |
Table 2: Parcel value table by income method.
Table 3 also includes a comparison between fair value and parcel value. Fair values were collected from Cankiri municipality.
For each 4 year period in rural areas, the commission formed by officers from the Directory of Land Registry, related municipality, chamber of commerce, and local municipality defines fair value. As for urban areas, general principles are formed (based on age of building, construction type ect.) by the Ministry of Environment, Urbanization and Climate Change, Turkey, while local municipalities define fair values. It is necessary to emphasize that this value is used only for taxation purposes. On the other hand, parcel value defined by income valuation method is necessary for receiving credit from banks or cooperatives, as well as for hypothec.
The results Table 3 provide confirmatory evidence that fair values provided by the Cankiri municipality commission for the barren and medium lands are greater than parcel value calculated using the income valuation method. Contrastingly, there are noticeable differences for irrigable areas. These findings indicate that the commission determines value in a superficial manner, paying insufficient consideration to the type of land or the intensity of productivity when valuing.
Nominal Land Valuation Method
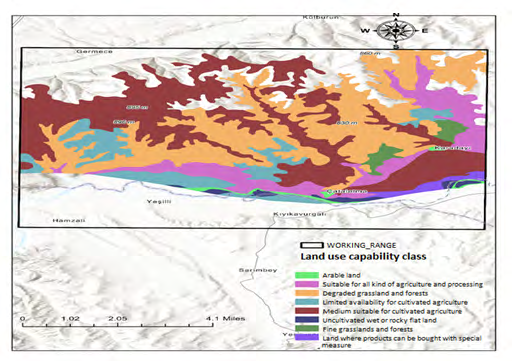
As stated in the definition of nominal value, selecting the influencing criteria and weights is critical to obtaining a reliable valuation result. For this case study, the following criteria have been established; distances to roads, to the village center, and to the stream, slope, waterproof class, land use capability class (suitable for all kind of agriculture and processing, medium suitable for cultivated agriculture, limited availability for cultivated agriculture, land where special products can be bought with special measures, uncultivated wet or rocky flat land, grasslands and forests, arable land), possibility of localization in archaeological sites.
ArcGIS 10.4 software, ALOS DEM data relevant to the study area, data from local authorities relating to agricultural parcels and land use classes, and open source data (Google Earth Pro) were used in this part of the study. Thematic maps for each criterion were built in ArcGIS using the proximity analysis’s Euclidean distance tool. The Euclidean Distance is the shortest distance between any two cells [23]. To overlay with ALOS DEM data, [24] thematic map cells are 12.5 m in size.
Distance criteria were scored 100-0, with 5 points deducted for each 600 m interval for re-classification. Other criteria have also been reclassified in a similar manner.
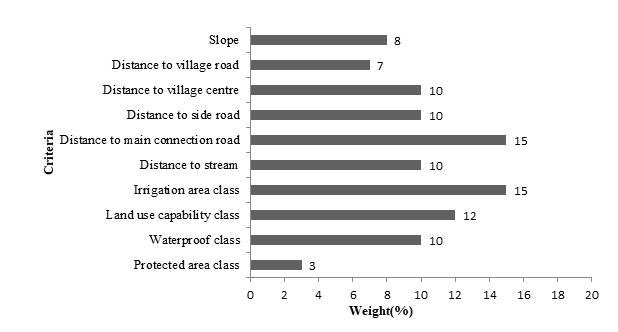
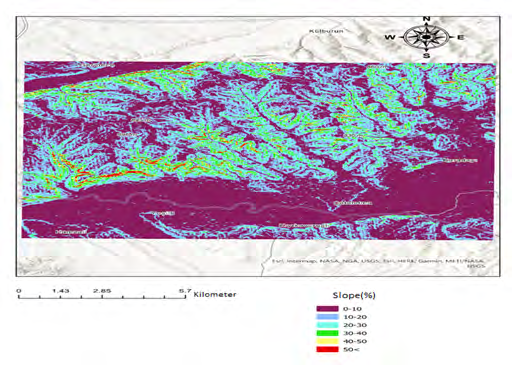
Distance-related criteria have been reclassified from 0 to 12 km. Class numbers are not equal, but class weights, or preference scales, have been decreased in a systematic manner. The slope rate is also a significant consideration for agricultural activity in study area. Slope preference scales were assigned at 10% intervals. As preference scales, 0-30% intervals were chosen to have greater values to emphasize the importance of it. The overall weights of the criteria used in ArcGIS spatial analysis are provided in Figure 5.
Figure 6 illustrates the slope map of the working area (Area of Interest-AOI) produced by ArcGIS. whereas Figure 7 represents land use capability classes.
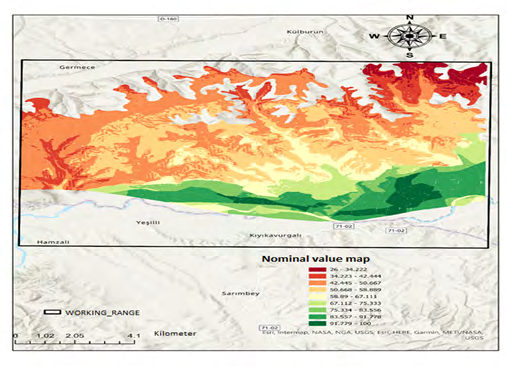
ArcGIS’s weighted overlay spatial analysis tool was applied to all criteria, and an AOI nominal value model was developed (Figure 8).
By overlaying a nominal value map over the center point of each parcel, corresponding nominal values were assigned to points as attribute data. The next step was to use a spatial join to assign point attributes to parcels.
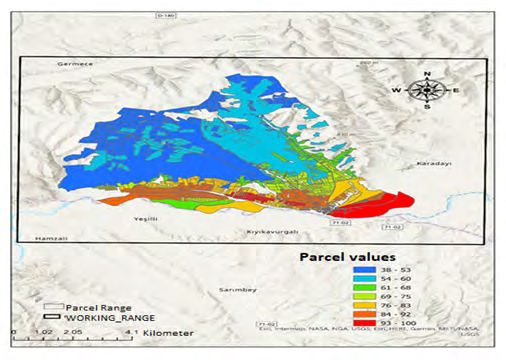
Figure 9 is the final map a combination of cadastral parcels data and nominal value map where each parcel is assigned by related class value according to centre points.
Discussion and Conclusion
In this study, four sample parcels representing three different land use capability classes (two irrigable, one medium, and one barren) were selected for comparison of two valuation methods. From the research that has been carried out, it is possible to conclude that local commissions within every municipality area rather apply subjective measures in the income valuation approach. However, the inflation rate, frequent changes in input costs, cultivated product variety, soil quality, and accessibility to irrigation lines are all critical factors influencing income. An additional weakness is that income valuation method application to each parcel is too much time-consuming process.
The application of the nominal valuation approach is based on data collection, which is typically available in various public organizations with sufficient accuracy for that purpose, and analysis in a geographical information system. The critical point is to select important factors and weights for weighted overlay functions of spatial analysis on the regional features of the study areas. The findings add to our knowledge that when fair values are compared to parcel values produced by income and nominal valuation approaches, the nominal valuation method yields much higher real values, particularly in irrigable and medium- productive areas. Further research should be done to investigate the barren areas.
It is also vital to mention, irrigation opportunities in Central and Eastern Turkey are more limited and irregular when compared to other regions of the country. While slope and irrigation are significant factor in those locations, they have no impact on the plane areas in the west and south. As a result, the Ministry of Agriculture and Forestry might optimize criteria by establishing certain basic guidelines to guide local authorities. As a final remark, even while it may take time to develop a GIS-based nominal value system for the country’s base at first, its implementation would be more realistic and prompt with routine applications such as taxation, expropriation, farmer compensation, etc [25, 26, 27, 28, 29, 30].
Declarations
Author Contribution Statement
Oktay Aksu: Analyzed and interpreted the data; wrote the paper. Agne Karlikanovaite Balikci: Analyzed and interpreted the data; reviewed and edited the paper.
References
-
World Bank (2018) Agricultural Land (% of Land Area). World Development Indicators, Indonesia.
-
Verileri BU (2022) Tarim ve Orman Bakanligi.
-
Zhang P, Hou Y (2015) Minutes of the Annual Meeting of the National Tax Association. Annual Conference on Taxation 108: 1-40.
-
Emur SH, Yildiz SG (2018) Land Speculation and Urban Rent in Turkey. Electronic Journal of Social Sciences 17(67): 1222-1233.
-
Zhongguo X, Zhuo Y, Li G, Liao R, Wu C (2019) Towards a Valuation and Taxation Information Model for Chinese Rural Collective Construction Land. Sustainability 11(23).
-
Shetty DV, Rao BP, Prakash C, Vaibhava S (2020) Multiple regression analysis to predict the value of a residential building and to compare with the conventional method values. J Phys Conf Ser 1706: 012118.
-
Eves C (2004) The use of income valuation methods to value rural property. International Real Estate Research Symposium IRES, pp: 13-15.
-
Vasile V, Comes CA, Stefan BA, Munteanu A (2015) Emerging Markets Queries in Finance and Business. Procedia Economics and Finance 32: 1-3.
-
Deshmukh H, Khare R, Pandey K, Kumar D (2016) REIS A spatial decision system for land valuation. Journal of Geomatics 10(1): 1-3.
-
Mete MO, Yomralioglu T (2021) Implementation of serverless cloud GIS platform for land valuation. International Journal of Digital Earth 14(7): 836-850.
-
Zyga J (2020) The influence analysis of criteria of comparables selection on the accuracy of the property value estimation. Reports on Geodesy and Geoinformatic 109: 9-15.
-
Christopoulou K (2009) A Geographic Knowledge Discovery Approach to Property Valuation. Thesis, pp: 1-286.
-
Kilic O, Baser U, Gulser C (2019) Factors explaining urban land value variability a case study in Atakum District, Samsun Turkey. New Medit 18(4): 79-88.
-
Nisanci R (2005) Production of pixel based urban real estate valuation maps based on Nominal Valuation Method with Geographical Information Systems. Thesis.
-
Qin C (2020) Research on the computer evaluation of land price in Urban rural Fringe Based on RS and GIS. J Phys Conf Ser 1533: 022063.
-
Gordon J (2022) Measurements.
-
Yomralioglu T (1997) Esdeger İlkesine Dayali Arsa ve Arazi Düzenlemesi Modeli. JEFOD-Kentsel Alan Duzenlemelerinde Imar Plani Uygulama Teknikleri, Sayfa, pp: 139-152.
-
Yomralioglu T, Nisanci R, Uzun B (2007) Raster Tabanlı Nominal Değerleme Yontemine Dayali Arsa Arazi Duzenlemesi Uygulamasi. HKMO Turkiye Harita Bilimsel ve Teknik, Kurultayi, pp: 2-6.
-
Mete OM (2019) Creation of Nominal Asset Value Based Map Using Geographical Informatıon Systems for Istanbul Beyoglu and Gaziosmanpasa Districts. Masters Thesis 7(2): 98-112.
-
Emlak Vergisi Kanunu (1970).
-
Raporu C (2021) Cankiri Tarim ve Orman İl Mudurlugu.
-
Ertas M (2014) Using Bare Valuation Method in Valuation of Rural Area. Engaging the Challenges Enhancing the Relevance, pp: 1-22.
-
Proximity Analysis.
-
ASF Data Search (2022).
-
Asiama KO, Bennet IR, Zevenbergen IJ, Asiama SO (2018) Land valuation in support of responsible land consolidation on Ghana’s rural customary lands. Survey Review 50(361): 288-300.
-
Bayar R (2018) Arazi Kullanimi Acisindan Turkiyede Tarim Alanlarinin Degisimi. Cografi Bilimler Dergisi CBD 16(2): 187-200.
-
Deaca V (2014) Land Valuation in Romania: challenges and difficulties. Procedia Economics and Finance 15: 792-799.
-
Emlak Vergisi Kanunu ve Degisiklikler (1970).
-
Eves C (2007) Current rural valuation practice: A survey of valuers and agribusiness managers on farm management and sustainable rural land use. Sustainable Human Settlements for Economic and Social Development Conference, Livingston, Zambia.
-
Tomic H, Matijevic H, Mastelic S, Roncevic A (2006) Development of Land Valuation System. Shaping the Change, pp: 1-9.
- Electronic Waste Management in the Top Ten Economies in the World: A Critical Review on Waste Generation, Regulations, Collection, Recycling and Environmental Challenges
- Some Challenging Transdisciplinary Aspects of the Sustainable Waste Management in the Permacrisis Context
- Use of Mobile Autonomous Systems for Pollution Control of Inland Water Bodies
- Environmental Impact Perspective Sustainable Online Textile Retailing: Harnessing Augmented Reality-Based Digital Twins in Bangladesh
- Composite Treatment Module for Removing Acidity and Metal (Loid)S from Acid Rock Drainage
- Household E-Waste Management Systems [E-Wms] in Malaysia