Ageing Health and Socioeconomic Determinants: An Introspect
The ageing population needs specific concern because of greater exposure to illness and greater need for healthcare. Therefore, ageing health has been categorised in a separate study for better resource allocation and policy evaluation. The NSS report -71st and 75th round on health give comprehensive information on the health status across various socioeconomic determinants. The report shows that health inequality has reduced over periods, although still at a high level, especially across income, gender, and age. However, NSS reports do not say much about ageing health. In this paper, the ageing health in India is discussed in detail by using the “Longitudinal Ageing Study in India (LASI)” wave-1 data, released in the year 2021. The ageing health status is evaluated across socioeconomic determinants and tried to explore how the different social factors affect ageing health and healthcare access. Further, barriers to healthcare access are also analysed across the income-class. The analyses are conducted through the logistic regression model that explores the association between the non-access to healthcare and various socioeconomic determinants.
Introduction
Ageing is a natural transformation in the physical body where a person observes many changes in the body, health, cognitive behaviour, attitude, and habits. How we treat and accept ageing depends upon our own perspective based on past living experience and the situation we perceive in future. Ageing brings both opportunities and challenges (WHO). There are many factors like income, health family, status etc., that decide the ageing life as an opportunity or challenge. However, with age, the body gets weaker and a person gradually falls to the prey of natural disability. He also becomes more vulnerable to infection and diseases. Thus, the health issue becomes one of the greatest challenges for the elders. The health challenges are apparent to face by everyone, and no one can escape of it. Now, it is the state’s healthcare system and the elder’s own financial and social capacity that decide how successfully one can overcome those challenges.
In India, there are around 104 million older people with age more than 60 years. It constitutes around 8.6% of the total population of India. The elder women are outnumbered by elder men. With medical advancement and better healthcare, the mean longevity has also increased. Currently, the life expectancy is 70.42 years in India, almost a 12% increase over the past two decades (WHO). On the other hand, the breakdown in the social fabric and decline in joint family pushed the elders into neglect and loneliness. Thus, different kinds of health issues, poor mobility, and weak support from family lead to quite a discomfort life for elders. The government’s National policy for Older Persons, 1999; Maintenance and Welfare of Parents and Senior Citizens Act, 2007; and National Policy for Senior Citizens 2011 provide a comprehensive legal framework to support the need of elders. Apart from these, there are several welfare schemes currently running. ‘Varishta Mediclaim Policy’, ‘Rashtriya Vayoshri Yojana’, ‘Vayoshreshtha Samman’ are some of the government schemes for elders to financially support them in their livelihood and medical needs.
The National Sample Survey (NSS) 71st and 75th round survey on health reveals that healthcare access in India is quite uneven. The degree of healthcare access largely varies across the socioeconomic determinants. For example, urban households have greater healthcare access than rural ones; men have greater healthcare access than women and people from the upper caste are better off than others in healthcare access. The majority of the elder population live in the rural area and therefore, the cases of unmet need among them is higher (NSS 75th round survey). The rural healthcare centres are also ill-managed with fewer number of doctors & staff and poor facilities [1]. Hence, the elders in rural areas have less healthcare access than elders in urban areas. Similarly, the impacts of gender and income gap are largely observed on healthcare access (NSS 75th round survey), the condition of male elders from the poor income class is more worrisome. The poor healthcare access among the elders is caused by three major sources – first, their own poor physical immobility and large dependency on others create high unmet needs for them. Second, the unsupportive attitude of their family (generally observed in urban areas) makes them vulnerable to speedy health deterioration in absence of timely medical intervention. Third, the socioeconomic status of an elder, sometimes proves to be burden for elders and lead them to high unmet need.
In this paper, we analyse the status of health and unmet need (non-access to healthcare) among the elders across socioeconomic determinants like gender, caste, class, education and others. There are several chronic and communicable diseases, an elder is exposed of. However, we take only the ‘hypertension’ chronic disease in our study due to its vast impact on the elder’s health and its strong association with other health issues. The study helps to identify the most marginalized elders who have larger unmet needs so, appropriate healthcare intervention can be designed and implemented. Most of the government’s elder policy and schemes are equally apply to all. However, few of them are specifically designed for the poor elders or elders from Schedule Caste & Schedule Tribe (SC-ST) community (eg: Ayusman Bharat scheme; Ambedkar Medical Aid Scheme etc), no other specific provisions for elders from rural areas, women elders, and elders from Other Backward Group (OBC). Hence, it is important to identify the real beneficiary of elder health policy and plans to make healthcare access available to them at par of others so, they may also lead a dignified life.
Data and Methods
The study is based on secondary data taken from Longitudinal Ageing Study in India (LASI) – Datasets wave 1 (2017-18) that consists of in-depth data on ageing, economic aspects, health status, social relationships, social support, family, and life satisfaction among the elders. The data is available on all India level with the sample size of 73,396 elders with age 45 and above.
First, the overall health status of elders across different socioeconomic determinants is studied through descriptive statistics. The findings are presented through tables and graphs. Then, a regression model is run to test the association of hypertension with socioeconomic determinants. The model is as follows:
Y (hypertension) = α + β (Place of residence) + β (Income class) + β (Gender) + β (Caste) + β (Living with spouse) + (β (Working status) + β (Education level) + β (Religion) + €0 Another regression model is run to test the association between the unmet needs (non-access to healthcare) among the elders and the socioeconomic determinants. The model is as follows: Y (unmet need) = α + β (Place of residence) + β (Income class) + β (Gender) + β (Caste) + β (Living with spouse) + (β (Working status) + β (Education level) + β (Religion) + €0 All the calculation and analyses are done in SPSS ver. 20. The findings are presented through tables and graphs followed by discussion and conclusion.
Result and Analysis
Demography of Elders
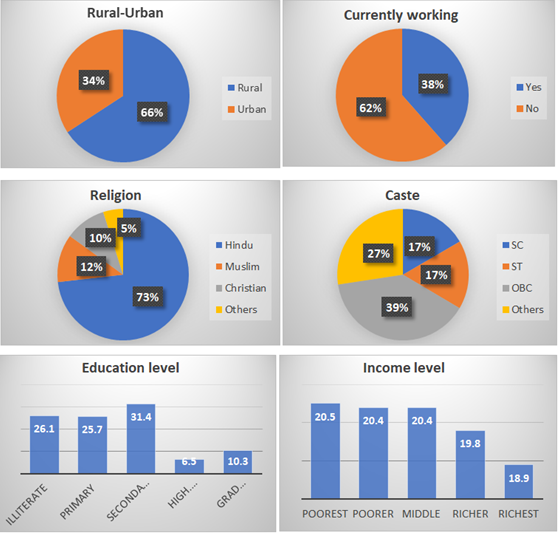
Following graphs shows a brief of elders’ demography as per data used in our study.
A large number of elders live in rural areas. Around 66% of elders are from rural areas while rest 34% are from urban areas. Of those who are currently working, the percentage is 62%, while the rest 38% are not working right now. In the data sample, around 73% of elders are Hindu, followed by 12% are Muslims and 10% are Christian. Caste-wise, the highest percentage is 39% of OBC caste, followed by 27% of General. The SC and ST castes have a percentage of 17% each. The highest number of elders are secondary educated with a percentage of 31.4%, followed by 26.1% are illiterate and 25.75 are primary educated. For those who are graduates or above, their percentage is only 10.3%. Income-wise, there is no significant differences are observed among the elders, although the poorest and poor elders have the highest percentages of 20.5% and 20.4% respectively. Around 20.4% of elders are from the middle-income class and the rest 19.8% and 18.9% of elders belong to the richer and richest classes respectively.
Health and Healthcare Access
When elders are asked about the level of satisfaction on their self-reported health status, their responses are as given in table 1 below.
| Very good | Good | Fair | Poor | Very poor |
|---|---|---|---|---|
| 3.3 | 29.3 | 43.4 | 20.8 | 3.1 |
Table 1: Level of satisfaction for health as per self-reported health status (%).
Source: LASI Wave 1 Data, 2021 Table 1: Level of satisfaction for health as per self-reported health status (%).
Around 43.3% of the elders currently find their health fair, while 29.3% of elders assume good health status. Further, around 20.8% of the elders find poor their health condition and 3.1% find their condition of health very poor. Only 3.3% of the elders find very good health conditions currently. Therefore, elders with better health conditions are outnumbered with a percentage of 72.7%.
It is also common to observe that with ageing, the health status deteriorates and therefore, the satisfaction level with health conditions decreases. Table 2 shows an increase in dissatisfaction levels as one gets older.
| Not very satisfied | Not at all satisfied | |
|---|---|---|
| 45-60 | 6.8 | 1.7 |
| 60-80 | 8.7 | 2.6 |
| More than 80 | 10.1 | 3 |
Table 2: Dissatisfaction with age (%).
The percentage of elders with ‘poor satisfaction’ and ‘no satisfaction at all’ with their health condition gradually increases with age. Of those who have aged more than 80 years, around 10.1% of them are not very satisfied with their health and 3.0% of them are not at all satisfied with their health, the highest among elders. Those who are at the early stage of eldering i.e., their age lies between 45 and 60 years, they are less dissatisfied. As per data, their percentages are 6.8% for poor satisfaction and only 1.7% for no satisfaction at all.
The satisfaction level for health status within different socioeconomic determinants are given in Table 3 below.
| Very good | Good | Fair | Poor | Very poor | |
|---|---|---|---|---|---|
| Poorest | 3 | 27.9 | 43.8 | 21.4 | 3.9 |
| Poorer | 2.6 | 28.8 | 44.6 | 20.9 | 3 |
| Middle | 3.2 | 31.6 | 43.1 | 19.3 | 2.8 |
| Richer | 3.4 | 29.3 | 42.5 | 22.4 | 2.4 |
| Richest | 4.3 | 29.1 | 43 | 20.1 | 3.6 |
| Very good | Good | Fair | Poor | Very poor | |
| Rural | 2.8 | 28.6 | 44.5 | 20.9 | 3.2 |
| Urban | 4.2 | 30.8 | 41.4 | 20.6 | 3 |
| Very good | Good | Fair | Poor | Very poor | |
| SC | 3 | 25.4 | 44.8 | 23 | 3.7 |
| ST | 2.1 | 39.5 | 41.9 | 14.8 | 1.6 |
| OBC | 3.2 | 27 | 43 | 23.1 | 3.6 |
| Others | 4.3 | 28.5 | 44.4 | 20 | 2.8 |
| Very good | Good | Fair | Poor | Very poor | |
| Illiterate | 3.2 | 28.9 | 41.9 | 22.4 | 3.5 |
| Primary | 3.3 | 30.6 | 42 | 20.6 | 3.5 |
| Secondary | 5.1 | 33 | 42.1 | 17.7 | 2.1 |
| High. secondary | 6 | 34.2 | 43.5 | 14.4 | 1.9 |
| Grad and above | 12 | 47 | 32.8 | 7.3 | 0.01 |
Table 3: Level of satisfaction for health as per self-reported health status within socioeconomic determinants (%).
Source: LASI Wave 1Data, 2021 Table 3: Level of satisfaction for health as per self-reported health status within socioeconomic determinants (%).
Within the socioeconomic determinants like ‘place of residence’, ‘income class’, ‘caste’ and ‘education level’, the highest percentage of elders report Good and Fair health conditions. The responses on poor health conditions cover the third largest number of elders. Very few numbers of elders reported their health condition as either very poor or very good.
Chronic diseases are the most life-threatening factors among elders. Table 4 shows the percentage of elders who experienced one or more than one chronic disease in their life.
| Hypertension | Diabetes | Lung/heart | Arthritis | Neuroglial | Others |
|---|---|---|---|---|---|
| 35.6 | 15.8 | 13 | 18.2 | 3.8 | 13.6 |
Table 4: ** Percentage of elders experienced chronic disease.
Source: LASI Wave 1 Data, 2021 Table 4: Percentage of elders experienced chronic disease.
The highest percentage of elders have experienced ‘hypertension’ and their percentage is 35.6%, followed by ‘Diabetes (15.8%)’, and ‘Arthritis (18.2%)’. Elders with lung/ heart diseases are around 13% while with neurological disorder, their percentage is only 3.8%. Therefore, hypertension, diabetes and arthritis are three major chronic disorders, elders suffer.
If we observe these chronic diseases within income class, we would be able to know which chronic disease in most prevalent at different hierarchy of income. Table 5 shows the percentage of elders experienced chronic disease within income class.
| Hypertension | Diabetes | Lung/heart | Arthritis | Neuroglial | |
|---|---|---|---|---|---|
| Poorest | 27.3 | 11.1 | 7.5 | 15.1 | 2.4 |
| Poorer | 32.1 | 12.5 | 8.4 | 16.7 | 2.6 |
| Middle | 35 | 15.3 | 8.2 | 18.2 | 2.8 |
| Richer | 40.3 | 18.4 | 8.7 | 20.2 | 2.8 |
| Richest | 44.4 | 22.4 | 10.3 | 21.2 | 3.1 |
Table 5: ** Chronic disease within income class (%).
Source: LASI Wave 1 Data, 2021 Table 5: Chronic disease within income class (%).
The table shows an interesting result. The richer and richest class have experienced all five chronic diseases in the highest percentage, followed by the middle-income class and the poor.
A significant number of elders have also not visited the healthcare facilities nor consulted to any healthcare service provider. Hence, a good number of cases of unmet need also arises. Table 6 shows the cases of unmet needs of elders across the income class.
| Poorest | Poorer | Middle | Richer | Richest |
|---|---|---|---|---|
| 26.1 | 21.1 | 20.6 | 17.1 | 15.2 |
Table 6: ** Unmet need across income class (%).
Source: LASI Wave 1 Data, 2021 Table 6: Unmet need across income class (%).
The cases of unmet needs among the poor are highest at more than 47%. Around 20.6% of unmet need falls to the middle-income class while, the rest 32% of unmet need is observed among the rich.
Regression Result
The regression result of hypertension associated with socioeconomic determinants are given in Table 7 below.
| B | S.E. | Sig. | Exp(B) | |
|---|---|---|---|---|
| Rural (Ref: Urban) | 0.39 | 0.052 | .000** | 1.477 |
| Income class (Ref: Richest) | .000** | |||
| Poorest | 0.362 | 0.084 | .000** | 1.437 |
| Poorer | 0.308 | 0.078 | .000** | 1.361 |
| Middle income | 0.316 | 0.074 | .000** | 1.371 |
| Richer | 0.062 | 0.072 | 0.39 | 1.064 |
| Female (Ref: Male) | 0.265 | 0.081 | .001** | 1.303 |
| Caste (Ref: Others) | .000** | |||
| SC | 0.133 | 0.086 | 0.124 | 1.142 |
| ST | 0.396 | 0.091 | .000** | 1.486 |
| OBC | -0.027 | 0.058 | 0.64 | 0.973 |
| Living with spouse (Ref: Yes) | -0.126 | 0.209 | 0.548 | 0.882 |
| Currently working (Ref: No) | 0.592 | 0.052 | .000** | 1.808 |
| Education level (Ref: illiterate) | .000** | |||
| Primary | 0.327 | 0.095 | .001** | 1.386 |
| Secondary | 0.228 | 0.086 | .008** | 1.256 |
| High. Secondary | -0.013 | 0.092 | 0.889 | 0.987 |
| Grad and above | -0.003 | 0.106 | 0.981 | 0.997 |
| Religion (Ref: Others) | 0.024 | |||
| Hindu | -0.057 | 0.107 | 0.592 | 0.944 |
| Muslim | 0.138 | 0.087 | 0.112 | 1.148 |
| Constant | -0.53 | 0.247 | .032* | 0.589 |
Table 7: Association of hypertension with socioeconomic determinants.
*p < 0.05; **p < 0.01 Source: LASI wave 1 data: 2021 Table 7: Association of hypertension with socioeconomic determinants.
The covariates, ‘income class’, ‘gender’, ‘caste’, ‘working condition’ and ‘education level’ are significantly associated with hypertension. As we move to the lower income quintile, the odd ratio of hypertension gradually increases. Women are 1.3 times more likely to get hypertension than men. Elders from schedule tribes are 1.49 times more likely to get hypertension than an elder from general category. Further, if an elder is currently working, the likelihood of getting the hypertension is 1.81 times more likely. Elders who are less educated are more vulnerable to get the hypertension than who have higher degree. Table 8 shows the association of unmet need with socioeconomic determinants.
| B | S.E. | Sig. | Exp(B) | |
|---|---|---|---|---|
| Rural (Ref: Urban) | -0.112 | 0.055 | 0.043 | 0.894 |
| Income class (Ref: Richest) | .000** | |||
| Poorest | 0.609 | 0.087 | .000** | 1.838 |
| Poorer | 0.389 | 0.082 | .000** | 1.476 |
| Middle income | 0.433 | 0.079 | .000** | 1.542 |
| Richer | 0.232 | 0.08 | .004* | 1.261 |
| Female (Ref: Male) | 0.138 | 0.087 | 0.113 | 1.148 |
| Caste (Ref: Others) | .000** | |||
| SC | -0.015 | 0.062 | 0.812 | 0.985 |
| ST | -0.163 | 0.087 | 0.062 | 0.849 |
| OBC | 0.818 | 0.085 | .000* | 2.266 |
| Living with spouse (Ref: Yes) | 0.151 | 0.216 | 0.485 | 1.163 |
| Currently working (Ref: No) | 0.312 | 0.053 | .000** | 1.366 |
| Education level (Ref: illiterate) | .018* | |||
| Primary | -0.212 | 0.101 | 0.036 | 0.809 |
| Secondary | -0.183 | 0.092 | 0.047 | 0.832 |
| High. Secondary | -0.243 | 0.1 | .015* | 0.784 |
| Grad and above | 0.043 | 0.113 | 0.702 | 1.044 |
| Religion (Ref: Others) | .000** | |||
| Hindu | 0.774 | 0.114 | .000** | 2.169 |
| Muslim | 0.438 | 0.098 | .000** | 1.549 |
| Constant | -1.824 | 0.265 | .000** | 0.161 |
Table 8: Association of unmet need with socioeconomic determinants.
*p < 0.05; **p < 0.01 Source: LASI wave 1 data Table 8: Association of unmet need with socioeconomic determinants.
The income status of an elders significantly decides the healthcare access. The poorest are 1.8 times more likely to have unmet need than the richest. Condition of the poorer is little better with odd ratio of 1.5. Elders from the middle- income class are more likely to have unmet need than the poorer. So, the poorest followed by the middle-income class are facing the higher cases of unmet need than others. Elders from the OBC group are significantly facing the unmet need and they are 2.3 times more likely to have unmet need than others. Further, among the elders who are working, the unmet need is 1.4 times higher. Education is negatively associated with the unmet need, and as one move forward in getting education, the likelihood if unmet needs decreases. Across the religion, both Hindus and Muslims have higher unmet need than other and even, the cases of unmet need are more likely to occur in Hindus.
Cause of Unmet Need
The barriers to healthcare access are both institutional and non-institutional. The institutional barriers are also called supply-side barriers because such barriers arise due to inefficiency of the service providers like medical institutions, government, and other health service bodies. Poor hospital facilities, inadequate number of doctors and medical staffs, unavailability of check-up and diagnosis facilities, unavailability of health centre near dwelling area, high cost of healthcare etc are institutional barriers that are out of control of an elder and household. The non-institutional barriers are household specific barriers and therefore, broadly based on the socioeconomic structure of household. Poor status of income & wealth, poor education, low caste, old age, small/ large family size etc., are non-institutional barriers.
Peter, et al. [2] classified both institutional and non- institutional barriers into four major dimensions – (i) Availability, (ii) Affordability, (iii) Accessibility, and (iv) Geographical accessibility. Under each dimension, both demand and supply-side barriers are suggested. For example, under the Availability dimension, low demand of healthcare services is the demand-side barrier while, inadequate number of doctors, poor equipment, unavailability of drugs etc, are supply-side barriers. Similarly, under the Affordability dimension, low willingness to pay for healthcare is the demand-side barrier while, high cot to healthcare is supply- side barrier.
Institute of Medicine (IOM) model of barriers to healthcare access also provide a wide range of barriers under three major dimensions – (i) Structural, (ii) Financial, and (iii) Personal. The structural and financial dimensions involve all major barriers as covered by the barrier model given by the peter et al. (2008), although in personal barriers, cultural and cognitive barriers are also included.
Cognitive barriers are also important to recognise as elder’s perception about the illness and the willingness of access the healthcare is primarily driven by the psychological reasons rather than others.
Graph 1 shows the proportion of few major reasons of non-access to healthcare
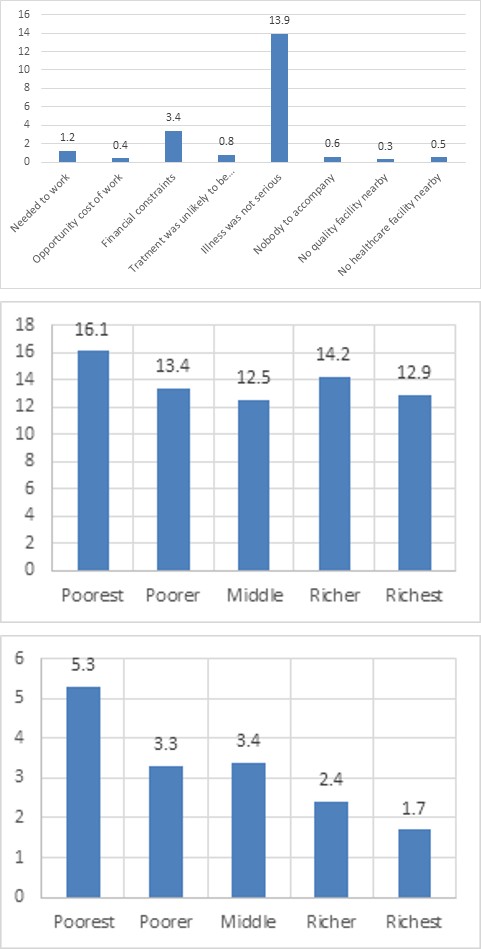
Source: LASI wave 1 data Graph 1: Reasons of non-access to healthcare Around 13.9% of elders didn’t find the illness serious enough and hence, they didn’t access the healthcare. Around 3.4% of elders found financial constraints as major barrier to healthcare while, 1.2% of them needed to work so they didn’t access healthcare.
The two top reasons of unmet needs are further explored across the income-class are given in Graph 2 and 3 below.
Source: LASI wave 1 data Graph 2: Financial constraint.
The reason of financial constraint is highest among the poorest and around 5.3% of the poorest elders don’t access to healthcare because of either high healthcare cost or low income. Among the poor, this percentage gets lowered to 3.3%, although in middle-income class, the percentage marginally increases to 3.4%. Further among the rich and richest, the percentage further falls to 2.4% and 1.7% respectively.
Source: LASI wave 1 data Graph 3: Illness not serious enough across the income- class.
The reason of ‘illness not serious enough’ has comparatively uniform distribution across the income-class. Around 16.2% of poorest doesn’t find the illness serious enough to access the healthcare and this percentage gradually falls to 13.4% and 12.5% among the poorer and middle- income class. Further, among the rich-class, around 14.2% of elders find the illness not serious enough, higher cases than the poorer has, and among the richest, the percentage is 12.9%, higher than the middle-income class has.
Discussion
Hypertension is one of the leading health issues among the elders Vasan, et al. [3] & Levi, et al. [4]. Apart from several physiological changes, there are several other factors that significantly contribute to the development of hypertension. The relationship between socioeconomic status and hypertension is quite complex and unclear, but recent studies have confirmed that poor socioeconomic status leads to the high prevalence of hypertension [5, 6]. In our study, except for the rural-urban gap and gender gap, all the socioeconomic determinants are significantly associated with hypertension among the elders. Further, it is found that the poor are more vulnerable to hypertension along with the people who are currently working. The SC-ST group are less exposed to hypertension than others, while better education lessens the chances of hypertension.
As far as the role of socioeconomic status in unmet needs is concerned, the rural-urban gap significantly contributes to health status and healthcare access. Poor healthcare facilities along with other infrastructure deficiencies like poor transportation, lack of diagnostic devices, lack of intensive care support, a smaller number of beds, doctors, and nurses etc., are some of the major issues, the rural area faces and hence, healthcare access turns to be low with poor health outcomes [7]. However, in a few studies, health issues are more profound in urban areas [8, 9]. Overall, there is a mix of results on health status and healthcare access between the rural and urban areas.
Income and wealth are the most prominent determinant of ageing health conditions [10]. The higher the income, the higher the healthcare access [11]. In our result, the cases of unmet needs of middle-income class elders are even higher the unmet needs of the poor. It is due to the reason that the financial assistance in the form of health insurance coverage by the government mainly covers poor families. The rich are themselves capable of financing any healthcare needs. It is the middle-income class who has neither sufficient savings nor any financial support to healthcare services and hence, they are largely left of accessing quality healthcare services.
The cases of unmet needs arise due to both physical and cognitive reasons. In country like India, the public health infrastructure is poor and inadequate. The public health expenditure is only 1.02% of the country’s GDP, equivalent to only Rs. 3 per capital per day (National health profile, 2018). The Indian health system is severely marred with inadequate doctors, nurses, primary and tertiary healthcare centers, hospital and others. Consequently, a large section of population depends upon the private healthcare system which leads to the high Out-of-the-Pocket expenditure (OOPE). In India, the OOPE is as high as 54.78% of total health expenditure (World Bank, 2022), higher than most of the poor countries like Congo (45.86%), Angola (37.46%) and Bhutan (17.79%). The cost of medicine is the top most reason contributory factor of high OPPE Saksena [12] & Shahrawat, et al. [13] followed by doctor’s fees. Therefore, high OOPE prevents the people to access the healthcare and creates high unmet need Falkingham, [14]. In our study, the higher case of unmet needs among the middle-income class indicates the two important things. First, the poor income class usually access the public healthcare for any health requirement while, the middle-income class is comparatively more relied on the private health sector and therefore, they borne more healthcare related cost than the poor. Thus, middle-income class faces higher OOPE which in turn, prevents them to healthcare access. Second, the middle-income class is also more concerned about their moderate life condition which push them for higher savings and left little money to spend on other heads including healthcare. Hence, high OOPE and higher family responsibility and financial obligation makes the middle-income class more vulnerable to healthcare access.
The healthcare access of SC-ST group is better than others. It is due to the reason that there are several health schemes available for SC-ST group. The ‘Tribal relief fund’ and Ambedkar Medical Aid Scheme are few of them. There is no such specific health support to the other backward group and hence, the poor healthcare access is highly observed among them. Religion wise the cases of unmet need is higher among the Hindus. However, the Hindus are comparatively wealthier than others [15, 16] and hence, financially, their healthcare access is greater than others. But, in our findings, higher cases of unmet needs among Hindus indicate other socioeconomic factors significantly contribute to their non- access to healthcare, and therefore, such factors need to be explored.
As far as education is concerned, there is a positive correlation between health status and education level [17, 18]. A similar result is also observed in our findings. Hence, better education may lead to high healthcare access and health condition among the poor. The other factor like the gender gap is not found to be significant to unmet needs in our study.
The case of ‘ignorance of illness’ is more prevailed among the rich. There is a psychological reason of it. Rich class is financial affluent and therefore, they have strong financial resources to meet any health exigency, if arises. Early prevention of disease or early treatment of any illness is widely suggested Leonard [19] & Kisling, et al. [20]. Apart from the health benefit of such early initiatives, the financial cause is also prominent. Early treatment leads to huge savings of medical and treatment expenses. People from the poor and middle-income class are very much concerned of their financial position and perhaps, it is the major cause that they seek healthcare soon. In contrast, the rich-class has sufficient financial back up and therefore, financial constraint to healthcare is not significant for them. Hence, they often ignore the illness, although it is not good.
Conclusion
The elders face several physical and social challenges in their life. With ageing, their capability of doing the work gets reduced. They turn out to be highly vulnerable to both communicable and chronic diseases. Psychological issues also arise. At an older age, their source of income is either seized or limited. Overall, the phase of the ageing period, especially after the age of 60, becomes very challenging. The absence of family support, financial support and the public health system makes their lives not better than a hype of burden. Assuring better healthcare access is one of the several contributory factors that lead to a dignified life for elders. The unmet need across socioeconomic determinants shows that elders from the middle-income class and OBC group are more likely to have unmet needs and therefore, the government health policy and schemes should also incorporate these two factors for better health intervention. Apart from it, the common approach to prevention and treatment also needs to be rectified. Government should run Health Awareness Program on large scale. people should be aware of the long-term benefit of early prevention and treatment. It will not only reduce the financial burden, but also ensures a better life in later age.
References
-
Rao KS (2005) Delivery of health services in the public sector. In: consultants PGL, editor. Financing and delivery of health care services in India. New Delhi: National Commission on Macroeconomics and Health, Ministry of Health and Family Welfare, GoI.
-
Peters DH, Garg A, Bloom G, Walker DG, Brieger WR, et al. (2008) Poverty and access to health care in developing countries. Annals of the New York Academy of Sciences, 1136: 161-71.
-
Vasan RS, Beiser A, Seshadri S, Larson MG, Kannel WB, et al. (2002) Residual lifetime risk for developing hypertension in middle-aged women and men: the Framingham Heart Study. JAMA 287(8): 1003-1010.
-
Levy D, Larson MG, Vasan RS, Kannel WB, Ho KK (1996) The progression from hypertension to congestive heart failure. JAMA 275(20): 1557-1562.
-
Grotto I, Huerta M, Sharabi Y (2008) Hypertension and socioeconomic status. Curr Opin Cardiol 23(4): 335-339.
-
Leng B, Jin Y, Li G, Chen L, Jin N (2015) Socioeconomic status and hypertension: a meta-analysis. J Hypertens 33(2): 221-229.
-
Asaria M, Mazumdar S, Chowdhury S, Mazumdar P, Mukhopadhyay A, et al. (2019) Socioeconomic inequality in life expectancy in India. BMJ Global Health 4(3).
-
Gupta I, Mondal S (2014) Urban health in India: who is responsible? International Journal on Health Planning and Management 30(3): 192-203.
-
Gupta I, Mitra A (2002) Basic amenities and health in urban India. Natl Med J India 15: 26-31.
-
Cairney J, Arnold R (1996) Social class, health, and aging: socioeconomic determinants of self-reported morbidity among the noninstitutionalized elderly in Canada. Can J Public Health 87(3): 199-203.
-
Asada Y, Kephart G (2007) Equity in health services use and intensity of use in Canada. BMC Health Serv Res 7: 41.
-
Saksena P, Xu K, Elovainio R, Perrot J (2010) Health services utilization and out-of-pocket expenditure at public and private facilities in low-income countries. World Health Rep 20: 20.
-
Shahrawat R, Rao KD (2012) Insured yet vulnerable: Out-of-pocket payments and India’s poor. Health Policy Plan 27(3): 213-221.
-
Falkingham J (2004) Poverty, out-of-pocket payments and access to health care: Evidence from Tajikistan. Soc Sci Med 58(2): 247-258.
-
Bhaumik SK, Chakrabarty M (2008) Earnings Inequality in India: Has the Rise of Caste and Religion Based Politics in India Had an Impact? Econ Stor.
-
Tagade N, Nayak A, Thorat S (2018) Wealth Ownership and Inequality in India: A Socio-religious Analysis. Journal of Social Inclusion Studies 4(2): 196-213.
-
Zajacova A, Lawrence E (2018) The relationship between education and health: reducing disparities through a contextual approach. Annu Rev Public Health 39: 273- 289.
-
Propam F, Tannelli C (2021) Does comprehensive education reduce health inequalities?. SSM-Population Health 15.
-
Syme SL (2007) The prevention of disease and promotion of health: the need for a new approach. Eur J Public Health 17(4): 329-330.
-
Kisling LA, Das JM (2023) Prevention Strategies. In: Stat Pearls.
- Origin, Evolution, and Functional Impact of Short Insertion- Deletion Variants in Human Genomes: A Review
- Harnessing Molecular Glues for Next-Generation Vaccine, Cancer and Cardiovascular Disease Drug Development: A Comprehensive Review
- Lateral Cervical Epidermal Inclusion Cyst in a Paediatric Patient: A Rare Case Report
- Malarial Plasmodium Falciparum with Hepatitis B and C Virus Infections among Blood Donors in Ife Central Local Government Area, Ile Ife, Osun State, Nigeria
- Withanolides and Withaferin A- What’s next in Ashwagandha Research
- Designing of Dual Pulse Photoacoustic Tomography for Imaging of Drug-Response and Tumor Growth