Adsorption of Bisphenol A on NH4OH- Modified Rice Husk and Sugar Cane Bagasse Biochar
Objective: This study investigates the adsorption of bisphenol A (BPA) using ammonium hydroxide (NH₄OH)-modified biochar derived from rice husk and sugarcane bagasse. Methods: The biochars were produced through a simple carbonization process and characterized using Scanning Electron Microscopy with Energy Dispersive X-ray (SEM/EDX) and Fourier Transform Infrared Spectroscopy (FTIR). SEM/EDX results indicated an amorphous structure, while FTIR analysis revealed functional groups such as alkanes and alkynes. Batch experiments were conducted to examine the influence of adsorbent dosage, contact time, initial BPA concentration, pH, and temperature. Results: The adsorption performance of the sugarcane biochar (SCB) increased with longer contact time, whereas rice husk biochar (RHB) showed minimal variation. RHB achieved a maximum removal efficiency of 82.32% at 0.8 g dosage. At 50 mg/L BPA concentration, RHB demonstrated the highest adsorption capacity (84.11%). Changes in pH and temperature also impacted adsorption efficiency. Optimal performance for both biochars was observed at 85 °C, with SCB achieving a maximum removal of 79.92%. Overall, RHB was more effective across variations in initial concentration, contact time, pH, and dosage, while SCB performed better with changes in temperature. Conclusion: These findings highlight the potential of modified rice husk and sugarcane bagasse biochars as low-cost and sustainable adsorbents for BPA removal.
Abbreviations
BPA: Bisphenol A; NH4OH: Ammonium Hydroxide; RHB: Rice husk biochar; SCB: Sugar Cane Biochar; FTIR: Fourier Transform Infrared Spectroscopy; SEM/EDX: Scanning Electron Microscopy with Energy Dispersive X-Ray Spectroscopy
Introduction
The growing contamination of aquatic environments by organic pollutants has driven extensive research into efficient and sustainable remediation strategies. Among these, adsorption has emerged as a prominent technique for the removal of hazardous compounds from aqueous media due to its simplicity, cost-effectiveness, and high efficiency [1–4]. Adsorption is fundamentally a surface phenomenon in which molecules from a fluid phase accumulate on the surface of a solid, resulting in a higher concentration of the adsorbate on the adsorbent interface [5]. In this context, the material to which the pollutant adheres is termed the adsorbent, while the accumulated species is referred to as the adsorbate.
One such hazardous compound of increasing concern is Bisphenol A (BPA), a synthetic organic compound widely used as a plasticizer. BPA has been extensively incorporated since the 1960s in the production of polycarbonate plastics and epoxy resins, including applications in food and beverage containers, water supply pipes, medical devices, and dental materials [6–8]. Due to its widespread use, BPA has become pervasive in the environment, with global production exceeding six billion pounds annually [6]. Its persistence in water sources and documented endocrine- disrupting effects have raised significant health concerns, prompting rigorous investigations into effective removal techniques.
A variety of adsorbents, such as activated carbon, zeolites, and biochar-based composites, have been studied for BPA adsorption in aqueous systems. Among these, biochar has received increasing attention owing to its advantageous physicochemical properties and sustainability credentials [9]. Biochar (BC) is a carbon-rich solid material produced through the pyrolysis of biomass under oxygen-limited conditions [10, 11]. It is characterized by a highly porous structure, extensive surface area, and the presence of diverse surface functional groups, making it highly effective for the adsorption of both hydrophilic and hydrophobic organic pollutants [12, 13].
Notably, biochar exhibits several desirable properties, including low production cost, environmental compatibility, high cation exchange capacity, and the presence of mineral- rich compositions derived from agricultural residues.
These attributes make biochar a promising adsorbent for environmental remediation [14]. However, despite these advantages, raw biochar typically suffers from limitations such as low bulk density and fine particle size, which hinder its post-adsorption separation, regeneration, and practical scalability.
To overcome these drawbacks, recent studies have advocated for the chemical modification of biochar to enhance its adsorption performance and reusability. This study therefore, explores the possibility of to employ a low- cost adsorbent (eg Biochar) to replace them. This study therefore, explores the possibility of producing Ammonium Hydroxide (NH4OH) modified biochar (using husk/sugar cane bagasse) as adsorbent material for the removal of Bisphenol A (BPA).
Materials and Methods
Materials
Biomass Sources Rice husk (RH) and sugarcane bagasse (SC) were collected from a dumpsite located in Ogbe-Hausa, Abakaliki, Ebonyi State, Nigeria. These lignocellulosic biomasses were selected due to their local availability and potential for biochar production.
Chemicals All chemicals used were of analytical grade, obtained from British Drug House (BDH), and used without further purification. The reagents included Bisphenol A (BPA), 0.5 M potassium hydroxide (KOH), 0.5 M nitric acid (HNO₃), and ammonium hydroxide (NH₄OH).
Apparatus The apparatus used include an electric oven (Model: DHG-9023A, DONGGUAN YIHUI), electronic weighing balance (Model: MB2610, Sartorius, sensitivity ±0.0001g), measuring cylinders (Borosil 1000ml/500ml, Class B), beakers (Pyrex 250ml, 500ml, 1000ml), stainless steel spatula (6-inch), volumetric flasks (Pyrex Class A 100ml/250ml/500ml), vernier caliper (Model: Insize 150mm Digital), muffle furnace (Model: SX2-2.5-12A, Hunan Xiangyi), carbonizer (locally fabricated, mild steel type), filter paper (Whatman No. 1, 110mm), mechanical shaker (Model: KJ-201BD, Kejian), UV-Vis spectrophotometer (Model: UV-2500, Labtech), desiccator (glass vacuum type, 250mm, Borosil), scanning electron microscope with EDX attachment (Model: Phenom ProX, Thermo Fisher Scientific), and FTIR spectrometer (Model: IRSpirit, Shimadzu or Cary 630, Agilent).
Methods
Pre-treatment of Biomass The rice husk (RH) and Sugar cane bagasse (SC) were sun-dried for seven days to reduce moisture content. The dried biomass was weighed and carbonized in a laboratory carbonizer. The resulting char was sieved to obtain fine particles.
Preparation of Biochar
Carbonization The pre-treated RH and SC were subjected to pyrolysis at 200 °C for 30 minutes in a muffle furnace under limited oxygen conditions.
Chemical Activation: The resulting carbon was activated using 0.5 M NH₄OH in a 1:3 weight-to-volume ratio and soaked for 24 hours. The activated biochar was subsequently washed with distilled water until a neutral pH was achieved and then oven-dried. A calibration curve for BPA was developed by preparing standard solutions ranging from 50 to 130 mg/L and recording absorbance at 276 nm using the UV-Vis spectrophotometer.
Characterization of Biochar
Surface Morphology and Functional Groups
The morphology and elemental composition of the biochar were determined using SEM/EDX. Functional groups present on the biochar surface were identified using FTIR spectroscopy.
Bulk Density
Twenty grams (20 g) of each biochar sample was gently poured into a 100 mL measuring cylinder, and the volume was recorded. Bulk density was calculated using:
( ) ( ) 3 / cm weight of sample g Bulk density g volumeof sample =
Moisture Content
Two grams (2 g) of each biochar sample was weighed into a pre-weighed crucible (W₁), dried at 59 °C for 3 hours in an oven, cooled in a desiccator, and reweighed (W₃). Moisture content was calculated using:
2 1 % 100 w w Moisturecontent w w − = × −
( ) 3 1 Where; W1 = weight of beaker W2 = weight of sample W3 = weight of ash + beaker
Adsorption Experiments
Effect of Contact Time
A fixed amount (0.06 g) of each biochar was added to 10.0 mL of 70 mg/L BPA solution. The mixture was agitated for varying contact times (20, 40, 60, 120, and 150 minutes), filtered, and the residual BPA concentration was determined using a UV-Vis spectrophotometer at 276 nm. The pH was maintained at 6.0. The percentage adsorption was calculated using:
0 % 100 e c c adsorption c − = ×
0 Where Co& Ce are the initial and equilibrium concentrations (mg/L), respectively.
Effect of Biochar Dosage
Various dosages (0.05, 0.06, 0.07, 0.09, and 0.10 g) of each biochar were added to 10.0 mL of 70 mg/L BPA solution. After 40 minutes of agitation, samples were filtered and analyzed for BPA concentration. pH was kept constant at 6.0. Adsorption efficiency was determined as in Section 2.4.1.
Effect of Initial BPA Concentration
Different BPA concentrations (50, 60, 70, 90, 110, and 130 mg/L) were introduced into beakers containing 0.06 g of each biochar. After 40 minutes of agitation, the mixtures were filtered, and residual concentrations were measured. The pH was maintained at 6.0.
Effect of pH
The influence of pH was evaluated by preparing 70 mg/L BPA solutions adjusted to pH 3, 4, 6, 8, 9, and 10 using 0.5 M HNO₃ and 0.5 M KOH. Each solution (10.0 mL) was treated with 0.06 g of biochar. After 40 minutes of agitation, samples were filtered, and residual BPA concentrations were determined.
Effect of Temperature
To assess the influence of temperature, 0.06 g of each biochar was added to 10.0 mL of 70 mg/L BPA solution. The mixtures were agitated for 40 minutes at temperatures of 25, 40, 45, 65, and 85 °C. Residual BPA concentrations were measured post-filtration. The solution pH was kept constant at 6.0.
Results
| Element Number | Element Symbol | Element Name | Atomic Conc. | Weight Conc. |
|---|---|---|---|---|
| 8 | O | Oxygen | 67 | 51.84 |
| 14 | Si | Silicon | 15.54 | 21.1 |
| 6 | C | Carbon | 9.43 | 5.48 |
| 15 | P | Phospho- rus | 3.59 | 5.38 |
| 35 | Br | Bromine | 1.95 | 7.55 |
| 26 | Fe | Iron | 1.81 | 4.88 |
| 49 | In | Indium | 0.68 | 3.76 |
Table 2: Effect of time variation on the adsorption of bisphenol A.
Table 1a: EDX of Rice husk biochar (RHB).
Table 1a presents the elemental composition of rice husk biochar (RHB) obtained through Energy Dispersive X-ray (EDX) analysis. The biochar predominantly consists of oxygen (67.00% atomic concentration), which is indicative of oxidized functional groups or oxygen-containing compounds in the material. Silicon, a major constituent of rice husk, is also significantly present at 15.54%. Carbon, the primary element in biochar, appears in a moderate concentration of 9.43%. Trace elements such as phosphorus (3.59%), bromine (1.95%), iron (1.81%), and indium (0.68%) are also detected.
| Element Number | Element Symbol | Element Name | Atomic Conc. | Weight Conc. |
|---|---|---|---|---|
| 26 | Fe | Iron | 71.95 | 85.1 |
| 8 | O | Oxygen | 10.37 | 3.51 |
| 13 | Al | Aluminium | 6.49 | 3.71 |
| 14 | Si | Silicon | 5.98 | 3.55 |
| 19 | K | Potassium | 2.33 | 1.93 |
| 20 | Ca | Calcium | 1.55 | 1.32 |
| 15 | P | Phosphorus | 1.34 | 0.88 |
Table 3: Effect of time variation on the adsorption of bisphenol A.
Table 1b: EDX of Sugar cane biochar (SCB). Table 1b shows the EDX results for sugar cane bagasse biochar (SCB). Unlike RHB, the SCB sample contains a remarkably high atomic concentration of iron (71.95%), which could suggest the retention of metallic residues or the impact of ammonium hydroxide modification. Oxygen is present at a lower level (10.37%), while elements like aluminum (6.49%), silicon (5.98%), potassium (2.33%), calcium (1.55%), and phosphorus (1.34%) are observed in small quantities.
| Time (min) | Absorbance | Ce. Conc. | % Adsorption | |
|---|---|---|---|---|
| 20 | 2.557 | 15.04 | 78.5 | |
| 40 | 2.456 | 14.44 | 79.37 | |
| Rice Husk | 60 | 2.435 | 14.02 | 79.97 |
| (RHB) | 90 | 2.431 | 14.03 | 79.95 |
| 120 | 2.423 | 13.25 | 81.07 | |
| 150 | 2.418 | 13.22 | 81.11 | |
| 20 | 2.464 | 10.88 | 84.45 | |
| 40 | 2.449 | 10.82 | 84.54 | |
| Sugar Cane | 60 | 2.448 | 10.89 | 84.44 |
| (SCB) | 90 | 2.454 | 10.09 | 84.58 |
| 120 | 2.452 | 10.91 | 84.41 | |
| 150 | 2.477 | 10.91 | 84.41 |
Table 1: Effect of time variation on the adsorption of bisphenol A.
Table 2 highlights the influence of contact time on the adsorption of Bisphenol A (BPA) using both rice husk and sugar cane biochar. For RHB, the percentage of BPA adsorbed increased gradually from 78.50% at 20 minutes to 81.11% at 150 minutes, showing a saturation trend beyond 120 minutes. The SCB biochar exhibited even higher adsorption efficiency, reaching over 84% within the same time frame and showing relatively consistent values.
| Dosage | Absorbance | Conc. | % Adsorption | |
|---|---|---|---|---|
| 0.05 | 2.573 | 15.13 | 78.38 | |
| Rice Husk | 0.06 | 2.473 | 14.54 | 79.22 |
| (RHB) | 0.07 | 2.497 | 14.68 | 79.02 |
| 0.08 | 2.103 | 12.37 | 82.32 | |
| 0.09 | 2.472 | 14.54 | 79.22 | |
| 0.1 | 2.572 | 15.12 | 78.04 | |
| 0.05 | 2.451 | 14.41 | 79.41 | |
| 0.06 | 2.571 | 15.12 | 78.04 | |
| Sugar Cane | 0.07 | 2.572 | 15.12 | 78.04 |
| (SCB) | 0.08 | 2.572 | 15.12 | 78.04 |
| 0.09 | 2.571 | 15.12 | 78.04 | |
| 0.1 | 2.47 | 14.52 | 79.25 |
Table 4: Effect of adsorption dosage on the adsorption of bisphenol A.
Table 3 evaluates how varying the amount of adsorbent affects BPA removal. The RHB sample showed improved adsorption with increased dosage, peaking at 82.32% at 0.08 g. However, further increases did not sustain the trend, indicating a possible saturation point or particle aggregation reducing effective surface area. SCB biochar maintained a steady adsorption efficiency around 78–79%.
| Conc. | Absor- bance | Ce. Conc. | % Adsorption | |
|---|---|---|---|---|
| 50 | 2.572 | 15.12 | 84.11 | |
| Rice Husk | 60 | 2.568 | 15.1 | 78.42 |
| (RHB) | 70 | 2.572 | 15.12 | 78.04 |
| 90 | 2.569 | 15.11 | 78.41 | |
| 110 | 2.572 | 15.12 | 78.04 | |
| 130 | 2.571 | 15.12 | 78.04 | |
| 50 | 2.475 | 14.55 | 79.21 | |
| 60 | 2.401 | 14.12 | 78.82 | |
| Sugar Cane | 70 | 2.472 | 14.54 | 79.22 |
| (SCB) | 90 | 2.567 | 15.01 | 78.55 |
| 110 | 2.568 | 15.1 | 78.42 | |
| 130 | 2.572 | 15.12 | 78.04 |
Table 6: Effect of initial concentration on the adsorption of bisphenol A.
Table 4 investigates how initial BPA concentration influences adsorption. For RHB, the removal efficiency remained fairly consistent, around 78–84%, despite the increase in BPA concentration from 50 to 130 mg/L. This stability suggests that the active sites were not easily overwhelmed. Similarly, SCB showed a comparable trend with minor fluctuations, maintaining over 78% removal efficiency.
| pH | Absor- bance | Ce. Conc. | % Adsorption | |
|---|---|---|---|---|
| 3 | 1.856 | 10.91 | 84.41 | |
| Rice Husk | 4 | 1.857 | 10.92 | 84.04 |
| (RHB) | 6 | 1.86 | 10.94 | 84.37 |
| 8 | 1.859 | 10.93 | 84.34 | |
| 9 | 1.861 | 10.94 | 84.37 | |
| 10 | 1.861 | 10.94 | 84.37 | |
| 3 | 1.85 | 10.88 | 84.45 | |
| 4 | 1.84 | 10.82 | 84.54 | |
| Sugar Cane | 6 | 1.852 | 10.89 | 84.44 |
| (SCB) | 8 | 1.853 | 10.09 | 84.58 |
| 9 | 1.855 | 10.91 | 84.41 | |
| 10 | 1.855 | 10.91 | 84.41 |
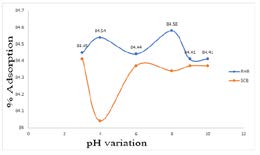
Table 8: Effect of pH variation on the adsorption of bisphenol A.
Table 5 examines how pH influences BPA adsorption. The RHB sample showed consistent adsorption percentages, averaging around 84%, from pH 3 to 10, indicating a wide operating range with minimal loss in performance. The SCB biochar also maintained similar efficiency across the pH spectrum.
| Temp (oC) | Absor- bance | Ce. Conc. | % Adsorption | |
|---|---|---|---|---|
| 40 | 2.48 | 14.58 | 79.17 | |
| Rice Husk | 45 | 2.479 | 14.58 | 79.17 |
| (RHB) | 65 | 2.464 | 14.49 | 79.03 |
| 85 | 2.465 | 14.05 | 79.92 | |
| 40 | 2.514 | 14.78 | 78.85 | |
| Sugar Cane | 45 | 2.501 | 14.71 | 78.98 |
| (SCB) | 65 | 2.512 | 14.77 | 78.09 |
| 85 | 2.51 | 14.76 | 78.91 |
Table 5: Effect of temperature variation on the adsorption of bisphenol A.
Table 6 details the impact of temperature changes on adsorption capacity. For RHB, BPA removal efficiency remained relatively stable across temperatures from 40°C to 85°C, peaking slightly at 85°C (79.92%), suggesting a mildly endothermic process. SCB showed minor variations, with slightly lower percentages overall.
| RHB (cm-1) | SCB (cm-1) | Bond | Functional group |
|---|---|---|---|
| 3570.8 | 3589.4 | O–H stretch and N–H stretch | Alcohol/phenols, amine/amides |
| ------- | 2657.6 | O–H stretch | Carboxylic acids |
| 2165.2 | 2117.1 | -C=C stretch | Alkynes |
| 1994.1 | 1986.7 | -C=O Stretch | Carbonyls |
| 1551.8 | 1684.8 | N–H bend | Amines |
| 1047.4 | 998.9 | C–H bend | Alkanes |
| 790.2 | 678.4 | --------- | Ester vibration |
Table 7: Summary of FTIR spectra bond, frequency and functional group from RHB and SCB.
Table 7 summarizes the FTIR spectral data, showing the functional groups present in the modified biochars. Both RHB and SCB display O–H and N–H stretches around 3570– 3590 cm⁻¹, indicating the presence of alcohols, phenols, and amine groups, which are critical for hydrogen bonding and BPA interaction. RHB shows a distinct carboxylic O–H stretch at 2657.6 cm⁻¹. Alkyne and carbonyl groups are observed in both samples around 2100–2000 cm⁻¹, contributing to π–π interactions with BPA. Amines and alkanes are also present, and SCB displays ester-related vibrations.
Discussion
Characterization of RHB and SCB
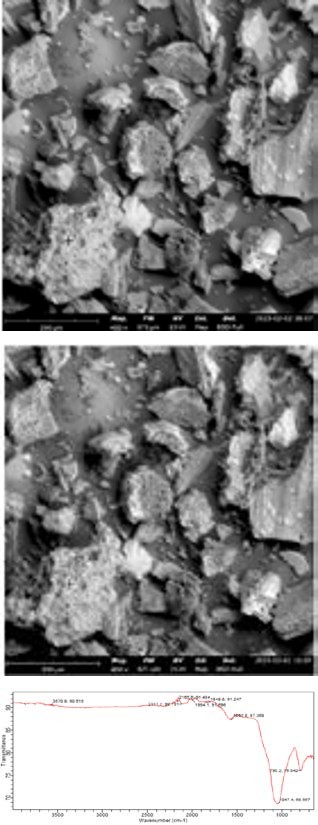
(a) EDX Result The EDX micrographs of RHB and SCB are shown in Figure 1. It can be seen that the morphologies of the RHB and SCB are rough with broken surfaces which showed the biochar contained numerous microspores which is characteristic of materials capable of adsorption. Hence, its application in the removal of bisphenol A.
(b) Figure 1 a,b: EDX micrographs after adsorption (a) rice husk biochar (b) sugar cane biochar after adsorption.
The elemental composition of the biochar adsorbents are shown in Table 1. The percentage weight concentration of the elements in the RHB could be seen to be 51.84 % oxygen, 21.10 % silicon, 5.48% carbon, 5.38 % phosphorus, 7.55 % bromine, 4.88 % Iron and 3.76 % indium. (Table 1a). in the case of SCB as shown in table 4.1b, 85.10 % iron, 3.51 % FTIR Result The spectra of the adsorbents were measured in the wave number range of 1000-3500 cm-1. The FTIR spectrum of SCB showed the presence of predominant peaks at 3589.4.cm−1 (–OH and – NH stretching), 2657.6 cm−1 (–OH stretching), 2117.1 cm−1 (stretching), 1684.8 cm−1 (– C=O Stretching).
oxygen, 3.71 % Aluminium, 3.55 % silicon, 1.93 % potassium, 1.32 % calcium and 0.88 % phosphorus. In comparing the elemental compositions obtained from the two biochar adsorbents, it can be seen that except for iron that rice husk biochar (RHB) contained more elemental composition than sugar cane biochar (SCB).
While RHB showed the highest peak at 3570.8.cm−1 (–OH and – NH stretching). All functional groups present are readily available for interaction with Bisphenol A. The observation shows that the functional groups such as NH and OH are involved in binding Bisphenol A ions to RHB and SCB [15].
Figure 2a: shows the FTIR spectra of biochar derived from rice husk.
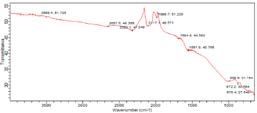
Figure 2b: The FTIR spectra of biochar derived from the sugar cane.
Adsorption of bisphenol A using RHB and SCB
Effect of Contact Time
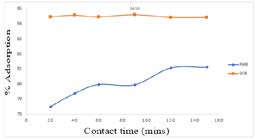
Contact time is an essential factor in studying the the adsorption process, and it determines the kinetic characteristics of adsorption. The percentage adsorption of bisphenol A ions at different times are shown in Figure 3. The adsorption test was observed over 150 mins of adsorption time, and the optimum adsorption (84.58 %) was reached at time 85 mins for sugar cane biochar adsorbent. It can be seen from Figure 3 the increase in time of contact did not actually affected the adsorption of bisphenol A using SCB. This could be as a result of no free adsorption sites on the surface of the adsorbent. However, in the case of rice husk biochar (RHB), it was visible that increase in contact time affected the rate of adsorption of bisphenol A.
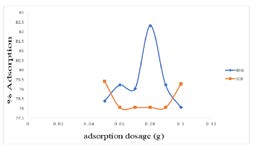
Effects of Adsorbent Dosage The effect of biochar dosage on the adsorption of bisphenol A by RHB and SCB is shown in Figure 4. In the case of RHB, it can be seen that the adsorption rate of bisphenol A increased with the increase of the biochar dosage. Between 0.7-0.8g/L, it was observed that there was a rapid and substantial increase in the percentage adsorption using RHB.
The increased removal rate can be attributed to the increased biochar, which not only increases the effective specific surface area of adsorption, but also increases the active site of adsorption. However, a very sudden decrease was observed at the dose above 0.8g/L. This is because in the case of limited solutes, too many adsorbents will not only compete for solutes, but also overlap the effective adsorption active sites on the biochar surfaces.
Effect of Initial Concentration of bisphenol A The changes in bisphenol A ion adsorption in different initial concentrations is shown in Figure 5. It was observed that with the increase of the initial concentration, the adsorption capacity of the adsorbent for bisphenol A ions initially increased rapidly and then gradually reached a point where it remained unchanged. This phenomenon can be attributed to the driving force of the concentration gradient. In addition, as the initial solution concentration increases, the solution concentration gradient increases, and the driving force also increases. Therefore, a higher driving force can promote the diffusion of bisphenol A from the solution to the adsorbent surface, thereby increasing the absorption rate and leading to a saturation of adsorption points on the surface of the adsorbent.
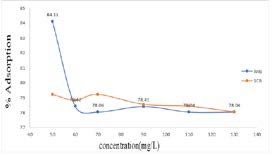
The number of adsorption sites for a certain amount of adsorbent is fixed and can only adsorb a limited amount of bisphenol A. As the initial concentration increases, bisphenol A also gradually increase. The surface adsorption sites will be progressively occupied by bisphenol A and tend to be saturated. bisphenol A adsorbent by per unit of adsorbent increases and reaches an equilibrium state [16]. Therefore, for a certain quality of adsorbent, the greater the initial solution concentration, the lower the adsorption efficiency of bisphenol A [16].
Effect of pH
The pH values of the solution play the important role in the adsorption process [17]. Fluctuations in pH can affect the states of the ionic species in solution. An experiment was conducted at an initial range of 3 to 10 pH to determine the adsorption behavior of BPA. The adsorption capacities of RHB and SCB adsorbents were found to be pH-dependent, as indicated in Figure 6. In the case of RHB, a sinusoidal pattern of variation was observed, as the percentage adsorption increased from 84.45 to 84.54 % between the pH (3-4) and still decreased to 84.44 % at pH(6.0). In the case of SCB, what seemed to be opposite of RHB was observed. At the initial time, when the pH value in the solution was increased, the percentage removal decreased rapidly. This is due the electrostatic repulsion between partially ionized BPA and negatively charged adsorbent surface at alkaline condition. Thus, this lessened the overall consumption of BPA.
This pH dependence might be largely related to the types and ionic states of the functional groups in the adsorbents and to the compound speciation in the solution [18]. Maximum percentage of adsorption (84.58%) was achieved using Rice husk biochar (RHB).
Effect of Temperature
Figure 7 shows the % adsorption of bisphenol A at different temperature. It was observed that from 40 to 65oC that increase in temperature decreased the adsorption rate of the two adsorbents. The decrease of the percentage adsorption 40 to 65oC could be explained by adsorption isotherms. At high temperature, the thickness of the boundary layer decreases, due to the increased tendency of the bisphenol A to escape from the biochar surface to the solution phase, which results in a decrease in adsorption as temperature increases [19].
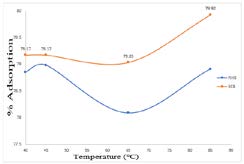
The decrease in adsorption with increasing temperature, suggest weak adsorption interaction between biochar surface and the metal ion, which supports physisorption. It was however observed in this study that further increase in temperature above 65oC resulted in increase in percentage adsorption from RHB and SCB. Maximum adsorption 79. 92% was attined at 85oC with sugar cane biochar.
Conclusion
A NH4OH modified Rice husk and sugar cane bagasse biochar were successfully produced and used as a simple, green, and cost-effective way to remove bisphenol A in aqueous solution. The NH4OH modified biochar from Rice husk and sugar cane bagasse were characterized by EDX and FTIR. The overall adsorption properties of rice husk biochar (RHB) and sugar cane biochar (SCB) showed that the modification with NH4OH had improved the performance of adsorption. It was also observed that the adsorption of bisphenol A onto RHB and SCB depends on the adsorption dosage, solution contact time, temperature, pH and initial bisphenol A concentration. The maximum adsorption (84.58%) of bisphenol A by RHB was recorded at pH variation of 8.0, while same value (84.58%) was also attained by SCB at 85 mins time variation.
Availability of Data and Materials
The data that support the findings of this study are available on request from the corresponding author.
Consent for Publication
The authors give the publisher the permission of the author to publish the work.
Conflicts of Interest
The authors declare no conflicts of interest regarding this manuscript. Funding This research project did not get any external funding.
Acknowledgments
Declared none
References
-
Tadayoni NS, Dinari M, Roy A, Karimi Abdolmaleki M (2024) Recent Advances in Porous Bio-Polymer Composites for the Remediation of Organic Pollutants. Polymers 16(11): 1543.
-
Haleem A, Shafiq A, Chen SQ, Nazar M (2023) A comprehensive review on adsorption, photocatalytic and chemical degradation of dyes and nitro-compounds over different kinds of porous and composite materials. Molecules 28(3): 1081.
-
Hlongwane GN, Sekoai PT, Meyyappan M, Moothi K (2019) Simultaneous removal of pollutants from water using nanoparticles: A shift from single pollutant control to multiple pollutant control. Sci Total Environ 656: 808- 833.
-
Shanker U, Rani M, Jassal V (2017) Degradation of hazardous organic dyes in water by nanomaterials. Environ chem Lett 15: 623-642.
-
Aljamali NM, Khdur R, Alfatlawi IO (2021) Physical and chemical adsorption and its applications. Int J Thermodynamics Chem Kinet 7(2):1-8.
-
Hoekstra EJ, Simoneau C (2013) Release of bisphenol A from polycarbonate-a review. Crit Rev food Sci Nutr 53(4): 386-402.
-
Lopes‐Rocha L, Ribeiro‐Gonçalves L, Henriques B, Özcan M, Tiritan ME et al., (2021) An integrative review on the toxicity of Bisphenol A (BPA) released from resin composites used in dentistry. J Biomed Mater Res B Appl Biomater 109(11): 1942-1952.
-
Michałowicz J, John B (2014) A–Sources, toxicity and biotransformation. J Environ Toxicol Pharmacol 3(2):738–758.
-
Lehmann I, Gaunt, J, Rondon M (2006) Biochar Sequestration in terrestrial ecosystems-a review. Mitig J Adapt Strategies Glob Chang 11(1): 403-427.
-
Novotny EH, Maia CM, Carvalho MT, Madari BE (2015) Biochar: pyrogenic carbon for agricultural use-a critical review. Revista Brasileira de Ciência do Solo 39(2): 321- 344.
-
Khodakovskaya MV, Kim BS, Kim JN, Alimohammadi M, Dervishi E, et al., (2013) Carbon nanotubes as plant growth regulators: effects on tomato growth, reproductive system, and soil microbial community. Small 9(1): 115-123.
-
Qiu Z, Wang Y, Bi X, Zhou T, Zhou J, et al., (2018) Biochar- based carbons with hierarchical micro-meso-macro porosity for high rate and long cycle life supercapacitors. J Power Sources 376: 82-90.
-
Leng L, Xiong Q, Yang L, Li H, Zhou Y, et al., (2021) An overview on engineering the surface area and porosity of biochar. Sci Total Environ 763: 144204.
-
Baltrėnaitė-Gedienė E, Marčiulaitienė E, Pranskevičius M, Titova J, Bhatnagar A et al., (2020) Physicochemical properties of pyrogenic carbonaceous product, biochar, syngenetically modified for its use in adsorption systems. J Environ Eng 146(8): 04020078.
-
Hossain A, Aditya G (2015) Biosorption of cadmium from aqueous solution by shell dust of the freshwater snail Melanoides tuberculata. Bioremediation Journal 19(1): 80-91.
-
Vijayaraghavan K, Won SW, Yun YS (2009) Treatment of Complex Remazol Dye Effluent Using Sawdust- and Coal- Based Activated Carbons. J Hazard.Mater 167(1-3): 790- 796.
-
He J, Xu Y, Wang W, Hu B, Wang Z et al., (2020) Ce (III) nanocomposites by partial thermal decomposition of Ce-MOF for effective phosphate adsorption in a wide pH range. Chem Eng J 379: 122431.
-
Islam MA, Morton DW, Johnson BB, Angove MJ (2020) Adsorption of humic and fulvic acids onto a range of adsorbents in aqueous systems, and their effect on the adsorption of other species: A review. Sep Purif Technol 247: 116949.
-
Li X, Zhang L, Yang Z, Wang P, Yan Y et al., (2020) Adsorption materials for volatile organic compounds (VOCs) and the key factors for VOCs adsorption process: A review. Sep Purif Technol 235: 116213.
- Effects of 5-HTP and Melatonin on the Sleep Cycle of Medical Students
- Comparative Assessment of the Reinforcement Efficiency of Palm Fruit Fibre and Coconut Fibre in High Density Polyethylene (HDPE) Matrix Composite
- Importance of Bio Compounds Naturally Present in Food with Functionality in Animal Metabolism
- Sub-Acute Study on the Cardiotoxic Effects of Monosodium Glutamate Ingestion in Albino Rat
- Weight Management and Its Natural Solutions: A Review
- Pharmacokinetics of the Tyrosine Kinase Inhibitor, Alectinib