Current COVID-19 Epidemic Risks in Brazil
This research uses raw clinical observational data to propose a new spatio-temporal approach for the precise prediction of the likelihood of the COVID-19 epidemic occurring at any moment in any interest Brazil state. This article presents a new bio-system reliability method that is especially appropriate for multi-regional environmental and health systems and that has been watched for a long enough time to produce a reliable long-term forecast of the likelihood of a virus outbreak. All impacted Brazilian states' daily COVID-19 recorded patient counts were taken into consideration. This research sought to benchmark a cutting-edge technique that allows for the analysis of dynamically witnessed patient numbers while accounting for pertinent regional mapping. The suggested strategy might assist in keeping track of and forecasting potential pandemic breakouts in a wide range of multi-regional biological systems.
Patient Involvement Statement
By providing an exact risk estimate of the upcoming pandemic breakout at any local state, region, and time, the creation of the study question and outcome measures is linked to patients’ goals, experiences, and preferences. Only publicly available patient health records were used in this research [1, 2, 3, 4].
Introduction
In the field of contemporary biomedical study, statistics of COVID-19 are getting considerable interest [5, 6, 7, 8, 9, 10]. It is challenging to estimate biological system reliability factors and epidemic outbreak probability under realistic epidemic conditions by using classic statistical methods, [11, 12, 13, 14, 15]. Multi-degree-of-freedom (MDOF) nature of the governing dynamic biological system, reflects recorded patients’ data regional (spatial) spread. By the beginning of 2020, the only clinical observation data for COVID-19 were no longer accessible. Recent research examined COVID-19 outbreaks in Brazil [16, 17, 18, 19, 20, 21, 22], but without concentrating on connections across various national areas or states. Brazil was obviously selected due to the country’s COVID-19 origins, significant internet health data, and related study [23, 24, 25, 26, 27, 28, 29, 30, 31, 32, 33, 34, 35, 36, 37, 38, 39, 40]. In Thomas M, et al. [12], authors used the extreme value theory (EVT) to forecast and spot flu pandemic abnormalities. The newly suggested innovative technique will be able to provide a better understanding and a sign of the potential spread of diseases because there has not been much statistical research done to forecast the likelihood of an influenza epidemic or contagious disease breakout or its spread.
In this study, an epidemic outbreak is seen as an unforeseen event that could happen in any area of a given nation at any moment, so spatial dispersal is taken into consideration. Additionally, a particular non-dimensional component λ is introduced to forecast the danger of the latter epidemic anywhere and at any moment. Environmental factors have a cyclical pattern, which affect biological processes. The other option is to think of the process as being reliant on particular environmental factors, whose change over time can be modelled as an independent ergodic process.
The public websites were used to obtain COVID-19 incidence statistics for twelve Brazilian states from February 2020 to the present [1, 2, 3, 4]. The biological system under consideration can be thought of as a multi-degree of freedom (MDOF) dynamic system with strongly inter- correlated regional components/dimensions because this priceless data collection is state-specific for Brazil. In some new research, the linear log model has been used to predict COVID-19 development [14]. It should be noted that despite the study’s goal of forecasting epidemic outbreaks and lowering their risk, it only considers the number of patients who report each day, not the symptoms themselves. Regarding the so-called “long COVID,” which has persistent COVID-19 signs, its risk factors, and whether it is feasible to foresee a protracted course of the illness at an early stage. Figure 1 presents spatial distribution of COVID cases per Brazil regions, while Figure 2 presents national summed up COVID cases temporal dynamics.
![Figure 1: Brazil regions with total numbers of COVID-19 registered cases, per March 2023 [3].](/fulltextimages/10320/fig_1.png)
![Figure 2: Brazil national total numbers of COVID-19 registered cases [4].](/fulltextimages/10320/fig_2.png)
The primary driving force behind this research was the requirement to enhance currently available forecasting methods in order to account for the spatiotemporal character of epidemics. Authors of this research support a new reliability technique that has been thoroughly tested on numerous epidemiologic data sets [23, 24, 25].
Method
Let’s consider multi degree of freedom (MDOF) bio- dynamic public health system, consisting of combined components X(t),Y(t),Z(t),... stored up into vector (X(t),Y(t),Z(t),…), that has been either measured/observed/ simulated over a representative time lapse (0,T). Unidimensional biosystem component global maxima being denoted here as ( ) max $$ X _ {T} ^ {\max } = \max _ {0 \leq t \leq T} X (t) \quad Y _ {T} ^ {\max } = \max _ {0 \leq t \leq T} Y (t) $$ $$ Y _ {T} ^ {\max } = \max _ {0 \leq t \leq T} Y (t) $$ Y(t), ( ) max
0max , T t T Z Z t ≤≤ = … . By representative long time period T authors mean large enough value of T with respect to the bio-dynamic system auto-correlation, and relaxation time scales. Let 1, , X N X X … be temporally consequent component process X=X(t) local maxima, recorded at discrete temporally increasing time instants 1 X X X N t t <…< within (0,T). Identical definitions follow for other MDOF bio-system components ( ) ( ) , , Y t Z t … namely 1, , Y N Y Y … ;
1, , Z N Z Z … and so on. For simplicity, all system bio-system components, and hence their maxima have been assumed here to be non-negative $$ P = \iiint_ {(0, 0, 0, \dots)} ^ {\left(\eta_ {X}, \eta_ {Y}, \eta_ {Z}, \dots\right)} p _ {X _ {T} ^ {\max }, Y _ {T} ^ {\max }, Z _ {T} ^ {\max }, \dots} \left(X _ {T} ^ {\max }, Y _ {T} ^ {\max }, Z _ {T} ^ {\max }, \dots\right) d X _ {T} ^ {\max } d Y _ {N _ {Y}} ^ {\max } d Z _ {N _ {z}} ^ {\max } \dots \tag {1} $$
being the dynamic bio-system survival probability, with
critical/hazard values of bio-system components being
denoted as X η , Y η , Z
η ,...; ∪ being logical unity operator ( ) ( ) ( ) max max max , , , max max max max max max 0, 0, 0, , , , , , , , X Y Z «or»; max max max , , , X Y Z T T T p … being system joint probability density function (PDF) of all individual component/dimensions maxima. If bio-system number of degrees of freedom (NDOF) being large, it is not practically feasible to assess directly bio-system joint PDF max max max , , , X Y Z T T T p … ) and hence bio-system survival probability P. The latter bio-system survival probability P however, needs to be assessed, inversely linked to bio-system expected lifetime, according to Eq. (1). Bio- system unidimensional components X,Y,Z,… being now re- scaled, and non-dimensionalized as follows $$ X \rightarrow \frac {X}{\eta_ {X}}, Y \rightarrow \frac {Y}{\eta_ {Y}}, Z \rightarrow \frac {X}{\eta_ {X}}, \dots \tag {2} $$ , , , X Y X Making both of the two answers non-dimensional with a
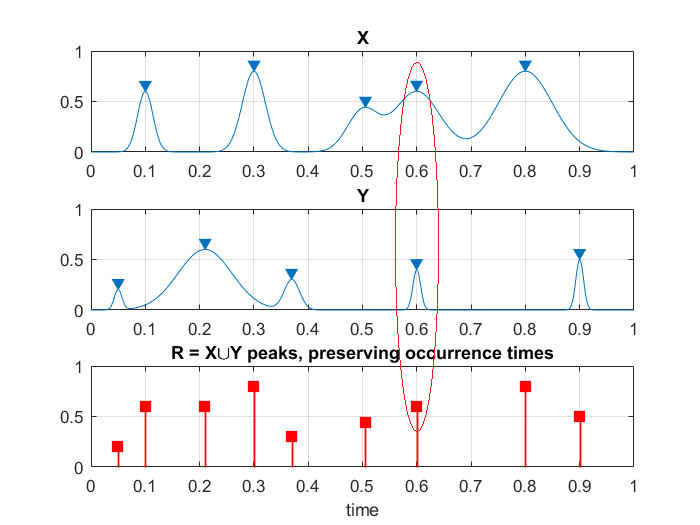
failing limit of 1. The local peaks of the unidimensional system
components are then combined into a single artificial time
$$ \vec {R} = \left(R _ {1}, R _ {2}, \dots , R _ {N}\right) $$ in accordance with corresponding bio-system merged time vector $$ t _ {1} \leq \dots \leq t _ {N}, N \leq N _ {X} + N _ {Y} + N _ {Z} $$
+…. Each bio-system
component local maxima R_j being actual encountered bio-
system component local maxima, corresponding some bio-
system component, either X(t) or Y(t), or Z(t) or other bio-
system components. Constructed bio-system synthetic R
ρ -vector has no data loss, see (Figure 3).
Having introduced temporally non-decreasing synthetic vector R ρ
, and its components corresponding temporally
non-decreasing occurrence times 1
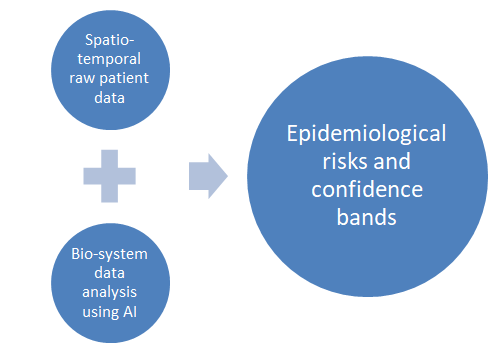
$$ t _ {1} \leq \dots \leq t _ {N}, [ 6 0 - 6 8 ]. $$ Figure 4 shows a flowchart that serves as a tool for monitoring the spread of epidemics. It illustrates the recommended approach.
Results
Prediction of influenza-like epidemics has long been the focus of attention in epidemiology and mathematical biology. It is well known that public health dynamics is a highly non-linear multidimensional and spatially cross-correlated dynamic system that is always challenging to analyse. Previous studies have used a variety of approaches to model influenza-like cases. This section illustrates the efficiency of the above-described methodology using the new method applied to the real-life COVID-19 data sets, presented as a new daily recorded infected patient time series, spread over large terrains [45, 46, 47, 48, 49, 50, 51, 52, 53, 54, 55].
COVID-19 and influenza are contagious diseases with high transmissibility to spread worldwide with considerable morbidity and mortality. They occur most frequently seasonally in late autumn, winter and early spring, reaching its peak prevalence mostly in winter. Seasonal influenza epidemics caused by influenza A and B viruses typically occur annually during winter in temperate regions and present an enormous burden on worldwide public health, resulting in around 3–5 million cases of severe illness and 250,000–500,000 deaths worldwide each year, according to the World Health Organization (WHO) [34].
This section analyzes a real-life biomedical application of the above-described reliability method. The statistical data in the present section are taken from the official Brazil websites [1, 2]. The website provides the number of newly diagnosed cases every day in Brazil from 22 January 2020 to
22 December 2022. Patient numbers from twelve different Brazil regions were chosen as components X,Y,Z,… thus constituting an example of a twelve dimensional (12D) dynamic biological system. In order to unify all 12 measured regional time series X,Y,Z,... the following scaling was performed according to Eq. (2), making all 12 regional responses non-dimensional, while having the same hazard/failure limit equal to 1. Failure limits (epidemic thresholds) were chosen differently for different regions in this paper , , , X Y Z η η η … were set equal to observed two years maxima, twice increased. Next, all local maxima from 12 measured time series corresponding to Brazil states, were merged into one single time series by keeping them in the non-decreasing temporal order:
$$ \vec {R} = \left(\max \left\{X _ {1}, Y _ {1}, Z _ {1}, \dots \right\}, \dots , \max \left\{X _ {N}, Y _ {N}, Z _ {N}, \dots \right\}\right). $$ .
Figure 5 presents new daily recorded patients number plotted as two-dimensional (2D) surface. Figure 6 presents raw (unprocessed) numbers of new daily-recorded patients as 12D system vector R ⃗, consisting of assembled regional new daily-recorded patient numbers. Note that vector R ⃗ does not have physical/biological meaning on its own, as it was assembled of different regional components, with different spatial epidemic backgrounds. Index j is just a running index of biosystem component local maxima, encountered in temporally non-decreasing sequence.
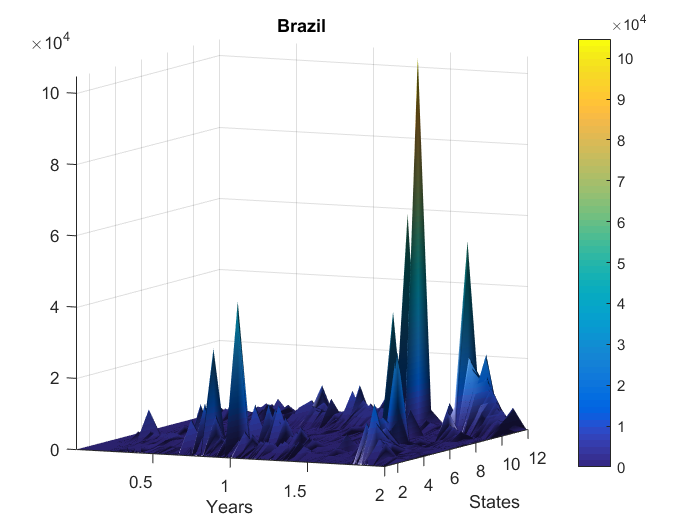
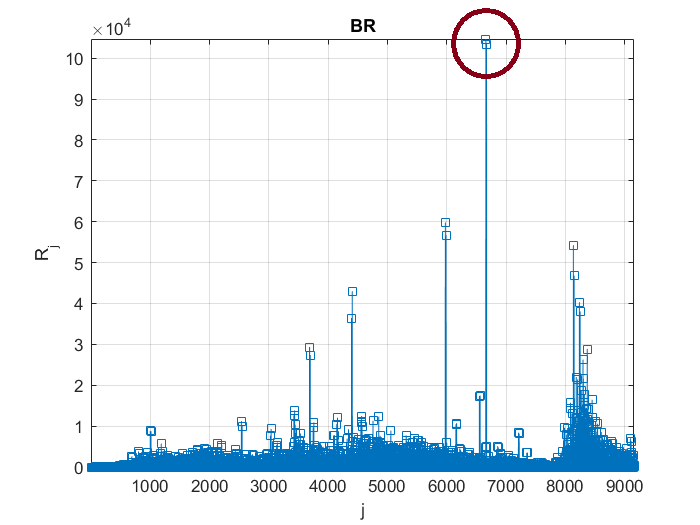
Figure 7 presents 10 years return level extrapolation towards epidemic outbreak with 10-year return period, indicated by the horizontal dotted line, and somewhat beyond, λ=0.05 cut-on value was used. Dotted lines indicate extrapolated 95% confidence interval according to Eq. (10). Survival probability P(λ) being directly related to the target hazard/failure probability 1-P from Eq. (1). Therefore, biosystem failure probability 1-Pcan be straightforwardly estimated. Note that N corresponds to the total number of system component local maxima in the unified response vector R ρ . Figure 7 exhibits reasonably narrow 95% CI. The latter is an advantage of the proposed method [44, 45, 46, 47, 48, 49, 50, 51, 52, 53, 54, 55, 56].
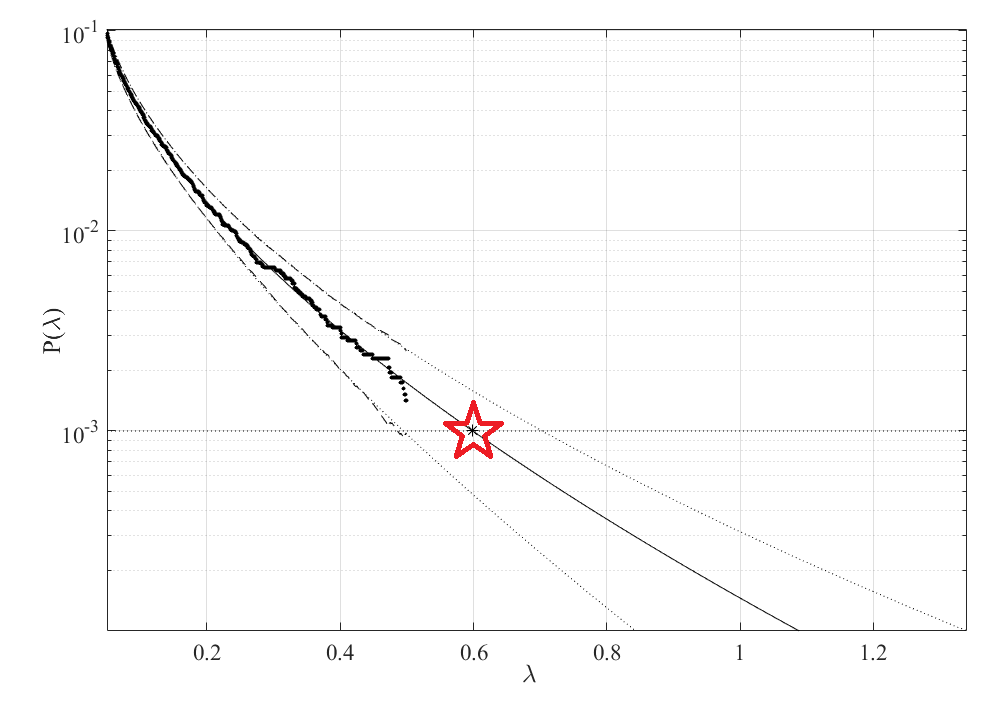
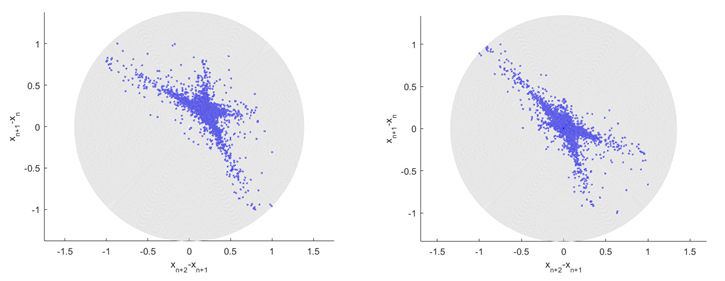
Regarding suggested method validation, it is seen from Figure 7 that even ten-times reduced data set will yield similar predictions. More specifically, the underlying data set has been thinned by selecting only each 10th data point, then extrapolation, similar to Figure 7 has been done. The above-described approach, which is novel, has the benefit of efficiently employing the measured data set that is currently accessible. This is because the technique is able to handle the multidimensionality of biological systems and conduct precise extrapolation based on a small amount of data. Keep in mind that the expected non-dimensional λ level, marked by star in Figure 7 representing target probability (risk) of epidemic outbreak at any Brazil region in the years yet to come. The Poincare plot is where the second-order difference plot (SODP) got its start. Time series data can be observed statistically using SODP in the case of sequential variations.
Figure 8 presents SODP plots of 3rd and 4th orders, these kinds of plots can be used for data pattern recognition, and comparison with other similar data sets, for example, for the entropy artificial intelligence (AI) recognition approach [57]. COVID-19 epidemic data has been analyzed recently by researchers, using AI diagnostic tools, [58, 59]. Be aware that while this research presents MDOF and sub-asymptotic approaches, EVT is asymptotic and 1DOF. In conclusion, the star in the expected non-dimensional level in Figure 7 indicates the likelihood that there will be cancer deaths in the globe in the future. The methodology’s flaw is its premise of the quasi-stationarity of the underlying bio-environmental process [65, 66, 67, 68, 69, 70, 71].
Conclusion
Despite its apparent simplicity, the current research provides a unique multidimensional modelling approach and a methodological route to apply epidemic predictions while it is still in progress. This study examined COVID-19 patient data from twelve distinct regions of Brazil, serving as an illustration of a twelve-dimensional (12D) phenomenon that was seen in 2020–2022. New daily patient counts were subjected to the innovative dependability technique in real- time as a multidimensional system. The detailed academic justification for the suggested approach is provided. It should be noted that while the use of direct measurement or Monte Carlo simulation for analysing the reliability of dynamic biological systems is appealing, the complexity of dynamic systems and their high dimensionality necessitate the development of novel robust and accurate techniques that can handle the current limited dataset, using the data that is accessible as effectively as feasible.
The primary finding is that in Brazil, if the public health system is handled properly, local environmental and epidemiological circumstances will be controlled. The chance level of an epidemic breakout over the projected 10- year return period is considerably higher than one, so it is not low. As a result, there is a chance that a pandemic will break out in the future, at least within the next 10 years.
Numerous writers using various methodologies have demonstrated the use of statistics in medicine using EVT and other models. To determine the distribution of extremes, one of these methods used the block maxima (BM) strategy and another the peak over threshold (POT) approach. Despite the fact that both of these studies demonstrated that they were suitable for predicting the extreme values, each of them had their own drawbacks, with one needing a lot of information.
A general-purpose, reliable, and simple multidimensional reliability technique was the main goal of this research. The approach described in this article has been earlier verified by application to a broad variety of simulation models, but only for one-dimensional system responses, and, generally speaking, very accurate predictions were achieved. Time series reactions can be monitored and numerically reproduced and analyzed. The suggested approach generated a reasonable confidence interval, as is demonstrated. As a result, the proposed methodology may be useful for a range of reliability research on non-linear dynamic biological systems. Finally, there are numerous uses for public health that can use the proposed approach. The application of the novel technique is not at all constrained by the COVID-19 example that is provided.
Declaration
- Ethics approval and consent to participate: n/a.
- Consent for publication: all authors agreed.
- Availability of data and materials: The datasets analyzed during the current study are readily available online, 1-4.
- Competing interests: authors declare no financial and non-financial competing interests.
- Funding: no funding has been received.
- Authors’ contributions: all authors contributed equally.
- Acknowledgements: authors confirm that all methods were performed in accordance with the relevant guidelines and regulations according Declarations of Helsinki.
References
-
https://covid19br.wcota.me/
-
https://github.com/wcota/covid19br
-
https://www.statista.com/statistics/1103791/brazil- coronavirus-cases-state/
-
https://covid19.who.int/region/amro/country/br
-
Chen J, Lei X, Zhang L, Peng B (2015) Using Extreme Value Theory Approaches to Forecast the Probability of Outbreak of Highly Pathogenic Influenza in Zhejiang, China. PLoS ONE 10(2): 1-10.
-
(2014) World Health Organization. Influenza fact sheet. In: World Health Organization website Geneva: World Health Organization 1948.
-
Goldstein E, Cobey S, Takahashi S, Miller JC, Lipsitch M (2011) Predicting the epidemic sizes of influenza A/ H1N1, A/H3N2, and B: a statistical method. PLoS Med 8(7): e1001051.
-
Soebiyanto RP, Adimi F, Kiang RK (2010) Modeling and predicting seasonal influenza transmission in warm regions using climatological parameters. PLoS One 5(3): e9450.
-
Mugglin AS, Cressie N, Gemmell I (2002) Hierarchical statistical modelling of influenza epidemic dynamics in space and time. Stat Med 21(18): 2703-2721.
-
Kim EK, Seok JH, Oh JS, Lee HW, Kim KH (2013) Use of Hangeul Twitter to track and predict human influenza infection. PLoS One 8(7): e69305.
-
Lee HC, Wackernagel H (2007) Extreme value analyses of US P&I mortality data under consideration of demographic effects. In: Center for Geosciences/ Geostatistics Publications & documentation Fontainebleau, France, pp: 1-25.
-
Thomas M, Rootzen H (2019) Real-time prediction of severe influenza epidemics using Extreme Value Statistics. ArXiv.
-
Lee HC, Wackernagel H (2007) Extreme values analyses of US P&I mortality data under consideration of demographic effects. Geoscience Center, Paris School of Mines, Fontainebleau, France, pp: 1-24.
-
Chu J (2021) A statistical analysis of the novel coronavirus (COVID-19) in Italy and Spain. PLoS One.
-
Maishman T, Schaap S, Silk DS, Nevitt SJ, Woods DC, et al. (2022) Statistical methods used to combine the effective reproduction number, R(t), and other related measures of COVID-19 in the UK. Stat Methods Med Res 31(9): 1757-1777.
-
Gareth, Maze SD, Benskin L (2021) Serious Statistical Flaws. Vitamin D concentrations and COVID-19 infection in Brazil Biobank Analysis.
-
Tom K, Paul C, Alina A, Nixon K, Mallen C, et al. (2021) Exploring the Impact of the First Wave of COVID-19 on Social Work Practice: A Qualitative Study in England, UK. The British Journal of Social Work 52(4): 2043-2062.
-
Mahase E (2022) Covid-19: Is the UK heading for another omicron wave? BMJ 376: 0738.
-
Rutter M, Lanyon PC, Grainge MJ, Hubbard R, Peach E, et al. (2022) COVID-19 infection, admission and death among people with rare autoimmune rheumatic disease in Brazil: results from the RECORDER project. Rheumatology 61(8): 3161-3171.
-
Gaidai O, Cao Y, Xing Y, Wang J (2023) Piezoelectric Energy Harvester Response Statistics. Micromachines 14(2): 1-9. Gaidai O, Cao Y, Xing Y, Wang J (2023) Piezoelectric Energy Harvester Response Statistics. Micromachines 14(2): 271.
-
Gaidai O, Cao Y, Loginov S, (2023) Global cardiovascular diseases death rate prediction. Current Problems in Cardiology 48(5): 101622.
-
Zheng L, Ismail K, Meng XH (2013) Freeway safety estimation using extreme value theory approaches: A comparative study. Accident Anal Prev 62: 32-41.
-
Gaidai O, Xing Y, (2022) A Novel Multi Regional Reliability Method for COVID-19 Death Forecast. Engineered Science 21: 799.
-
Gaidai O, Xing Y (2022) A novel bio-system reliability approach for multi-state COVID-19 epidemic forecast. Engineered Science 21: 797.
-
Gaidai O, Yan P, Xing Y (2023) Future world cancer death rate prediction. Scientific Reports 13: 1.
-
Gondauri D, Mikautadze E, Batiashvili (2020) M Research on COVID-19 Virus Spreading Statistics based on the Examples of the Cases from Different Countries. Electron J Gen Med 17(4): em209.
-
Zhu N, Zhang D, Wang W, Xingwang Li, Bo Yang, et al. (2020) A Novel Coronavirus from Patients with Pneumonia in China. N Engl J Med 382(8): 727-733.
-
Wu JT, Leung K, Leung GM (2020) Nowcasting and forecasting the potential domestic and international spread of the 2019-nCoV outbreak originating in Wuhan, China: a modelling study. Lancet 395(10225): 689-697.
-
He F, Deng Y, Li W (2020) Coronavirus Disease 2019 (COVID-19): What we know? J Med Virol 92(7): 719-725.
-
Wu Z, McGoogan JM (2020) Characteristics of and Important Lessons from the Coronavirus Disease 2019 (COVID-19) Outbreak in China: Summary of a Report of 72 314 Cases from the Chinese Center for Disease Control and Prevention. JAMA 323(13): 1239-1242.
-
Lu R, Zhao X, Li J, Niu P, Yang B, et al. (2020) Genomic characterisation and epidemiology of 2019 novel coronavirus: implications for virus origins and receptor binding. Lancet 395(10224): 565-5674.
-
Zhou P, Yang XL, Wang XG, Hu B, Zhang L, et al. (2020) A pneumonia outbreak associated with a new coronavirus of probable bat origin. Nature 579(7798): 270-273.
-
Zhu N, Zhang D, Wang W, Yang B, Song J, et al. (2020) A Novel Coronavirus from Patients with Pneumonia in China 2019. N Engl J Med. 382(8): 727-733.
-
WHO (2020) Coronavirus disease 2019 (COVID-19) Situation Report-70.
-
Wood PHN (1978) The Mathematical Theory of Infectious Diseases and its applications. Immunology 34(5): 955-956.
-
Bailey NTJ (1953) The total size of a general stochastic epidemic. Biometrika 40(1-2): 177-185.
-
Becker NG, Britton T (1999) Statistical studies of infectious disease incidence. J R Statist Soc B 6(2): 287- 307.
-
Lan L, Xu D, Ye G, Xia C, Wang S, et al. (2020) Positive RT- PCR Test Results in Patients Recovered from COVID-19. JAMA 323(15): 1502-1503.
-
Kermack WO, McKendrick AG (1927) A Contribution to the Mathematical Theory of Epidemics. Proceedings of the Royal Society of London 115(772): 700-721.
-
Bailey NTJ (1954) Maximum-likelihood estimation of the relative removal rate from the distribution of the total size of an intra household epidemic. J Hyg (Lond) 52(3): 400-402.
-
McNeil AJ, Frey R, Embrechts P (2015) Quantitative risk management: Concepts, techniques and tools. Princeton University Press, USA.
-
Patie P (200) Estimation of value at risk using extreme value theory. In: Talks in financial and insurance mathematics LaBrazilnne: Eidgenossische Technische Hochschule Zürich 1855 -. [about 1 screen.
-
Sumi A, Kamo KI (2012) MEM spectral analysis for predicting influenza epidemics in Japan. Envir Health Prev Med 17(2): 98-108.
-
Songchitruksa P, Tarko AP (2006) The extreme value theory approach to safety estimation. Accident Anal Prev 38(4): 811-822.
-
Gaidai O, Yan P, Xing Y (2023) Future world cancer death rate prediction. Scientific Reports 13(1).
-
Gaidai O, Xu J, Hu Q, Xing Y, Zhang F (2022) Offshore tethered platform springing response statistics. Scientific Reports 12: 21182.
-
Gaidai O, Xing Y, Xu X (2023) Novel methods for coupled prediction of extreme wind speeds and wave heights. Scientific Reports 13: 1119.
-
Gaidai O, Xing Y, Xu X (2022) COVID-19 epidemic forecast in USA East coast by novel reliability approach. Research square.
-
Xu X, Xing Y, Gaidai O, Wang K, Patel K, et al. (2022) A novel multi-dimensional reliability approach for floating wind turbines under power production conditions. Frontiers in Marine Science 9: 1-14.
-
Gaidai O, Xing Y, Balakrishna R (2022) Improving extreme response prediction of a subsea shuttle tanker hovering in ocean current using an alternative highly correlated response signal. Results in Engineering 15: 100593.
-
Cheng Y, Gaidai O, Yurchenko D, Xu X, Gao S (2022) Study on the Dynamics of a Payload Influence in the Polar Ship. The 32nd International Ocean and Polar Engineering Conference, Paper Number: ISOPE-I-22-342.
-
Gaidai O, Wang K, Wang F, Xing Y, Yan P (2023) Cargo ship aft panel stresses prediction by deconvolution. Marine Structures 88: 103359.
-
Gaidai O, Xu J, Xing Y, Hu Q, Storhaug G, et al. (2022) Cargo vessel coupled deck panel stresses reliability study. Ocean Engineering 268: 113318.
-
Gaidai O, Fu S, Xing Y (2022) Novel reliability method for multidimensional nonlinear dynamic systems. Marine Structures 86: 103278.
-
Gaidai O, Yan P, Xing Y (2022) A novel method for prediction of extreme wind speeds across parts of Southern Norway. Front Environ Sci pp: 1-8.
-
Balakrishna R, Gaidai O, Wang F, Xing Y, Wang S (2022) A novel design approach for estimation of extreme load responses of a 10-MW floating semi-submersible type wind turbine. Ocean Engineering 261: 112007.
-
Yayık A, Kutlu Y, Altan G (2019) Regularized Hess ELM and Inclined Entropy Measurement for Congestive Heart Failure Prediction. Cornell University.
-
Jamshidi M, Roshani S, Talla j, Lalbakhsh A, Peroutka Z, et al. (2022) A Review of the Potential of Artificial Intelligence Approaches to Forecasting COVID-19 Spreading. AI 3(2): 493-511.
-
Jamshidi M, Roshani S, Daneshfar F, Lalbakhsh A, Roshani S, et al. (2022) Hybrid deep learning techniques for predicting complex phenomena: A review on COVID-19. AI 3(2): 416-433.
-
Gaidai O, Cao Y, Loginov S (2023) Global cardiovascular diseases death rate prediction. Current Problems in Cardiology 48(5): 101622.
-
Gaidai O, Cao Y, Xing Y, Balakrishna R (2023) Extreme springing response statistics of a tethered platform by deconvolution. International Journal of Naval Architecture and Ocean Engineering 15: 100515.
-
Gaidai O, Xing Y, Balakrishna R, Xu J (2023) Improving extreme offshore wind speed prediction by using deconvolution. Heliyon 9(2): e13533.
-
Gaidai O, Xing Y, Balakrishna R, Sun J, Bai X (2023) Prediction of death rates for cardiovascular diseases and cancers. Cancer Innovation 3(2): 140-147.
-
Gaidai O, Wang F, Yakimov V, (2023) COVID-19 multi- state epidemic forecast in India. Proceedings of the Indian National Science Academy 89: 154-161.
-
Gaidai O, Xu J, Yan P, Xing Y, Wang K, et al. (2023) Novel methods for reliability study of multi-dimensional non- linear dynamic systems. scientific reports13: 3817.
-
Xing Y, Gaidai O (2023) Multi-regional COVID-19 epidemic forecast in Sweden. Digital Health 9.
-
Gaidai O, Xu X, Xing Y (2023) Novel deconvolution method for extreme FPSO vessel hawser tensions during offloading operations. Results in Engineering 17: 100828.
-
Gaidai O, Cao Y, Xu X, Xing Y (2023) Offloading operation bivariate extreme response statistics for FPSO vessel. Scientific Reports 13(1): 4695.
-
Zhang J, Gaidai O, Ji H, Xing Y, (2023) Operational reliability study of ice loads acting on oil tanker bow. Heliyon 9(4): e15189.
-
Gaidai O, Xing Y (2023) COVID-19 Epidemic Forecast in Brazil. Bioinform Biol Insights 17.
-
Gaidai O, Wang F, Xing Y, Balakrishna R (2023) Novel Reliability Method Validation for Floating Wind Turbines. Advanced Energy and Sustainability Research pp: 1-7.
- Epidemiological Surveillance and Rumors on Social Media
- Awareness and Treatment of Uncontrolled Hypertension in US Overweight/Obese Youths Aged 16–24 Years, NHANES 2021–2023
- Strengthening EPI Through Parental Engagement: Lessons from Dhaka Slums for IA-2030
- Mothers Knowledge of the Prevalence, Causes, Effects, Prevention and Control of Diarrhoea among Children in Ife East Local Government Area, Ile Ife, Osun State, Nigeria
- Covid-19 Reinfections Case Series from October 2023 to October 2024 in A General Medicine Office in Toledo (Spain)
- Water Contact! One Risk Too Many: Risk Factors Associated with Schistosoma haematobium infection in Osun State, Nigeria