Evidence of Spatial Clustering Distribution Patterns of Malaria in Epe, Lagos, Nigeria
Investigation of the spatial distribution patterns of malaria with the goal of detecting intense transmission areas and clustering is prerequisite to planning an effective targeted malaria intervention. Parasitological sampling was done in settlements in Epe and Orimedu, Lagos, Nigeria. Blood samples were collected from 360 participants with georeferenced residences, selected through multistage systematic sampling technique. Each study area was delineated into 3 Malaria Risk Zones (MRZs), namely; Very High (V-MRZ), High (H-MRZ) and low (L-MRZ), according to distances of 500m, 1000m and 1500m respectively away from perennial water bodies. Clustering and Outlier analysis was carried out to generate predictive malaria risk maps. Overall malaria prevalence was 32.2%., being significantly higher in Orimedu (52.6%) than Epe (47.4%), p<005. Prevalence was 28%, 32% and 50% in the VH-MRZ, High-MRZ and L-MRZ respectively in Epe. H-MRZ accounted for the highest prevalence (67%), in Orimedu, followed by the V-MRZ (39%) while the L-MRZ was uninhabited. Malaria clustering was detected in Uraka, Iberikodo and Sagidan settlements in Epe (Moran’s Index = 062, p<005) but not in Orimedu. The multiple distinct malaria risk zones coupled with the characteristic steep topographic may be responsible for forcing malaria to localize and cluster in Epe compared to Orimedu.
Abbreviations
MRZs: Malaria Risk Zones; PHCs: Primary Healthcare Centres; GCS: Geographic Coordinate System; GIS: Geographic Information System; LGAs: Local Government Areas.
Introduction
The geographic boundary of malaria transmission is subject to the spatial distribution of the vector, Anopheles mosquitoes, which in turn is a function of the availability of mosquito breeding ground [1]. The risk of having malaria therefore tends to be highest in human dwellings that are in close proximity to potential Anopheles larval breeding grounds [2, 3]. This has resulted in geographic variations in the transmission of malaria, even in the context of a small geographic entity such as a village [4], with the occurrence of clusterings and hotspots areas, characterised with disproportionately high and intense transmission. Malaria clustering tends to increase transmission intensity in a previously less intense malaria transmission zone [5].
The distribution of malaria interventions to populations that are residence in the malaria hotspot zones has been reported to reduce malaria not only within the target zone but also to neighbouring areas [4]. However, an effective targeted allocation of malaria interventions within a geographic area will require a prior investigation of the distribution pattern of malaria with the goal of identifying malaria clustering or hotspot zones within that area [6]. The recent attention received by Geographic Information System (GIS) based malaria mapping studies have improved the understanding of the spatial patterns of the distribution of malaria, which can then be adopted in the design and implementation of malaria control programmes [7].
Global, continental and national malaria risk maps [8, 9, 10] have successfully promoted the understanding of the spatial distribution patterns of malaria at the global, continental and national scale respectively [9, 11, 12]. However, these maps were based on average estimates, resulting in the generation of homogenous data of the distribution pattern of malaria at the world [13], continent [14] and national [9] scales when in actual fact, geographic variability exists, even when considered within small spatial entity such as a village [15] or settlement [7].
The application of malaria mapping using spatial scanning technique has been used to generate malaria risk maps showing hotspots transmission zones on a sub-national scale. The technique identified individual households and/or homesteads that are residence in intense malaria transmission areas (hotspot zones) in Kenya [7]. The reported malaria mapping studies at the national scale in Nigeria are still very limited [16, 17], while mapping at sub- national level was reported only in few states including Osun, Ondo, Rivers, Cross river and more recently Lagos [18, 19, 20, 21, 22, 23, 24].
Omogunloye, et al. [24] employed GIS technology to analyse reported health facilities-based reported malaria cases, and subsequently generated malaria risk map of Lagos State showing the endemicity level of malaria in all the Local Government Areas (LGAs) within the state. A significant association between malaria cases and environmental features, and spatial malaria clustering were reported, followed by the development of a predictive model of malaria distribution. However, parasitological studies on participants with georeferenced household to ascertain the accurate spatial distribution pattern of the disease at micro- spatial scale such as settlements and wards within each LGA was not investigated.
This study therefore investigated the local spatial distribution patterns of malaria for the presence of clustering in 2 LGAs in Lagos, Nigeria.
Materials and Methods
General Description of the Study Area
The study was conducted in a total of 9 wards in Ibeju Lekki and Epe Local Government Areas of Lagos State. Three wards, namely; Orimedu, Iberikodo and Debojo, which constitute Orimedu constituency in Ibeju-Lekki LGA, and six wards, namely; Bado, Ayetoro, Sagidan, Oke Balogun, Ajagannabe and Papa all of which constitute Epe town in Epe LGA.
Ibeju Lekki is a rural coastal area that lies between longitudes 3035Ꞌ and 3055ꞋN and latitudes 6025Ꞌ and 6045ꞋE in the creek zone of tropical southwestern Nigeria. Epe is a riverine area located in the tropical sub-humid region with coordinates 60351N and 30591E.
Ibeju Lekki has a somewhat flat topography, with elevation ranging between 1.6m and 12.3m and slopes gently toward the Atlantic Ocean in the South and the lagoon in the north [25, 26]. Epe on the other hand has a sloppy topography with a relatively high altitude which ranged from 4.5m to 45.3m [27].
Research Design and Sampling Procedures
The study was a descriptive cross-sectional survey involving parasitological and environmental studies, and GIS technology. A total of 360 household representative were systematically selected from 24 settlements in Epe and Orimedu. The 9 selected wards were initially stratified into varying number of settlements. Each of the selected wards in Epe was stratified into 2 settlements while 4 settlements were drawn out of each of the 3 selected wards in Orimedu. Each of the selected settlements was then further stratified into 15 streets totalling 360 streets from where one house was randomly picked using lottery method. The lottery method was further used to select one household from the selected houses, and a representative from each household was enrolled into the study for oral interview, questionnaire administration, and blood sample collection. The sampling of participants was carried out in the Primary Healthcare Centre (PHC) in each of the selected wards. The procedure for selection of streets, houses, households and household representative has been fully described elsewhere [28].
Pretested and structured questionnaires were administered to consented participants. Blood samples were collected, immediately transferred into labelled heparinised bottles, and subsequently stored in the refrigerator for further analysis. Malaria microscopy involved preparation of thin and thick blood films using standard procedures [29]. Thin film was examined under the microscope at x100 objective to check for the presence of malaria parasite species. A different and experienced laboratory technician also examined the slides for quality assurance purpose [29].
Incorporation of Data into Arcgis Environment and Generation of Malaria Risk Map
The coordinates of participants’ houses were taken in Geographic Coordinate System (GCS) as longitude- latitude using Minna datum. Topographical maps of the two study areas, obtained from Google Earth (IBCAO, Data SIO, NOAA, US, Google Landsat/ Copernicus), were imported into the ArcGIS 10.4.1 environment for georeferencing and digitisation, after which they were saved in shape-file formats for image analysis. Environmental features on the ground such as permanent water bodies, wetlands, built up or human settlement and vegetation were located and identified by conducting a Land Use Land Cover (LULC) image analysis in the ArcGIS environment, using suitable band scenes for the study area, obtained from the United State Geological Survey website on wwwearthexplorerusgsgov. Thereafter, relevant layers (neighbourhood) were then digitized and their various attribute tables created. The positional and attribute data of neighbourhoods were then structured in ArcGIS and overlaid on the previously created shape files.
GIS spatial analytical functions, namely; Overlaying, Buffer, Moran’s Index Spatial Autocorrelation, Cluster and Outlier and Krigging Interpolation analyses were then carried and the predictive risk maps of malaria of Epe and Orimedu
were then generated. To generate the risk map, varying distances to main freshwater bodies were measured on the topographic map in the GIS environment using Euclidean distance tool [30]. These data together with participants’ coordinates and malaria prevalence data were then used to generate the predictive risk map of malaria of the study areas. The detail description of the delineation process in Epe and Orimedu into very high, high and low malaria risk zones have been described elsewhere [26].
Results
Prevalence of Malaria
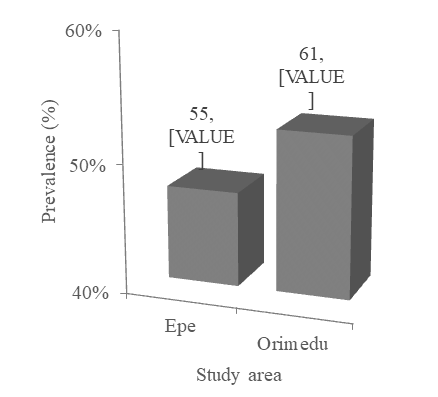
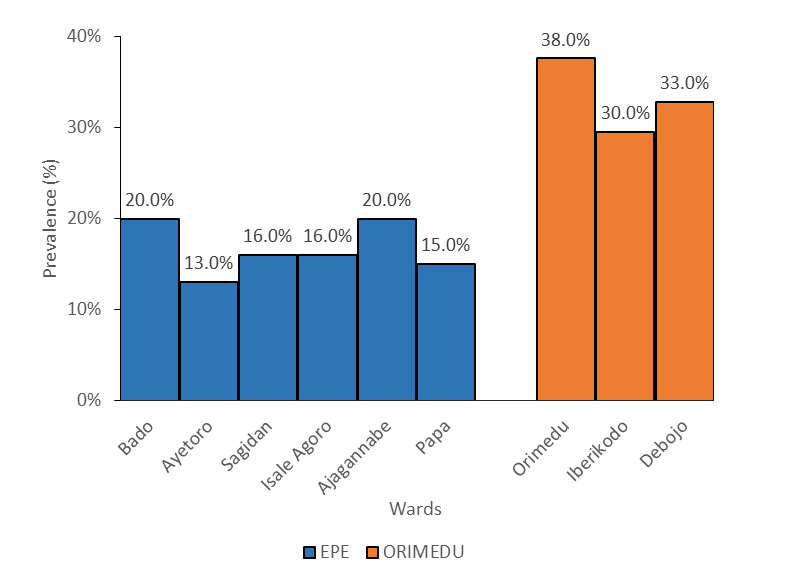
Overall prevalence of malaria was 32.2% (116/360). Prevalence is significantly higher in Orimedu (52.6%), compared with Epe (47.4%), p<0.05 (Figure 1). In Epe, Bado and Ajagannabe wards accounted for the highest prevalence (20.0%) while Ayetoro ranked lowest (13.0%) (Figure 2). Prevalence of 16.0% was recorded in Sagidan and Isale Agoro while Papa had a prevalence of 15.0%. The decreasing order of prevalence ranking in Orimedu wards include; Orimedu (38%), Debojo (33%) and Iberikodo (30%). There was statistically significant variation in malaria prevalence amongst the wards in Epe and Orimedu, p<0.05.
At the settlement level in Epe, Uraka and Oke Balogun recorded the highest prevalence (13.0%) while prevalence was lowest (4.0%) in Isale Agoro (Figure 3a). None of the 2 settlements in Bado ward (which recorded the highest prevalence at the ward-level), ranked first in terms of prevalence ranking at the settlement level. While Bado settlement ranked second (11%), Iberikodo ranked third (9%). In Orimedu, Debojo settlement in Debojo ward had the highest prevalence (13.1%) followed by Orimedu East, Orimedu West and Iberiko, each of which recorded a prevalence of 11.5% (Figure 3b). Four of the other 8 settlements, namely; Alade, Museyo, Eleko and Idado recorded the lowest prevalence (4.9%). Varying prevalence was observed in the remaining 4 settlements ranging from 6.6% in Orofun to 9.8% in Badore. The observed variation in prevalence at the settlement level was statistically significant, p<0.05.
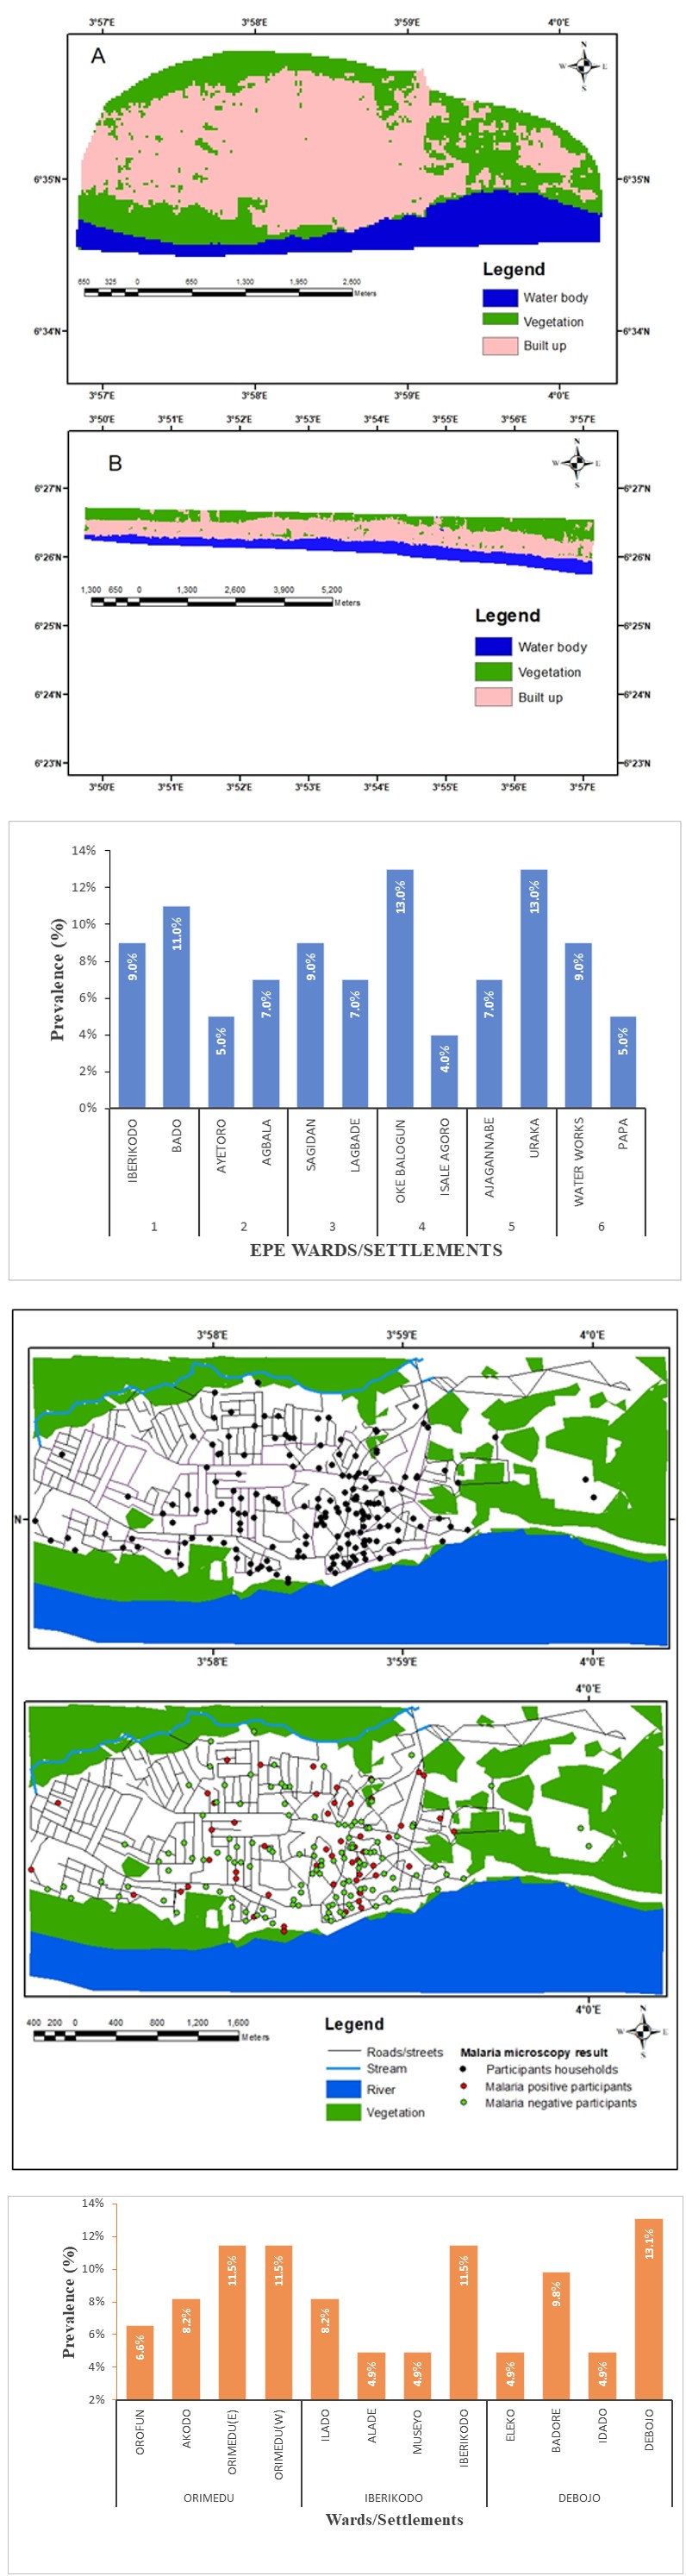
Figure 3a: Malaria Prevalence at the Settlement-Level in Epe.
Figure 3b: Malaria Prevalence at the Settlement-Level in Orimedu.
Land Use/ Land Cover Image Analysis of the Study Area
The outcome of the LULC image analysis in Epe and Orimedu showed that both areas share common land cover classes, namely; built up or urban, vegetation and water bodies/wetlands (Figure 4). However, Orimedu in addition to having fresh water pools, lakes, wetlands and streams also has Ocean (salt water). (Figures 5a, 5b, 6a & 6b).
Figure 5a: Digitized map of Epe showing the household location of participants and their malaria microscopy result outcome.
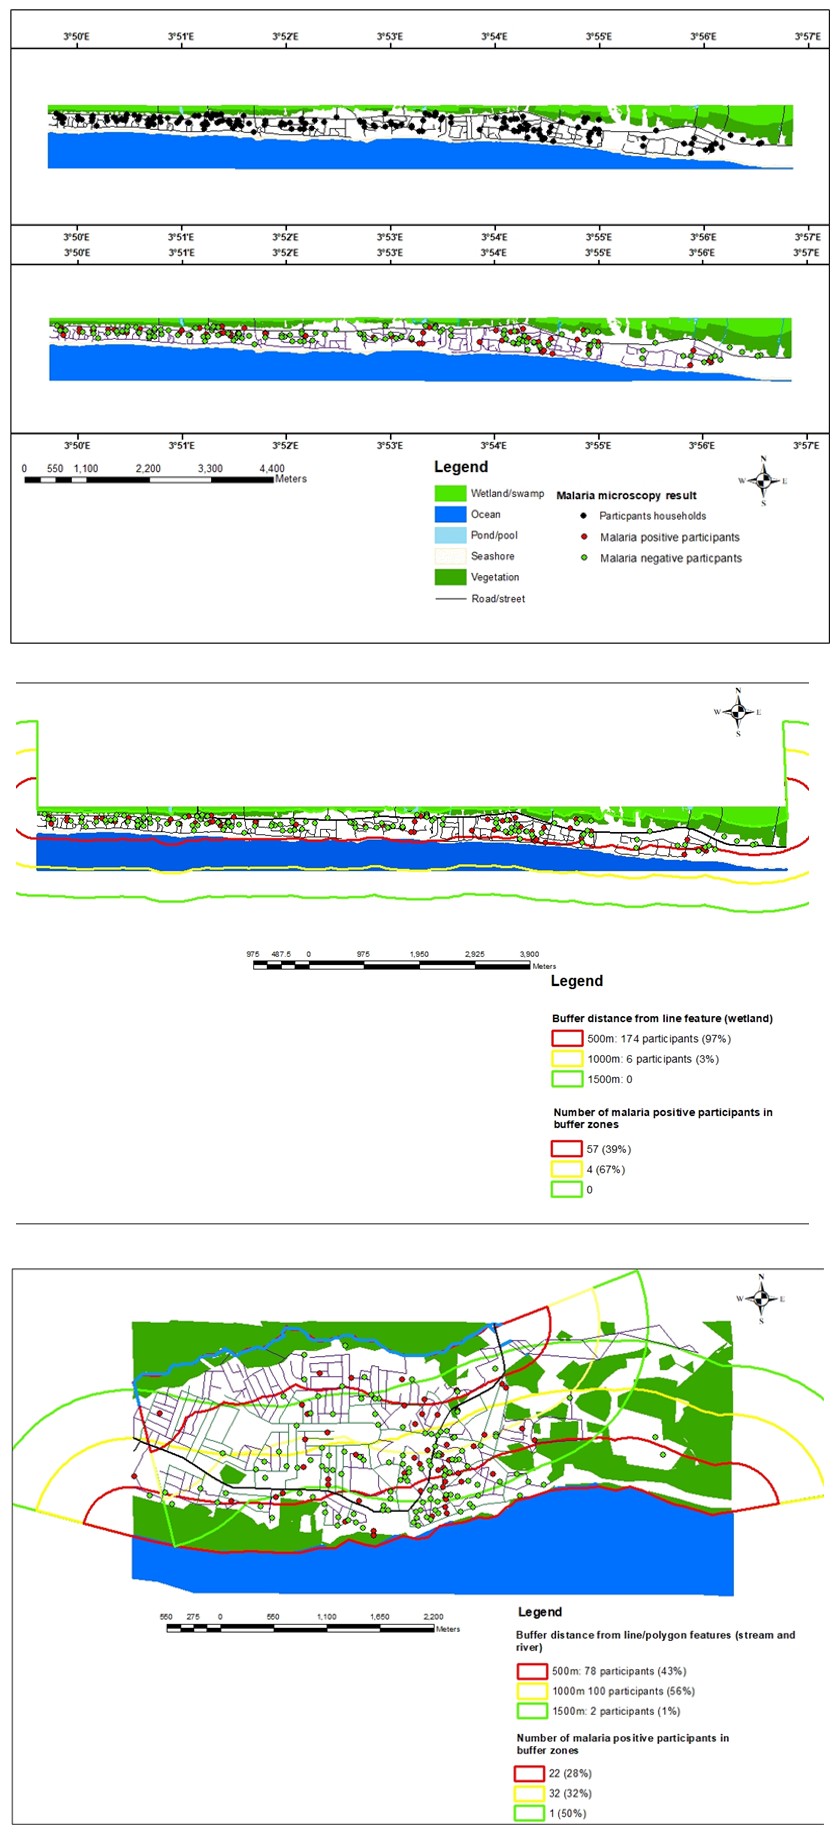
Figure 5b: Digitized map of Orimedu showing the household location of participants and the outcome of the conducted malaria microscopy result.
Figure 6a: Digitized map of Epe showing location of participants within and outside varying buffer distances.
Figure 6b: Digitized map of Orimedu showing location of participants within and outside varying buffer distances.
Buffer Analysis and Generation of Malaria Risk Zones on the Digitized Study Area Map
The geographic locations of all the participants is shown on the digitized map of Epe (Figure 4) and Orimedu (Figure 4) represented with black point features. The red point features indicate the location of malaria positive participants while the green point features indicate malaria negative participants. According to the digitized map, Orimedu constituency tends to be narrow in terms of the area of the landmass compared with Epe.
The outcome of the buffer/proximity analysis generated 3 malaria risk zones in both Epe and Orimedu, namely; very high (red), high (yellow), and low (green) malaria risk zones, based on distances of 500m, 1000m and 1500m away from the identified perennial freshwater bodies. The outcome of overlay of the generated buffer zones on the digitized map of Epe and Orimedu are shown in Figure 4 respectively. In Epe, seventy-eight participants (43.3%) inhabited the red malaria risk zone while the yellow malaria risk zone were inhabited by one hundred participants (56%). Only two participants (1%) were found in the green malaria risk zone. Prevalence of malaria was 28%, 32% and 50% in the red, yellow and green malaria risk zones respectively.
A relatively high proportion of the participants in Orimedu 174 (97%) inhabited the red malaria risk zone while the remaining six participants (3%) inhabited the yellow malaria risk zone. No human settlement (0%) was found in the green malaria risk zone, as the zone is occupied by the Atlantic Ocean. Malaria prevalence was 39% in the red malaria risk zone and 67% in the yellow malaria risk zone (67%).
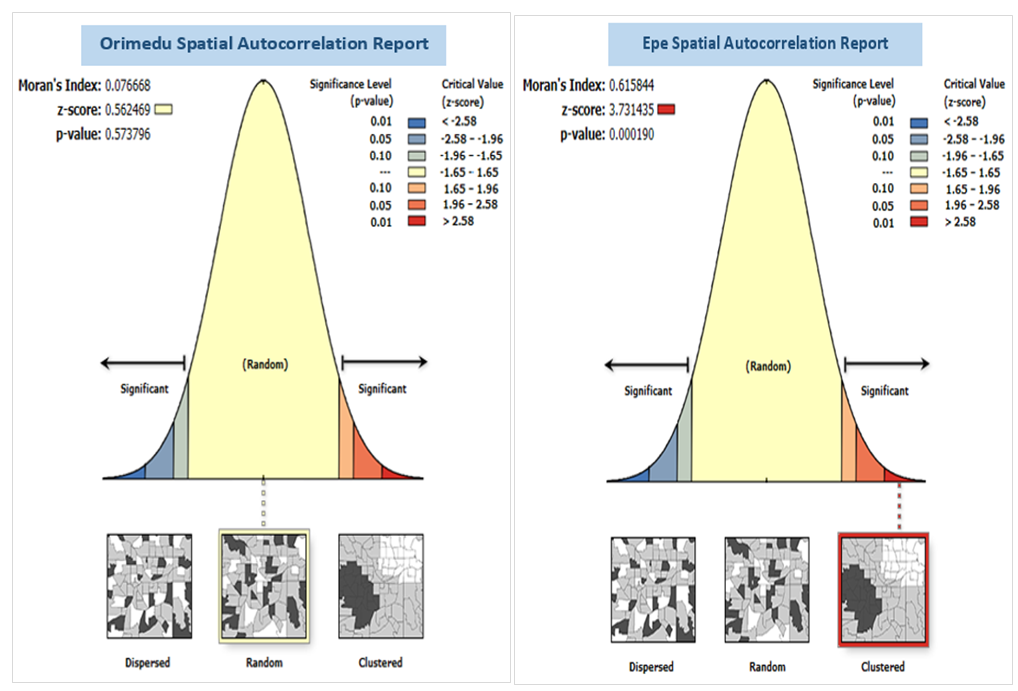
Spatial Autocorrelation Analysis Of Malaria Prevalence
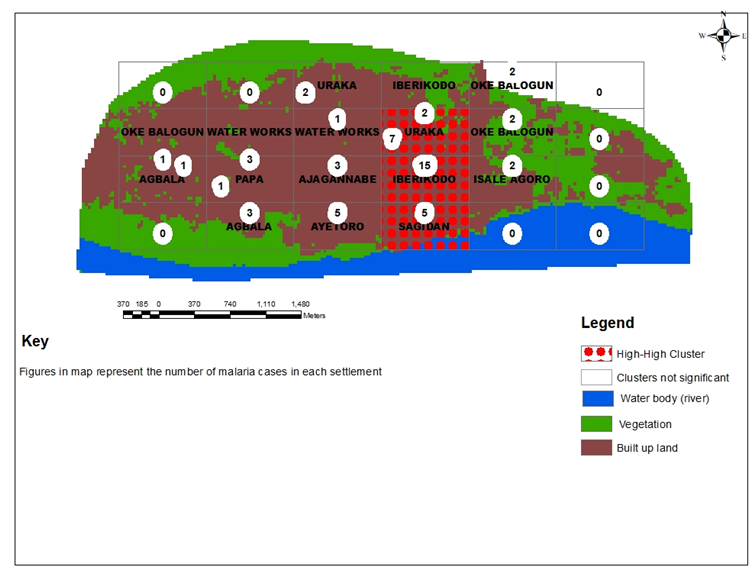
The observed distribution pattern of malaria does not appear to be significantly different from random in Orimedu constituency, Moran’s I = 0.08, P>0.05 (Figure 4). Conversely, a clustered pattern of malaria distribution was observed in 3 settlements in Epe, Moran’s I = 0.62, P<0.05. namely; Uraka, Iberikodo and Sagidan (Figure 4).
Discussion
The overall malaria prevalence reported in the study (32.2%) is highly comparable with 33.8% reported in Cameron [31]. Meanwhile, Bello AB, et al. [32] had previously reported a relatively higher prevalence (36.1%) in Epe town. The observed decline in malaria prevalence in Epe compared with the prevalence reported earlier may be due to the impact of interventions that had been implemented since the past years [33]. There have been several reports of variability in the spatial distribution pattern of malaria [19, 21, 24], in which findings from this study also conformed with. Spatial heterogeneity of malaria was reported to be attributed to the presence of water bodies [21]. However, other environmental risk factors such as altitude cannot be overruled [34]. The land cover classes identified in Epe and Orimedu are characteristic of a swampy lowland tropical rainforest zone, which consists of freshwater swamp along riverbanks and estuary along the lagoon coast in which Lagos state is geographically located [27]. The high proportion of participants (97%) inhabiting the red zone in Orimedu is due to the entire surface area of the human settlement in which the red buffer margin covered. The rectangular nature and area of Orimedu landmass is such that the red zone alone covered almost all the entire human settlements leaving only the sea shore and Atlantic Ocean in which the yellow and green zones extended to. This implies that almost all the entire population of Orimedu are at high and almost equal risks of having malaria. Epe on the other hand had its human settlements covered by not only the red malaria risk zone, but also the yellow and green zones. (Figure 7).
The relatively high prevalence of malaria observed in the yellow zone (67%, 32%) compared with the red zone (39%, 28%) in Orimedu and Epe respectively, may imply that factors other than proximity to water bodies also influence the risk of having malaria [34, 35, 36]. However, the prevalence of 50% observed in the green zone in Epe may not be a true estimated of prevalence, owing the minute participants that were sampled in the zone. The absence of malaria clustering in Orimedu may be due to earlier reported fairly homogenous malaria risk in the area. The outcome of the Global Moran’s Index spatial autocorrelation in Epe in which malaria clustering was observed in some settlements might have been influenced by the heterogeneous nature and distinct buffer zones, forcing malaria to localize and subsequently cluster.
Conclusion and Recommendations
The significantly higher prevalence of malaria reported in Orimedu, compared to Epe, may be attributed to the coverage level of the very high malaria zones, which demonstrates that the entire population are at high and fairly equal risk of malaria. The observed clustering of malaria in Epe may be explained by the distinct malaria risk zones and highly varied altitude characteristic of the area, compared to Orimedu.
There is need to intensify in the allocation of cost effective, timely and targeted malaria intervention in the study area especially to population most in need. While the high and almost entirely high-risk population in Orimedu demands an Integrated Vector Management approach, which should be allocated to all her population, intervention in Epe should target the high malaria risk zone inhabitants (Figure 8).
Declaration
Funding
No funds, grants, or other financial supports was received for the conduct of this research.
Conflict of Interest
There is no conflict of interest.
Availability of Data
All the data used for the research work are available and will be reproduced upon request.
Author’s Contributions
The conceivement, design and performance of the research, Bayesian Geostatistical analysis and the preparation and writing of the manuscript were done by Bello Abdulrahman Babatunde. Hassan Adesola Adebolade (Ph.D) is responsible for the analysis of the research data, supervision of the research work and proofreading and correction of the manuscript and contribution of relevant methods and ideas.
Ethics Approval
Ethical approval to undertake the study was obtained from the Lagos State University Health Research and Ethics Committee (NHREC04/04/2008), with approval number; LREC/06/10/1315 The study was performed in accordance with the ethical standards as laid down in the 1964 Declaration of Helsinki.
Consent to Participate
Informed consents were obtained from the participants prior to enrolment into the study. Data obtained from participants were coded for confidentiality and they all consented to publication of the research findings.
Acknowledgement
Our profound gratitude goes to Dr Nurain Ayeola, the Medical Officer of Health, Epe Primary Healthcare Department, Lagos State for making the Primary Healthcare Centres (PHCs) available for sampling of participants and parasitological procedures. The Chief Matrons and Officers- in-charge, Epe and Orimedu flagship PHCs, Matrons Ganiyat A. Adams and Falilat F. Braimah respectively are very much grateful to for their patient, hospitality, support and for providing the volunteer health workers and medical recorders that assisted in the sampling of participants. We are highly indebted to Mr Afolabi Odunoyinbo, Mrs Mulikat Okuwa, Mrs Charity Ogugua, and Mrs Samiat Tijani of the Laboratory unit of Epe PHC for assisting in the preparation of blood films, and malaria microscopic studies.
References
-
Bousema T, Okell L, Shekalaghe S, Griffin J, Omar S, et al. (2010) Revisiting the circulation time of Plasmodium falciparum gametocytes: Molecular detection methods to estimate the duration of gametocyte carriage and the effect of gametocytocidal drugs Malaria Journal 9: 136.
-
Trape JF, Lefebvre ZE, Legros F, Ndiaye G, Bouganali HDP, et al. (1992) Vector density gradients and the epidemiology of urban malaria in Dakar, Senegal American Journal of Tropical Medicine and Hygiene 47(2): 181-189.
-
Midega JT, Smith DL, Olotu A, Mwangangi JM, Nzovu, JG, et al. (2012) Wind direction and proximity to larval sites determines malaria risk in Kilifi District in Kenya. Nature Communications 3(8): 674.
-
Bejon P, Williams TN, Nyundo C, Hay SI, Benz D, et al. (2014) A micro-epidemiological analysis of febrile malaria in Coastal Kenya showing hotspots within hotspots. eLife 3: e02130.
-
Bousema T, Stresman G, Baidjoe AY, Bradley J, Knight P, et al. (2016) The impact of hotspot-targeted interventions on malaria transmission in Rachuonyo South District in the Western Kenyan Highlands: A cluster-randomized controlled trial. PLoS Med 13: e1001993.
-
Woolhouse ME, Dye C, Etard JF, Smith T, Charlwood JD, et al. (1997) Heterogeneities in the transmission of infectious agents: implications for the design of control programs. Proc Natl Acad Sci 94: 338-342.
-
Bejon P, Williams TN, Liljander A, Noor AM, Wambua J, et al. (2010) Stable and unstable malaria hotspots in longitudinal cohort studies in Kenya. PLoS Medicine 7(7): e1000304.
-
Hay SI, Guerra CA, Gething PW, Patil AP, Tatem AJ, et al. (2009) A world malaria map: Plasmodium falciparum endemicity in 2007. PLoS Medicine 6(3): e1000048.
-
Dalrymple U, Mappin B, Gething PW (2015) Malaria mapping: understanding the global endemicity of falciparum and vivax malaria. BMC Medicine 13: 140pp.
-
Gebreslasie MT (2015) A review of spatial technologies with applications for malaria transmission modelling and control in Africa. Geospatial Health 10(2): 328.
-
Noor AM, Mardi KA, Abdelgader TM, Patil AP, Amine A, et al. (2012) Malaria risk mapping for control in the republic of Sudan. American Journal of Tropical Medicine and Hygiene 87(6): 1012-1021.
-
Bennett A, Kazembe L, Mathanga DP, Kinyoki D, Ali D, et al. (2013) Mapping malaria transmission intensity in Malawi, 2000-2010. American Journal of Tropical Medicine and Hygiene 89(5): 840-849.
-
Lysenko AJ, Semashko IN (1968) Geography of malaria: A medicogeographic profile of an ancient disease. In: Lebedew AW (Ed.), Itogi Nauki: Medicinskaja Geografija. Moscow, USSR: Academy of Sciences 25-146.
-
Le SD, Binka F, Lengeler C, De SD, Snow RW, et al. (1997) An atlas of malaria in Africa. Africa Health 19: 23-24.
-
Yeshiwondim AK, Gopal S, Hailemariam AT, Dengela DO, Patel H (2009) Spatial analysis of malaria incidence at the village level in areas with unstable transmission in Ethiopia. International Journal of Health Geographics, pp: 5.
-
Onwuemele A (2014) An assessment of the spatial pattern of malaria infection in Nigeria. International Journal of Medicine and Medical Sciences 6(2): 80-86.
-
Akpan GE, Adepoju KA, Oladosu OR, Adelabu SA (2018) Dominant malaria vector species in Nigeria: Modelling potential distribution of Anopheles gambiae sensu lato and its siblings with MaxEnt. PLoS ONE 13(10): e0204233.
-
Idowu AP, Okoronkwo N, Adagunodo RE (2009) Spatial Predictive Model for Malaria in Nigeria. Journal of Health Informatics in Developing Countries 3(2): 30-36.
-
Oluwafemi OA, Babatimehin OI, Oluwadare TS, Mahmud UM (2013) Mapping malaria case event and factors of vulnerability to malaria in Ile-Ife, Southwestern Nigeria: using GIS. Ethiopian Journal of Environmental Studies and Management 6(4): 365-375.
-
Omonijo AG, Matzarakis A, Oguntoke O, Adeofun CO (2011) Influence of weather and climate on malaria occurrence based on human-biometeorological methods in Ondo State, Nigeria. Journal of Environmental Science and Engineering 5(9): 1215-1228.
-
Efe SI, Ojoh CO (2013) Spatial distribution of malaria in Warri metropolis. Open Journal of Epidemiology 3(3): 118-124.
-
Weli V, Efe SI (2015) Climate and Epidemiology of Malaria in Port Harcourt Region, Nigeria. American Journal of Climate Change 4(1): 40-47.
-
Ibor UW, Okoronkwo EM, Rotimi EM (2016) Temporal analysis of malaria prevalence in Cross River State, Nigeria. Journal of Medical Research 5(1): 001-007.
-
Omogunloye OG, Abiodun OE, Olunlade OE, Epuh EE, Asikolo I, et al. (2018) Modeling malaria prevalence rate in Lagos state using multivariate environmental variations. Geoinformatics FCE CTU 17(1): 61-86.
-
Owolabi AD (2010) Integrated coastal zone management database for sustainable coastal tourism in Ibeju Lekki. Dissertation, University of Lagos, Nigeria.
-
Bello BA (2024) Spatio-temporal heterogeneity of malaria and associated socio-demographic and environmental risk variables in Epe and Orimedu, Southwestern Nigeria. Plos One 18(7): e0287723.
-
Hassan B (2012) A study of inland waterways transport in Epe area of Lagos. Dissertation, Adekunle Ajasin University, Akoko, Ondo State, Nigeria.
-
WHO (2010) Basic malaria microscopy, Part I Learner’s guide Geneva, Switzerland.
-
WHO (2009) Malaria microscopy quality assurance manual World Health Organisation, regional office for the western pacific.
-
Oesterholt M, Bousema JT, Mwerinde OK, Harris C, Lushino P, et al. (2006) Spatial and temporal variation in malaria transmission in a low endemicity area in northern Tanzania. Malaria Journal 5: 98.
-
Sumbele IU, Sama SO, Kimbi HK, Taiwe GS (2016) Malaria, moderate to severe anaemia, and malarial anaemia in children at presentation to hospital in the Mount Cameroon area: A cross-sectional study.
-
Bello AB, Hassan AA (2016) Malaria prevalence: Influence of communal knowledge and practices post IRS Intervention in Epe, Southwest, Nigeria. Sierra Leone Journal of Biomedical Research 8: 2.
-
Bhatt S, Weiss DJ, Cameron E, Bisanzio D, Mapping U, et al. (2015) The effect of malaria control on Plasmodium falciparum in Africa between 2000 and 2005. Nature 526(7572): 207-2011.
-
Bello AB, Hassan AA (2022) Risk Status of Malaria Based on Sociodemographic, Behavioural and Environmental Risk Factors in Two Communities in Lagos, Nigeria. Journal of Environmental and Occupational Health 12(3): 164-168.
-
Drakeley C, Abdulla S, Agnandji ST, Fernandes JF, Kremsner P, et al. (2017) Longitudinal estimation of Plasmodium falciparum prevalence in relation to malaria prevention measures in six sub-Saharan African countries. Malaria Journal 16: 433.
-
Ramdazan AR, Ismail A, Mohd Zanib ZS (2019) Prevalence of malaria and its risk factors in Sabah, Malaysia. International Journal of Infectious Diseases 91: 68-72.
- Epidemiological Surveillance and Rumors on Social Media
- Awareness and Treatment of Uncontrolled Hypertension in US Overweight/Obese Youths Aged 16–24 Years, NHANES 2021–2023
- Strengthening EPI Through Parental Engagement: Lessons from Dhaka Slums for IA-2030
- Mothers Knowledge of the Prevalence, Causes, Effects, Prevention and Control of Diarrhoea among Children in Ife East Local Government Area, Ile Ife, Osun State, Nigeria
- Covid-19 Reinfections Case Series from October 2023 to October 2024 in A General Medicine Office in Toledo (Spain)
- Water Contact! One Risk Too Many: Risk Factors Associated with Schistosoma haematobium infection in Osun State, Nigeria