Effects of Elbow Flexion on the Hand-Grip Strength
The objective of this study was to explore the effects of elbow flexion on the hand-grip strength. The data were collected by trained, senior and graduate students as a required mini-project in an ergonomics course. A sample of 125 female and 222 male adults, ages 18 to 47 (22.5±3.35), body heights of 173.0±10.47cm and body weights of 73.6±16.48 kg, mostly from college student population, were tested using standardized data collection form, positioning and instructions. In this study, the grip strengths of 347 subjects were measured and recorded over a multiple number of years. Pair-wise comparisons using the Student’s T-Test showed that the hand-grip strength at the elbow in the fully extended position was significantly higher than when the elbow flexed. The test also showed significantly higher grip strength in 90° flexed position than in 30°, 60° or 120° flexion. No significant differences were found in the grip strength among the 30°, 60° or 120° elbow flexed positions. Comparison of the average hand-grip strength of dominant-hand and non-dominant hand of the subjects showed a significant difference. The female subjects found to have about 41% lower grip strength than the male counterparts.
Introduction
The hand is the most important work tool for the human. The grip is the action of grasping an object by hand and holding it firmly. The hand grip strength is the ability in forceful flexion of all finger joints with the maximum voluntary force that the subject is able to exert. Grip strength is used as an objective index of the functional integrity of the upper extremity [1]. Manjula, et al. [2] have performed a review of literature on grip strength. Some researchers have reported strong correlations between grip strength and various anthropometric factors, such as weight, height body surface area and hand length [3, 4, 5, 6]. Khan, Ansari, and Agrawal [7] reported declining hand-grip strength is associated with increase in the body mass index (BMI).
Sartorio, et al. [8] reported increase in the grip strength with age advancement in children, and boys showed greater hand-grip strength than the girls. Smrithi, et al. [9] reported positive correlation between hand-grip strength and weigh and BMI only in females and between hand- grip strength and weigh, height and BMI of males, but negative correlation between hand-grip strength and the weight in overweight male subjects. Mathiowetz, Rennells, and Donahoe [10] reported that grip-strength was higher with the elbow positioned in 90° of flexion as compared with when the elbow was positioned in full extension. Interestingly, the grip strength has been reported to be higher in dominant hand for the right- handed individuals, but no such significant differences could be detected for the left-handed subjects [11].
Objectives
participants (222 males and 125 females) of ages 22.6±3.5 years. The subjects were volunteer college students whom were recruited by senior and graduate students performing a mini-project, as a required laboratory activity in an ergonomics course. The data were compiled from the student mini-projects over a multiple number of years. A standardized data collection form was provided to each experimenter to record each subject’s physical characteristics (i.e., gender, age, weight, height, and handedness), and the hand grip strength data. The physical characteristics of the subjects are summarized in Table 1.
The primary objective of this study was to explore the effects of elbow flexion on the hand-grip strength. In addition, the study sought to investigate the correlation between HGS and the physical characteristics (i.e., gender, weight, height and handedness).
Methods
Subjects
The study is based on a sample of 347 normal, healthy
| Weight (kg) | Height (cm) | Age (years) | ||||||||||||||||||
|---|---|---|---|---|---|---|---|---|---|---|---|---|---|---|---|---|---|---|---|---|
| S | ample Siz | e | Right-Handed | Left-Handed | ||||||||||||||||
| Subjects | Mean±SD | Mean ± SD | Mean ± SD | |||||||||||||||||
| Female | 125 | 116 | 9 | 62.0±10.48 | 164.2±8.11 | 22.2±3.3 | ||||||||||||||
| Male | 222 | 197 | 25 | 80.2±15.63 | 178.0±8.16 | 22.8±3.43 | ||||||||||||||
| All | 347 | 313 | 34 | 73.6±16.48 | 173.0±10.47 | 22.5±3.35 |
Table 1: Physical Characteristics of the participants (subjects).
Equipment and Methodology
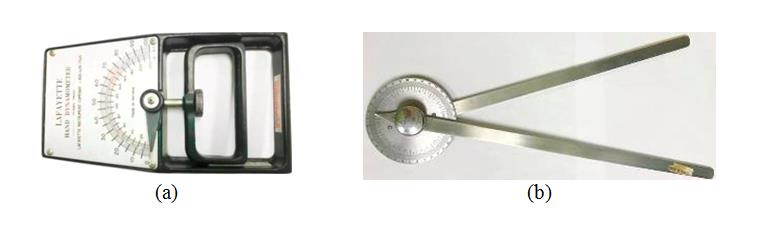
The students (observers) were trained in measuring the subject’s grip strength. They were provided a standardized data collection form for recording each subject’s physical characteristics and their observed experimental data. Each observer collected and recorded the right- and left-hand grip strength data on two subjects using the standardized data collection form and attached to his/her lab report. The grip strength of both right and left hands was measured using a Lafayette Instrument hand-grip dynamometer (Model 78010 measuring up to
100 kg for male subjects and Model 78011 measuring up to 50 kg for female subjects) (Figure 1a) at standing position with shoulder adducted and holding the upper arm vertical on the side but not touching the body, while the elbow flexed at the desired flexed position. The elbow flexion level (angle between the lower and upper arms) was approximated using a goniometer (Figure 1b). The subjects were asked to exert his/her maximum squeezing force on the hand dynamometer handle, and the results were recorded on the data collection form.
angles. As illustrated in Figure 2, the elbow was flexed by 120°, 90°, 60°, 30°, and 0° (elbow in full extension).
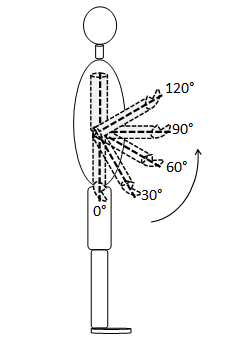
Figure 2: Elbow flexion levels. The subjects were asked to apply their maximum force on the dynamometer handle in each trial. The observed values were recorded in kilograms. The orders of the measurements on each subject for the hands (left and right), and the elbow positions were predetermined for each subject on a random basis (by lottery-style drawings). Each observer was instructed to alternate the experiments between the two subjects. This along with the hand alternation provided at least 2 minutes for the hand-fatigue recovery. Each pair of measured data was treated as paired-observation, and the Student's t test was used to perform statistical analyses for pair-wise comparisons of the grip strength at the five elbow flexion levels (angles).
Results
| Grip Strength of Dominant Hand | Grip Strength of Non-dominant Hand | |||||||||||||||
|---|---|---|---|---|---|---|---|---|---|---|---|---|---|---|---|---|
| Flexion: | 120° | 90° | 60° | 30° | 0° | Ave | 120° | 90° | 60° | 30° | 0° | Ave | ||||
| Female (n = 125) | ||||||||||||||||
| Mean | 26.5 | 27.1 | 26.2 | 26 | 28.2 | 26.8 | 24 | 24.7 | 23.8 | 23.9 | 25.4 | 24.4 | ||||
| Std Dev | 7.07 | 6.67 | 7.21 | 6.83 | 6.73 | 6.54 | 6.72 | 6.74 | 6.58 | 6.53 | 6.5 | 6.34 | ||||
| Male (n = 222) | ||||||||||||||||
| Mean | 44.5 | 46.1 | 45.1 | 45 | 47.2 | 45.6 | 40.4 | 42.4 | 41.1 | 41.2 | 43.4 | 41.7 | ||||
| Std Dev | 9.57 | 9.88 | 9.55 | 9.16 | 9.75 | 8.97 | 9.57 | 9.45 | 8.95 | 8.73 | 9.77 | 8.73 | ||||
| All (n = 437) | ||||||||||||||||
| Mean | 38 | 39.3 | 38.3 | 38.2 | 40.4 | 38.8 | 34.5 | 36.1 | 34.9 | 35 | 36.9 | 35.5 | ||||
| Std Dev | 12.29 | 12.73 | 12.62 | 12.41 | 12.67 | 12.18 | 11.71 | 12.07 | 11.66 | 11.52 | 12.26 | 11.51 |
Table 2: The mean and standard deviation of the grip strength (in kg force) at various elbow flexion levels for the female, male
Table 2: The mean and standard deviation of the grip strength (in kg force) at various elbow flexion levels for the female, male and all subjects. The elbow positions associated with the highest measured grip strength values were tallied. As shown in Table 3 for the dominant hand and Table 4 for the non- dominant hand, about a 50% of subjects (both female and male) achieved their greatest grip strength with the elbow in a fully extended position (i.e., in a 0° flexion). The results also revealed that about 27% of the subjects had their highest grip strength with the elbow in the 90° flexed position. Some subject had their greatest grip strengths at a multiple elbow positions. This explains why the percentages add up to more than 100%. As can be seen in Table5, the same pattern was found when the grip strength in both hands of each subjects were averaged.
| Elbow | Female subjects (n = 125) | Male subjects (n = 222) | All subjects (n = 347) | |||||||||||
|---|---|---|---|---|---|---|---|---|---|---|---|---|---|---|
| flexion | Number | % of subjects | Number | % of subjects | Number | % of subjects | ||||||||
| 120° | 20 | 16 | 27 | 12 | 47 | 14 | ||||||||
| 90° | 27 | 22 | 67 | 30 | 94 | 27 | ||||||||
| 60° | 12 | 10 | 21 | 10 | 33 | 10 | ||||||||
| 30° | 12 | 10 | 17 | 8 | 29 | 8 | ||||||||
| 0° | 65 | 52 | 101 | 46 | 166 | 48 | ||||||||
| flexion | Number | % of subjects | Number | % of subjects | Number | % of subjects | ||||||||
| 120° | 18 | 14 | 33 | 15 | 51 | 15 | ||||||||
| 90° | 40 | 32 | 55 | 25 | 95 | 27 | ||||||||
| 60° | 9 | 7 | 28 | 13 | 37 | 11 | ||||||||
| 30° | 16 | 13 | 23 | 10 | 39 | 11 | ||||||||
| 0° | 61 | 49 | 106 | 48 | 167 | 48 |
Table 3: The number and percentage of subjects having the highest averaged grip strength in both hands at a specific elbow flexio
| Elbow | Number | Percentage | ||||||
|---|---|---|---|---|---|---|---|---|
| flexion | of subjects | of subjects | ||||||
| 120° | 47 | 14 | ||||||
| 90° | 88 | 25 | ||||||
| 60° | 25 | 7 | ||||||
| 30° | 24 | 7 | ||||||
| 0° | 179 | 52 |
Table 4: The number and percentage of subjects having the highest averaged grip strength in both hands at a specific elbow flexio
A pair-wise comparison, using the Student’s T-Test, was used to statistically analyze the differences in the hand-grip strengths at the five elbow positions. The results of the comparisons are summarized in Table 6 for the dominant hand, Table 7 for the non-dominant hand, and Table 8 for both hands averaged grip strength achieved at the 120°, 90°, 60°, 30° and 0° elbow flexion levels. The comparison test results showed the same patterns of consistent differences in the grip strengths in the dominant, non-dominant and the average for both hands for each pair of elbow positions.
| Elbow Flexion | 90° | 60° | 30° | 0° | ||||||||||
|---|---|---|---|---|---|---|---|---|---|---|---|---|---|---|
| 120° | DHG – DHG 90° 120° (0.768, 1.765) p-value = 0.000 | DHG – DHG 60° 120° (-0.202, 0.801) p-value = 0.240 | DHG – DHG 30° 120° (-0.334, 0.749) p-value = 0.452 | DHG – DHG 0° 120° (1.761, 2.982) p-value = 0.000 | ||||||||||
| 90° | DHG – DHG 90° 60° (0.530, 1.403) p-value = 0.000 | DHG – DHG 90° 30° (0.575, 1.543) p-value = 0.000 | DHG – DHG 0° 90° (0.523, 1.688) p-value = 0.000 | |||||||||||
| 60° | DHG – DHG 60° 30° (- 0.266, 0.450) p-value = 0.613 | DHG – DHG 0° 60° (1.545, 2.599) p-value = 0.000 | ||||||||||||
| 30° | DHG – DHG 0° 30° (1.715, 2.613) p-value = 0.000 |
Table 5: Pairwise comparison of both-hands averaged grip strength at various elbow flexions. Note: BHG90° (for example) designate
| Elbow Flexion | 90° | 60° | 30° | 0° | ||||||||||
|---|---|---|---|---|---|---|---|---|---|---|---|---|---|---|
| 120° | NHG – NHG 90° 120° (1.116, 2.024) p-value = 0.000 | NHG – NHG 60° 120° (-0.039, 0.850) p-value = 0.074 | NHG = NHG 30° 120° (-0.035, 0.952) p-value = 0.068 | NHG – NHG 0° 120° (1.807, 3.014) p-value = 0.000 | ||||||||||
| 90° | NHG – NHG 90° 60° (0.769, 1.560) p-value = 0.000 | NHG – NHG 90° 30° (0.677, 1.546) p-value = 0.000 | NHG – NHG 0° 90° (0.298, 1.384) p-value = 0.002 | |||||||||||
| 60° | NHG – NHG 60° 30° (-0.390, 0.284) p-value = 0.757 | NHG – NHG 0° 60° (1.509, 2.502) p-value =.000 | ||||||||||||
| 30° | NHG – NHG 0° 30° (1.502, 2.402) p-value = 0.000 | |||||||||||||
| 120° | BHG – BHG 90° 120° (1.009, 1.827) p-value = 0.000 | BHG – BHG 60° 120° (-0.040, 0.746) p-value = 0.079 | BHG – BHG 30° 120° (-0.102, 0.768) p-value = 0.133 | BHG – BHG 0° 120° (1.865, 2.927) p-value = 0.000 | ||||||||||
| 90° | BHG – BHG 90° 60° (0.730, 1.400) p-value = 0.000 | BHG – BHG 90° 30° (0.696, 1.473) p-value = 0.000 | BHG - BHG 0° 90° (0.482, 1.464) p-value = 0.000 | |||||||||||
| 60° | BH – BH 60° 30° (-0.249, 0.288) p-value = 0.886 | BHG – BHG 0° 60° (1.604, 2.474) p-value =.000 | ||||||||||||
| 30° | BHG > BHG 0° 30° (1.674, 2.443) p-value = 0.000 |
Table 6: Pairwise comparison of both-hands averaged grip strength at various elbow flexions. Note: BHG90° (for example) designate
Table 8: Pairwise comparison of both-hands averaged grip strength at various elbow flexions. Note: BHG90° (for example) designates the mean both-hand averaged grip strength in the 90° elbow flexion. Values in the parentheses are the 95% confidence interval between means of grip strength in the pair of compared elbow flexions Based on the results, as presented in Tables 6-8, the effects of the elbow flexion levels are grouped and presented in Table 9.
| Factor | n | Mean | Grouping | ||||||||||
|---|---|---|---|---|---|---|---|---|---|---|---|---|---|
| BH at 120° | 347 | 38.0 | A | ||||||||||
| DH at 60° | 347 | 38.3 | A | ||||||||||
| DH at 30° | 347 | 38.2 | A | ||||||||||
| DH at 90° | 347 | 39.3 | B | ||||||||||
| DH at 0° | 347 | 40.4 | C |
Table 7: Two-sample T-test for MBHGA vs FBHGA. Note: MBHGA and FBHGA designate the average grip strength of both hands for the ma
- strength obtained by dominant and non-dominant hands.
- Paired T for DHGA - NHGA
- N
- Mean
- StDev
- SE Mean
- DHGA
- 347
- 38.815
- 12.176
- 0.654
- NHGA
- 347
- 35.47
- 11.509
- 0.618
- Difference
- 347
- 3.345
- 4.032
- 0.216
- 95% CI for mean difference: (2.919, 3.771)
- T-Test of mean difference = 0 (vs ≠ 0): T-Value = 15.45 P-Value = 0.000
Table 8: A pair-wise comparisons of the effects of the dominant and non-dominant hands on the grip strength.
between the two genders regarding their grip strength (Table 11). On an average basis, the females had about 41% lower grip strength than the male subjects.
| N | Mean | St.Dev | SE Mean | |||||||||||
|---|---|---|---|---|---|---|---|---|---|---|---|---|---|---|
| MBHGA | 222 | 43.65 | 8.54 | 0.57 | ||||||||||
| FBHGA | 125 | 25.59 | 6.33 | 0.57 | ||||||||||
| Difference = μ (MBHGA) - μ (FBHGA) Estimate for difference: 18.057 95% CI for difference: (16.472, 19.641) T-Test of difference = 0 (vs ≠): T-Value = 22.42 P-Value = 0.000 DF = 319 |
Table 9: Two-sample T-test for MBHGA vs FBHGA. Note: MBHGA and FBHGA designate the average grip strength of both hands for the ma
Conclusion
The results of this study revealed that the greatest hand grip strength is attained when the elbow is held in the fully extended position (no flexion). This is probably due to the fact that the muscles are not loaded for holding an object away from the body, which increases torque in the hand-arm joint that must be counter-acted by the muscles for maintaining the state of equilibrium. However, holding the elbow in an extended position and hanging the arm on the side of the body may not be practical for performing most types of work and daily activities. As the results of study revealed, performing the grip exertion task in the 90° flexed elbow position is the next desirable elbow posture, in which the grip strength was found to be statistically significantly higher than the strength obtained in any other elbow flexed positions. The results of this study also showed that, on an average, the grip strength of the dominant hand was found to be significantly higher than that of the non- dominant hand. However, no significant difference was found for the dominant and non-dominant hands regarding at which elbow position the highest grip strength is achieved. This study showed that the grip strength of the female subjects was significantly lower than that obtained by the male subjects. On an average, the female group had about 41% lower grip strength than the male subjects.
References
-
Barut C, Demirel D (2012) Influence of Testing Posture and Elbow Position on Grip Strength. Medical Journal of Islamic World Academy of Sciences 20(3): 94-97.
-
Manjula, Kaur J, Malik M, Joshi S (2014) Impact of Positions of Shoulder, Elbow, Wrist, Body Posture and Hand Span on Grip Strength - A Review Study. International Journal of Advanced Research 2(9): 356-365.
-
Malina RM, Zavaleta AN, Little BB (1987) Body Size, Fatness, and Leanness of Mexican American Children in Brownsville, Texas: changes between 1972 and 1983. American Journal of Public Health 77(5): 573- 577.
-
Chatterjee S, Chowdhuri BJ (1991) Comparison of grip strength and isometric endurance between the right and left hands of men and their relationship with age and other physical parameters. J Hum Ergol (Tokyo) 20(1): 41-50.
-
Ross CH, Rosblad B (2002) Norms for grip strength in children aged 4-16 years. Acta Paediatrica 91(6): 617-625.
-
Brickman DB (1990) Ergonomic Study of Grip- Literature Review. Safety Brief, Triodyne Inc, Illinois, 6(2):1-18.
-
Khan S, Ansari S, Agrawal R (2014) Influence of BMI on Handgrip Strength in Normal Individual. Indian Journal of Physical Therapy 2(2): 1-4.
-
Sartorio A, Lafortuna CL, Pogliaghi S, Trecate L (2002) The Impact of Gender, Body Dimension and Body Composition on Hand-Grip Strength in Healthy Children. J Endocrinol Invest 25(5): 431-435.
-
Smrithi Shetty, Shibin Girish, Nagaraja S (2012) Influence of Various Anthropometric Parameters on Handgrip Strength and Endurance in Young males and Females. International Journal of Biological & Medical Research 3(3): 2153-2157.
-
Mathiowetz V, Rennells C, Donahoe L (1985) Effect of elbow position on grip and key pinch strength. J Hand Surg Am 10(5): 694-697.
-
Incel NA, Ceceli E, Durukan PB, Erdem HR, Yorgancioglu ZR (2002) Grip strength: effect of hand dominance. Singapore Medical Journal 43(5): 234- 237 .
- The Expanding Landscape of Road Rage: A Systematic Review of Conflicts Involving Drivers, Pedestrians, and Micromobility
- Validating Cognitive Models of Royal Navy Performance on Control Systems
- Comparing Standard and State-of-the-art Firefighter Coats on Postural Balance and Gait in a Live Burn Environment
- Investigating the Integration of Telemedicine into Clinicians Workflow: A Review of Methods
- Risk Assessment of Ergonomic Factors in a Textile Firm by RULA, REBA and Fine Kinney Methods
- Impact of Self-Esteem Training on Individuals with Disabilities Aged 17-30