Evaluation of Influencing Factors on Reliability of Industrial Operators’ Safe Performance Based on Multi Variant Analyses
Human reliability refers to individual ability in properly doing certain job affairs taken over in a given period. One of means that make management capable of improving individual performance is human reliability analyses (HRA). This investigation is of an applicable fundamental type. Target society includes 30individuals belong to olefin plant of Imam Khomeini port petro chemical complex. In this investigation SPAR-H method is used. Some questionnaires (NASA-TLX, MEQ, ANQ, web based software (Fitts’ Law) and working procedure sheets (SPAR-H)) are used to collect data. SPSS software is used to collect data and also descriptive statistics method is used to analyzed at a statistically. Results show that operator’ reliabilities levels are more in doing operational duties than diagnostic ones.
Introduction
Petrochemicals are one of major industries existing in countries possess oil and gas fields. Economical dependency to oil money intensifies severity of this matter especially in our country, Iran. In spite of some efforts made to develop non-oil in comes and reduce dependency to oil in the country, there still is high dependency to oil money. Therefore it’s of special importance to have so reliable system in this field. One of factors which influence reliability is operator’s errors.
Human error is a general term that covers all events which deter suitable outcomes to achieve through mental or physical planned activities when it is not possible to relate these imperfections to occurs to chastically [1, 2]. Thus getting these factors identified and controlling them is so crucial. Today, some 210000 people are employed in oil administration. Based on present statistics human errors account for 65% of events in oil industry. Identifying influential factors on operators’ mistakes and controlling them is so crucial. In order for an operator to do desirably their responsibilities, it requires identifying factors affecting his/her own performance and considering expedient actions.
Human reliability analysis (HRA) is a generic term used for collection of procedures and models that are used to anticipate human error occurrence. Origin of HRA is probabilistic safety assessment (PSA). HRA is increasingly being used as both a procedure to assess risk of human error and a procedure for decreasing system vulnerability. Three main principles of HRA include: identifying errors that could occur (human error), decision making about error occurrence probability (quantifying human errors) and increasing human reliability by decreasing probability of errors (decreasing human errors). In practice, all of HRA methods and processes [3, 4, 5].
SPAR-H method (2004 revision)— Standardized Plant Analysis Risk-Human Reliability Analysis method; third (current) iteration of SPAR-H, with following characteristics: Action versus diagnosis task distinction preserved, time influencing factorre-defined for low power and shutdown events, dependency refined, uncertainty calculation methods determined, ASME Standard for Probabilistic Risk Assessment (PRA) requirements addressed, clarification on recovery presented, at power and LP/SD considerations made explicit.
Are based on the assumption that meaning full application of human errors concept is to develop accurately estimation of human errors. Human error is not defined clearly in human performance classification. Relating error to some individuals, teams or an organization is basically a social and psychologist process and is not taken from objectively a technique.
In an industrial environment, reliability is divided to three main areas, as follows:
a) Human reliability b) Equipment reliability c) Process reliability Above cases produce system reliability, so it can be said that system is composed of human being, equipment and process interactions. Human reliability on decision making correctly, doing activities properly or doing activities just in time is not a matter of ignorance. Evaluating human reliability aims at preparing detail description of man role in risk situation and identifying methods to decrease it [6].
Mououdi MA, et al. Evaluation of Influencing Factors on Reliability of Industrial Operators’ Safe Performance Based on Multi Variant Analyses. Ergonomics Int J 2018, 2(2): 000141.
Human reliability is influenced by human errors. This susceptibility roots in studying human performance. Several factors influence on man performance and at some point occasionally deduce to human errors. Resulting errors deter desirable performance and consequently decrease human reliability. Various methods to assess human reliability and evaluate risk and identify major human errors, relating to carrier responsibilities, quantifying them and introducing essential strategies in order for preventing error occurrence or mitigating their consequences has gradually emerged sinceearly1970. Process of HRA is composed of several branches including engineering, psychology and agronomy deploying different structures to execute. 72 potential tools relating HRA are identified, of them 32tools are excluded from any investigation and 35 of them are investigated because of relating with HSE. Out of from 35 potential methods relating HSE, 17 methods are used to manage major events. All of HRA techniques are shared in using PSF assessment to determine error probability [7].
Methods
In order to determine reliability among control room operators, shift supervisors, heads and exploiters at Imam Khomeini port petro chemical plant, olefin division, and SPAR-H method was used to analyze human reliability risk at that standardized industrial division. This procedure is a primitive procedure (first generation) developed based on HEART procedure. SPAR-H procedure rely on recordingmajoreventsandanalyzing8 SPFs and applying them in calculation of human error probability (HEP) then, considering given events, human reliability will be determined based on those results. Eight performance forming factors that are assessed as dependent variables are: a) Available time b) Stress/ stressors c) Complexity d) Experience/training e) procedures f) Ergonomics/HMI g) Fitness for duty h) Work processes Above eight factors are assessed through checklists [8, 9]. As responsibilities are usually divided to two categories in SPAR-H method(diagnostic and operational ones) and site operational conditions divide to two categories namely At-Power and LP/SD(At-Power implies when target division is working at its full pre-defined capacity and LP/SD means when the division is operating at sub optimum power or is out of service totally), 4 check lists are used to assess PSF. Considering relations among performance forming factors and human error probability ( Figure 1), assigned numbers to each PSF will be used in the following formula to determine HEP(human error probability ) after final calculations are completed.
N EP PSFcomposite N EP PSFcomposite
When HEP calculation is got done, using following formula, individual reliability at every target events would be determined: Reliability=1- HEP
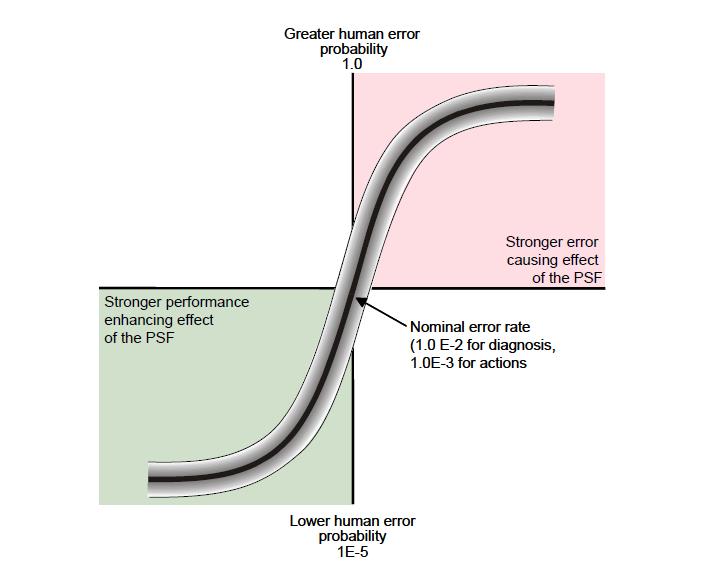
Figure 1: Relation between HEP and performance effect of PSF (least probability of human error, most probability of human error, performance is an effective strong factor on PSF, error is an effective strong factor on PSF, nominal error rate (10-6) for diagnostic and (10-5) for operational ). In this study, in order to determine values of PSF (of available time, complexity, stress and agronomics/HMI), Fitts’ Law, NASA-TLX Technique, ANQ scale (questionnaire stress assessment) and questionnaire of daily self-assessment in the morningness and eveningness (MEQ) are used respectively. Fitts' law is a model of human psychomotor behavior developed in 1954. Extending Shannon’s theorem 7 in information theory (a formulation of effective information capacity of a communication channel), Fitt's discovered a formal relationship that models speed/accuracy tradeoffs Mououdi MA, et al. Evaluation of Influencing Factors on Reliability of Industrial Operators’ Safe Performance Based on Multi Variant Analyses. Ergonomics Int J 2018, 2(2): 000141.
in rapid, aimed movement (not drawing or writing). According to Fitts Law, the time to move and point to a target of width W at a distance A is a logarithmic function of the spatial relative error (A/W), that is:
$$ M T = a + b \log_ {2} \left(2 A / W + c\right) $$
Where
- MT is the movement time
- a and b are empirically determined constants, that are device dependent.
- c is a constant of 0, 0.5 or 1
- A is the distance (or amplitude) of movement from start to target center
- W is the width of the target, which corresponds to accuracy The term log2 (2A/W + c) is called the index of difficulty (ID). It describes the difficulty of the motor tasks. 1/b is also called the index of performance (IP), and measures the information capacity of the human motor system. Fit’s law is usually used to predict time and is based on targeting a given point on the screen using several tools like mouse, ball and finger. The procedure is to sit down a person in front of a PC and point appearing points on the screen as immediately as possible. Different targets appearing on the screen are circles having various sizes and colors including white, red, blue, and green with various spacing among them. Size of a given target changes as is touched once. On the other hand, the position of each target is different from its previous position. The procedure to point the targets is to point white target at the first to activate other targets. Finally, average time (in milliseconds) used by a given user for every target is counted, then The greatest time is selected and changed per minutes and compared to default time stored in the system. Comparison with preset time gives results which interpreted in terms of improper time, nearly suitable, normal time, long time but less than 30 min and so long time. This duration would be recorded in work paper and respective score would be registered too. ANQ scale is used to measure stress in this investigation (Iron son and et.al, 1989). This scale is an overall stress scale in which behavioral and emotional symptoms are usually used to evaluate overall stress. This scale includes 27 general questions that the answers are indicated with “never, seldom, sometimes, almost and always”.
An adjusted questionnaire was given to every operator to measure his/her stress level and then completed questionnaires were collected. After summarization, the level of individual’s stress was indicated as one of these three levels: so high, high, normal (nominal) and improper data. After determination of stress level, corresponding number of given level was registered at work paper SPAR-H. NASA – TLX questionnaire includes two main parts; one for investigating work load level and another for determining significance level of each work load dimension relative to other dimensions in perspective of respondent. NASA – TLX Work load in the questionnaire is divided to intellectual physical demands, time, effort, performance and discourage level. In order to determine significance of each work load dimension a scale ranges from 0-100 is used. In doing so, respondent/participant is asked to score every of six work load dimensions from 0 to 100 according to his/her work conditions. After getting the score of every work load dimension and doing required calculations based on NASA-TLX, following division is necessary to determine PSF level of complexity and corresponding score according to SPAR-H questionnaire. Score determination based on SPAR-H questionnaire regarding NASA-TLX results Table 1.
| Classification | ||||||||
|---|---|---|---|---|---|---|---|---|
| C | lassification accordin | g | o | Score based | X | |||
| according to | ||||||||
| to NASA-TLX | n NASA-TL | |||||||
| SPAR-H | ||||||||
| So little | 2 – 02 | Clear diagnosis | ||||||
| little | 0 -02 | Nominal | ||||||
| medium | 0 – 02 | medium | ||||||
| high | 0 - 02 | high | ||||||
| So high | 0 - 22 | So high |
Table 2: NASA-TLX results based on SPAR-H Classification Self-appraisal Morningness- eveningness questionnaire (MEQ1) is used to
Table 1: NASA-TLX results based on SPAR-H Classification Self-appraisal Morningness- eveningness questionnaire (MEQ1) is used to determine ergonomics / machine- human interface coefficient. The questionnaire has 19 questions that most of them are quadrille answers for questions 3,4,5,6,7,8,9,11,12,13,14,15 and16, suitable score for every answer is displayed in answer sheet. for questions ,0, 2 and 0 a tick or” +” on scale line will refer to given score limit under scale line. For question 17, the highest score at the right side is considered as reference and suitable score is considered at lower limit of this point.
1Morningness – Eveningness Questionnsire
Mououdi MA, et al. Evaluation of Influencing Factors on Reliability of Industrial Operators’ Safe Performance Based on Multi Variant Analyses. Ergonomics Int J 2018, 2(2): 000141.
Based on achieved scores in MEQ questionnaire, Since suitable score in SPAR-H questionnaire should be belonged to agronomy PSF/HMI machine – human interface, then following division would be considered( as Table 2 shows): Scores would be related to corresponding level after having classification determined in SPAR-H questionnaire.
- Classification based on ergonomics factor/HMI in SPAR-H questionnaire
- Definitely morning orientated weak
- Classification in MEQ questionnaire
- Nearly morning orientated
- Weak
- Neither morning nor evening oriented
- Weak
- Nearly evening orientated
- Nominal
- Definitely evening orientated good
Table 1: Classification of ergonomics factor /HMI of
Results
According to NASA-TLX, Resulting scores for complexity determination were limited to 73.01±10.115. Resulting scores for stress, based on ANQ scale ranged 02.52± 0.200. Calculated time based on Fit’s law software was determined 1.6222±0.37126 seconds. According to MEQ questionnaire, Results for individual’s status regarding work shift were at 54.47±7.186. In this investigation, calculated HEP value was 0.0754±0.0494. After analyzing prepared answers of the questionnaire, individual stress levels were divided to two normal and high classifications as follows: Division Staff is classified according to the table given below (Table 3).
| Abundance | ||||||||
|---|---|---|---|---|---|---|---|---|
| Stress level | abundance | |||||||
| percentage (%) | ||||||||
| normal | 02 | 20. | ||||||
| high | 3.3 | |||||||
| Total | 32 | 22 |
Table 3: Stress levels at subjects. In NASA-TLX, Individuals are classified in three classes respect to work complexity: medium c
| Complexity level | Abundance | |||||||
|---|---|---|---|---|---|---|---|---|
| Abundance | ||||||||
| based on NASA-TLX | percentage (%) | |||||||
| Medium | 0 | 00.7 | ||||||
| normal | 7 | 50.7 | ||||||
| High | 5 | 0.7 | ||||||
| total | 30 | 100 |
Table 4: Individual status in terms of work shift, according to MEQ questionnaire. Above table shows that totally 30 individuals
| Abundance | ||||||||
|---|---|---|---|---|---|---|---|---|
| Work shift according to | ||||||||
| Abundance | percentage | |||||||
| MEQ | ||||||||
| (%) | ||||||||
| Neither morning nor evening orientated | 0 | 72 | ||||||
| Nearly morning orientated | 0 | 00.7 | ||||||
| Definitely morning orientated | 3.3 | |||||||
| Total | 32 | 22 |
Table 6: Individual status in terms of work shift, according to MEQ questionnaire. Above table shows that totally 30 individuals
Table 5: Individual status in terms of work shift, according to MEQ questionnaire. Above table shows that totally 30 individuals have participated in this investigation whom are divided to four job classes. Control room staffs at a shift were 18 persons that amounts 60% of total participants. Shift supervisors who are 6 persons including 20% of reviewed persons. Two individuals (6.7% of total population) are exploiters and ultimately four persons (including 13.3% of total population) are head of olefin division. Staff Statistics at 4 shifts, namely Morning (A), Evening (B), Night (C), early Morning after Might Sleep (D) and permanent morning shift (S-R) is as follows:
- class abundance abundance in percentage
- Control room staff at a shift
- 18
- 60
- Shift supervisor
- 6
- 20 exploiters
- 2
- 6.7
- Head of olefin division
- 4
- 13.3
- Total
- 30
- 100
Table 5: Classification of job types.
Shift classification abundance Abundance in
percentage A(morning shift) 5 16.7 B(Evening shift) 8 26.7 C(Night shift) 6 20 D(Morning after Might Sleep shift) 7 23.3 S-R(permanent morning shift) 4 13.3 Total 30 30
| Individual reliability for a | ||||||||||||||||
|---|---|---|---|---|---|---|---|---|---|---|---|---|---|---|---|---|
| I | dentificatio | n | HEP ( Human Error | |||||||||||||
| given event | ||||||||||||||||
| code of the | Recorded events | shif | t | Probability) | ||||||||||||
| (HumanReliability (HR)) | ||||||||||||||||
| persons | ||||||||||||||||
| Diagnostic | Activity | Diagnostic | Activity | |||||||||||||
| 1 | Explosion in heat exchanger | C | 0.16 | 0.84 | ||||||||||||
| Exchanger burst | C | 0.08 | 0.92 | |||||||||||||
| Non exhaust of gases from FA920 TO FB920 | C | 0.16 | 0.84 | |||||||||||||
| Downstream out of service | C | 0.75573 | ||||||||||||||
| 2 | Downstream Run out | C | 0.125 | 0.875 | ||||||||||||
| TLE heat exchanger failure | C | 0.16807 | 0.1681 | 0.8319 | ||||||||||||
| Cooling system failure | C | 0.1 | 0.1 | 0.9 | ||||||||||||
| 3 | Cutting out of steam in HS division | C | 0.016 | 0.016 | 0.984 |
Table 7: Individual reliability at various events. This table is divided to 5 main columns. First column (from right to left) rep
Mououdi MA, et al. Evaluation of Influencing Factors on Reliability of Industrial Operators’ Safe Performance Based on Multi Variant Analyses. Ergonomics Int J 2018, 2(2): 000141.
| Convection of cracked gases toward metal | C | 0.01 | 0.01 | 0.99 | ||
|---|---|---|---|---|---|---|
| Spontaneously coke formation in furnace, s coils | C | 0.01 | 0.01 | 0.99 | ||
| 4 | Nonstandard ethylene product | C | 0.2 | 0.2 | 0.8 | |
| Transferring ethylene exit from compressor 601 to metal | C | 0.28777 | 0.2878 | 0.7122 | ||
| Pump 301 out of service | C | 0.13913 | 0.1391 | 0.8609 | ||
| Cut out feeding from hot region | C | 0.28777 | 0.2878 | 0.7122 | ||
| Acoustic leakage from reservoir 204 | C | 0.04 | 0.04 | 0.96 | ||
| 5 | Damage of cracking furnace | B | 0.22857 | 0.2286 | 0.7714 | |
| Heat exchanger damage | B | 0.18571 | 0.1857 | 0.8143 | ||
| Tearing of furnace coils | B | 0.05 | 0.05 | 0.95 | ||
| 6 | Reactor out of service | B | 0.1 | 0.9 | ||
| Tower out of service | B | 0.1 | 0.9 | |||
| Compressor out of service | B | 0.1 | 0.9 | |||
| Furnace out of service | B | 0.02 | 0.98 | |||
| 7 | Hydrogen not produced | B | 0.1 | 0.9 | ||
| Explosion at neutralizing region | B | 0.05 | 0.95 | |||
| Olefin plant out of service | B | 0.16807 | 0.83193 | |||
| 8 | Fire inside the furnace | B | 0.0196 | 0.9804 | ||
| Fire in TLE | B | 0.001 | 0.999 | |||
| Cut out of seawater flowing to cooling system | B | 0.1687 | 0.8313 | |||
| 9 | Cracking furnace out of service | B | 0.01 | 0.99 | ||
| Heat transfer agitation in consumer convertors | B | 0.1 | 0.99 | |||
| Cracking furnace out of service | B | 0.16807 | 0.83193 | |||
| 10 | Explosion resulting from propylene gas leakage | B | 0.002 | 0.998 | ||
| Fire in pump A920 | B | 0.02 | 0.98 | |||
| 11 | Destruction of inside coils of furnace BA104 | A | 0.08 | 0.92 | ||
| Malfunction of compressor (diagnostic) | A | 0.16 | 0.984 | |||
| Malfunction of compressor (activity) | A | 0.01 | 0.99 | |||
| Malfunction of furnace 111 | A | 0.04 | 0.96 | |||
| 12 | Pump 301 out of service | A | 0.13913 | 0.86087 | ||
| Ethylene gas leakage from pump 415 | A | 0.05 | 0.95 | |||
| Combustion resulting from hydrogen leakage from converter 407 | A | 0.1 | 0.9 | |||
| Explosion and leakage of poison materials | A | 0.05 | 0.95 | |||
| System out of service | A | 0.08 | 0.92 | |||
| 13 | Combustion resulting from ethylene leakage from the pump | A | 0.05 | 0.95 | ||
| Combustion of PZV reservoir 910 | A | 0.1 | 0.9 | |||
| Loss of product | A | 0.09174 | 90826 | |||
| Downstream out of service | A | 0.09174 | 0.90826 | |||
| Low quality gasoline production | A | 0.09174 | 0.90826 | |||
| 14 | Cracking of compressor blades | D | 0.24427 | 0.75573 | ||
| Explosion of exiting gas from furnace | D | 0.1 | 0.9 | |||
| Reactor explosion | D | 0.1 | 0.9 | |||
| Considerable leakage of propylene out of flange | D | 0.2 | 0.8 | |||
| Fire in cooling tower | D | 0.1 | 0.9 | |||
| 15 | Heat treatment furnace out of service | D | 0.13913 | 0.86087 | ||
| Heat treatment furnace out of service | D | 0.08 | 0.92 | |||
| Fracture and out of services of the coils | D | 0.2 | 0.8 | |||
| Emergency cut out of service for furnace | D | 0.08 | 0.92 | |||
| Hydrocarbon leakage through furnace exhausts to atmosphere | D | 0.08 | 0.92 | |||
| 16 | Furnace out of service | D | 0.05 | 0.95 | ||
| Reactor out of service | D | 0.16807 | 0.83193 | |||
| Tower 404 out of service | D | 0.1 | 0.9 | |||
| Downstream out of service | D | 0.20161 | 0.79839 | |||
| Compressors 201,601and 501 out of service | D | 0.09174 | 0.90826 | |||
| 17 | Repairman burning accident | S-R | 0.005 | 0.995 | ||
| Fire in furnace 101 | S-R | 0.01 | 0.99 | |||
| Gasoline leakage from top of reservoir 1851 | S-R | 0.005 | 0.995 | |||
| 18 | Tower 203 emptying | S-R | 0.005 | 0.995 | ||
| Fir at the top of pump 101 | S-R | 0.005 | 0.995 | |||
| Gasoline leakage of tower 202 | S-R | 0.005 | 0.995 | |||
| 19 | Temperature increase in reactor 402 | B | 0.08 | 0.92 | ||
| Decrease in tower 404 temperature | B | 0.16 | 0.84 | |||
| Increasing drum 802 level | B | 0.08 | 0.92 | |||
| 20 | Increasing in height of heavy hydrocarbon level in tower 101 | B | 0.08 | 0.92 | ||
| Increasing furnace temperature | B | 0.08 | 0.92 | |||
| Pressure drop of pumps BFW | B | 0.08 | 0.92 | |||
| 21 | Non-real alert of propylene compressor’s pressure level | A | 0.1 | 0.9 | ||
| Gas charging compressor out of service | A | 0.1 | 0.9 | |||
| Pressure drop of methane isolating tower | A | 0.1 | 0.9 | |||
| Actuating safety valve at exit line of compressor 501 | A | 0.05 | 0.95 | |||
| 22 | Non- desirable production of ethylene product | A | 0.05 | 0.95 | ||
| Ignition in furnace | A | 0.05 | 0.95 | |||
| 23 | Gas leakage from converter 212 | S-R | 0.005 | 0.995 | ||
| Ethylene leakage from intake line of region 40 | S-R | 0.005 | 0.995 | |||
| Mechanical leakage of pump 920, s seal | S-R | 0.005 | 0.995 | |||
| 24 | Increasing pressure of compressor 501 | C | 0.05 | 0.95 | ||
| Increasing pressure at exiting ethylene line to ward downstream | C | 0.05 | 0.95 | |||
| Increasing of tower 404 temperature | C | 0.05 | 0.95 | |||
| 25 | Increase of cracking furnace temperature | C | 0.04 | 0.96 | ||
| Lowering steam drum, s water level | C | 0.04 | 0.96 | |||
| Exiting fire from visit opening of furnace | C | 0.08 | 0.92 | |||
| 26 | Increase of tower DA101 temperature | S-R | 0.01 | 0.99 | ||
| Severe vibration of tower 103 | S-R | 0.005 | 0.995 | |||
| Tearing one of furnaces coils furnace 111 | S-R | 0.01 | 0.99 | |||
| 27 | Flowing down of caustic materials toward furnace 111 | D | 0.04 | 0.96 | ||
| Causal out of service pump 920 | D | 0.1 | 0.9 | |||
| Gas leakage from reservoirs | D | 0.05 | 0.95 | |||
| 28 | Sever e leakage of Chlorine gas | D | 0.1 | 0.9 | ||
| Gas leakage from level indicators of reservoirs | D | 0.05 | 0.95 | |||
| Botulism with nitrogen gas | D | 0.05 | 0.95 | |||
| 29 | Pump 701 Out of service | D | 0.005 | 0.995 | ||
| Furnace out of service | D | 0.005 | 0.995 | |||
| Combustion in furnaces | D | 0.05 | 0.95 | |||
| 30 | Fire in aniline line | D | 0.05 | 0.95 | ||
| Fire inside the tower 404 | D | 0.05 | 0.95 | |||
| Fire in blind converter (TLE) | D | 0.05 | 0.95 |
Table 8: Individual reliability at various events. This table is divided to 5 main columns. First column (from right to left) rep
Mououdi MA, et al. Evaluation of Influencing Factors on Reliability of Industrial Operators’ Safe Performance Based on Multi Variant Analyses. Ergonomics Int J 2018, 2(2): 000141.
Mououdi MA, et al. Evaluation of Influencing Factors on Reliability of Industrial Operators’ Safe Performance Based on Multi Variant Analyses. Ergonomics Int J 2018, 2(2): 000141.
Table 8: Individual reliability at various events. This table is divided to 5 main columns. First column (from right to left) represents identification code of individuals whom are interviewed during investigation. Second column relates to mentioned events by individuals. Attempts were done to record at least 3 events from every one in every occupational level. Column 3 shows shifts that individual interviewed worked in (A: morning shift, B: evening shift, C: night shift, D: early morning after night sleep and S-R fixed shift). HEP represents human Error probability for every registered event. This column is dividend to two diagnostic and activity sub columns based on SPARH-H technique considering activity type in which event is happened. Last column refers to individual reliability in every registered event. Every individual is identified by determined identification code. Mentioned events by everyone (at least three events for every one) are registered in column2 (from right to left). Shifts in which individuals were working were respectively: A: morning shift, B: evening shift, C: night shift, D: early morning after night sleep and S-R fixed shift.6-Human Error Probability is calculated considering activity type ( diagnostic or activity ) and individual reliability in registered events is calculated thorough formula: Reliability = 1- HEP Then registered in HR column.
Discussion
There was least reliability ( 0.98 )and most reliability (0.999)For operational activities that relate respectively to error in opening valve ZV in timely manner with HEP equals to 0.02and error in closing flanges with HEP equals to 0.001, but there was least reliability (0.71223)for Mououdi MA, et al. Evaluation of Influencing Factors on Reliability of Industrial Operators’ Safe Performance Based on Multi Variant Analyses. Ergonomics Int J 2018, 2(2): 000141.
diagnostic responsibilities that relate with errors like getting wrong with alarm realization (605PIC), error with alarm diagnosis relating to a n increase in pressure(PIC35)And error in diagnosis alarm relating to temperature increase some about (0.28777). The most reliability achieved was 0.995 belonging to some errors like errors in diagnosis water level for tower103, control room operator error in realization for re-circulation in cooling water unit, control room operators in diagnosis for opening bladder valve and also operator error in realization for testing in a timely manner with HEP equals to 0.005. Investigations suggest that probability of individual performance error is more for diagnostic responsibilities than operation alones. It seems that personnel who are taken over operational duties, because of having more time to do the job, necessary skills brought about from more experiences, less stress levels, optimizing operational procedure(because of repetition), focus on the activity through having it done and less complexity benefit from less error levels and more reliability. One of the most important results achieved in this investigation is that in 76.92%, reliability of individuals who work at nuclear industries is higher than reliability for individuals who work at petrochemical industry - olefin division. It seems that this conclusion is regularly expected considering nuclear industries sensitivity and severity of their catastrophic events may happen wherein. According to excellent designs in nuclear industries in various respects like control room design, applying suitable software/ applications, preparing suitable circumstances, preparing work instructions for every work process, periodical education, low stress circumstances, suitable maneuvers in emergency conditions to educate staff in order to control emergency conditions and maintaining themselves in high stress mediums to promote their performance, Making suitable human -machine interface, applying agronomy principals in designing work stations and symbols and indicators, high reliability in repair and maintenance besides usage of reliable equipment made it possible to increase reliability of two factors( equipment and process) significantly.
Conclusion
Resulting HEP and HR demonstrate that probability of performance error among control room operators have the most amounts and as a result these people have less reliability in face of recorded events. It also seems that factors like time restrictions in diagnosis, more complexity of job affairs, having more levels of stress than others and agronomy conditions/HMI of control panel has deduced to more errors and less reliability for these people. In this respect, individuals who work in such processes have been promoted along with other systems and the result is so high reliable, less erroneous system for nuclear industries.
Acknowledgement
This investigation has been supported materially and intellectually by Iran national Petrochemical Corporation. The authors acknowledge all control room staff of olefin division for their sincere cooperation.
References
-
Byers JC, Gertman DI, Hill SG, Blackman HS, Gentillon C, et al. (2000) Simplified plant analysis risk (SPAR) human reliability analysis (HRA) methodology: Comparisons with other HRA methods. Proceedings Mououdi MA, et al. Evaluation of Influencing Factors on Reliability of Industrial Operators’ Safe Performance Based on Multi Variant Analyses. Ergonomics Int J 2018, 2(2): 000141. of the Human Factors and Ergonomics Society Annual Meeting. SAGE Publications 44(8).
-
Dresner L (2010) Applications of Lie's theory of ordinary and partial differential equations, CRC Press.
-
French S, Bedford T, Pollard SJ, Soane E (2011) Human reliability analysis: A critique and review for managers. Safety science 49(6): 753-763.
-
Kolaczkowski A (2004) Good Practices for Implementing Human Reliability Analysis (HRA): Draft Report for Comment, US Nuclear Regulatory Commission, Office of Nuclear Regulatory Research, Division of Risk Analysis and Applications.
-
Konstandinidou M, Nivolianitou Z, Kiranoudis C, Markatos N (2006) A fuzzy modeling application of CREAM methodology for human reliability analysis. Reliability Engineering & System Safety 91(6): 706- 716.
-
Nespoli C, Ditali S (2010) Human Error Probability Estimation for Process Risk Assessment with emphasis on Control Room Operations. Chemical Engineering Transactions 19: 219-224.
-
Smith DJ (2011) Reliability, Maintainability and Risk 8e: Practical Methods for Engineers Including Reliability Centred Maintenance and Safety-Related Systems, Elsevier.
-
Swain AD (1990) Human reliability analysis: need, status, trends and limitations. Reliability Engineering & System Safety 29(3): 301-313.
-
Swain AD, Guttmann HE (1983) Handbook of human- reliability analysis with emphasis on nuclear power plant applications. Final report. Sandia National Labs., Albuquerque, NM (USA).
- The Expanding Landscape of Road Rage: A Systematic Review of Conflicts Involving Drivers, Pedestrians, and Micromobility
- Validating Cognitive Models of Royal Navy Performance on Control Systems
- Comparing Standard and State-of-the-art Firefighter Coats on Postural Balance and Gait in a Live Burn Environment
- Investigating the Integration of Telemedicine into Clinicians Workflow: A Review of Methods
- Risk Assessment of Ergonomic Factors in a Textile Firm by RULA, REBA and Fine Kinney Methods
- Impact of Self-Esteem Training on Individuals with Disabilities Aged 17-30