The Comparison of Anthropometrical, Body Structural and Physical Fitness Parameters in Female Athletes and Non-Athletes Student
The purpose of this study was to compare some of anthropometrical, body structural and physical fitness factors in athletes and non-athletes female students. The sample included40 elite athletes (volleyball, N=20, age: 21.5±2.6 and futsal, N=20, age: 21.3±1.25) and also 20 students as non-athletes (N=20, age: 20.5±1.72). The data including: height, weight, waist and hip circumference, body fat percentage, thoracic Kyphosis and lumbar Lordosis curvatures angles, leg muscle strength, cardiopulmonary fitness, flexibility and navicular drop index were evaluated using by standard methods. Statistical analysis using ANOVA and Kruskal-Wallis test were used and the significant level set asp≤0.05. The results showed that volleyball players had lesser body fat percent and more muscle mass than the other two groups. The futsal players indicated lesser Lordosis angle than to other groups. Furthermore, leg muscle power, flexibility and cardio respiratory fitness of futsal players was significantly higher than others. In conjunction with BMI, WHR, Kyphosis angle and Navicular Drop Index, there was no significant difference among three groups. According to the results of the present study is the regular exercise such as volleyball and futsal could improve health-related fitness factors. Moreover, elite athletes with showed better body position as lower Kyphosis and Lordosis angles as compared to non-athletes. Considering the importance of general health status and to improve the quality of life, create sports programs for non-physical education students should be designed on the agenda of university officials.
Introduction
Throughout human history, power, physical endurance, along with psychological courage has been the greatest factor in human's success in the battlefield and survival. As well as, movement, the most basic elements of human life, has important role in public growth, especially in mental and motor development [1]. What underlies all human motor activities is the physical fitness. Fitness not only helps us to do basic sports but also is effective in learning exercise skills [2]. Decreased physical activity, in addition to obesity, cause other diseases, especially in middle and old age. American Heart Association which announced for years risk factors of cardiovascular disease are three: smoking, high blood pressure and high cholesterol levels, however now avers less physical activity is other risk factor that is modifiable through changes in lifestyle. Physical activity not only is effective in reducing the incidence of heart disease, but also is effective on incidence of physical illnesses and psychological disorders such as high blood pressure, osteoporosis, breast and colon cancer, depression, anxiety and stress. The researchers showed that the level of anxiety in male students has direct relate with increasing BMI (Body Mass Index) and inversely related to cardiovascular fitness while in female students only is related to cardio-vascular [3]. With regard to the development of technology, people's everyday activities largely limited and this factor causes cardiovascular accidents to become the second cause of death after traffic accidents. This issue is more important in multinational jobs, including academic jobs. On the other hand, youth is the time that many risky diseases of middle and old age arises from it, so a student should be in addition to knowing enough about the effects of physical activity appropriate, have enough mobility as well. Due to this, planning to increase the level of physical fitness and physical activity at the community level seems necessary. How much is the effect of students' current training program on increasing their physical activity or physical fitness is the subject of different studies, but for proper planning need to be examined regularly [3]. Josephine and Lorenz in a study in 2011 on young students, reported that prevalence of the amount of overweight and risk factors for heart disease are down and on the other hand, they did not observe any relationship between the weight and level of physical activity [4]. While Moghaddam, et al. by studying high school female students in 2013, showed that about half of high school girls were physically inactive and were in the category of overweight and obesity. In other words, reduced physical activity was associated with increased weight [5, 6]. However, the level of physical fitness is an accurate measure of true of person's lifestyle but the body composition also can indirectly indicate their level of physical activity and lifestyle. So because of various Ilbeigi S, et al. The Comparison of Anthropometrical, Body Structural and Physical Fitness Parameters in Female Athletes and Non-Athletes Student. Ergonomics Int J 2018, 2(2): 000142.
contradictions in the past literature and the importance of health keeping in female students because of the responsibilities of later life, such as attending classes on the one hand and on the other hand parenting as well as because the general health status of students is one of the most important issues in each university and must regularly and objectively be evaluated on the agenda of officials, researchers and health professionals at the university level, the present study aimed to assess physical condition of female students and compare them in terms of athlete or non-athlete, and was conducted to evaluate the effect of physical activity on this factors in order to be able to provide accurate information about the student's physical fitness, for planners, due to the ease of measuring the composition and structure of body and its high ability to prevent risks threatening wellness.
Methodology
This study target was to compare anthropometrical, body structure and physical fitness parameters of female athlete and non-athlete students. In the present study, causal-comparative, and is a fieldwork, a number of factors, including physical fitness, body composition (Body mass index, waist-to-hip ratio (WHR), percentage of fat and the amount of muscle mass), Cardiorespiratory fitness, flexibility and strength (foot back muscle strength) as well as the physical structure (Arch the back, lumbar lordosis and drop navicular) were measured and evaluated in the students. Statistical population and sample size: According to the purpose of the test, the statistical population was determined separately for both athletic and non-athlete groups. The population of athletes, were considered all female students of the university, aged 19 to 25, who regularly participated in various training sport. The population of non-athletes also were 19- to 25-year-old, all were considered female and students of different majors (Except for physical education), which during the academic year of 2014-2015 passed the Physical Education Unit 1 (Physical fitness). For statistical samples of athletes' group, 40 athletes from Volleyball (20 people) and futsal (20 people), who were the champions of the 3rd country competition and participated in the expedition exercise for the Student Sport Olympiad, were selected purposefully. For statistical sample of non- athlete group, individuals who did not have regular sporting history and not participated in sporting events were identified among the subjects, and 20 of them were randomly selected from the inactive persons. The criteria for entering the test for both groups was complete physical health. Measurement method: In this study to measure body mass index, subjects' weight with light clothing, no shoes was measured by a digital scale with a precision of 0.1 kg. The person's height was measured without shoes while the feet were stick together and legs, shoulders and head from back connected to the height meter. For each study, the body mass index was calculated as the ratio of weight in kilograms to square of height in square meters [7]. After measuring waist circumference and hip circumference with a tape measure with a simple calculation the ratio of waist to hip circumference was obtained [7]. Moreover, to evaluate the readiness of cardiopulmonary test strips Quinn has been used and maximum oxygen consumption per person was calculated using the following formula [8]: (Heart rate after test × 0. 1847) – 65.81 = Maximal oxygen consumption (ml/kl / minute) To determine foot back muscle strength, digital dynamometer and flexibility box and sit and reach test were used to measure lumbar flexion [9]. Navy bone drop approach was used to measure the structure of the foot [10]. To assess the students' physical structure, the flexible ruler technique was used to measure the waist arch (Lordosis and Kyphosis); in this technique, the subject was asked to be placed in a state of standing and completely comfortable fit with the naked leg on a cardboard site where the feet were positioned, then asked him to open his legs wide as the same as his shoulder and look up. Then the tester placed behind the subject to find reference points. These points included spinal dorsal, lumbar and sacral. To determine the arc, the back second and twelfth vertebrae were marked. This means that the person was asked to bend his neck a few. With seven cervical vertebrae (C7) that stands out and counting the vertebrae, the second dorsal vertebrae (T2) identified and marked. The tester then finds the latest gear and in parallel with the ground approaches his thumbs from the sides toward the middle of the back. The specified location (T12) will be 12 dorsal vertebrae. The flexible ruler then is placed between the two marks on the ruler into the same pressure to be no space between the ruler and the subjects skin and ruler take shape of the behind arc. Then the ruler will be taken from the subject's back, and without changing the curve on it, is drawn on a paper. The tester then would clear symptoms and after one minute rest for the subject, asked him to return to the Ilbeigi S, et al. The Comparison of Anthropometrical, Body Structural and Physical Fitness Parameters in Female Athletes and Non-Athletes Student. Ergonomics Int J 2018, 2(2): 000142.
specified location with the explained state in order to do the measurement in the same way again. This procedure was performed on each subject three times and their average was recorded. Then through the formula θ arc tan , the curvature of the back of the subjects was calculated. In this formula, the curve (L) represents the distance between the second to twelfth thoracic vertebra and the height of the curve is vertical line (H) that has the greatest distance from the line L. Lordosis measurement was conducted like kyphosis with the difference that for the location of the flexible ruler, the first lumbar vertebra (L1) to the second lumbar sacral (S2 ) was identified and marked. To measure the percentage of body fat, the right side of body and the amount of subcutaneous fat in arm triceps, the scapular and pelvic edge of subjects were used. To determine the point in the triceps area of the arm, the length of bone of the right arm that makes a 90-degree angle with the forearm was measured and half of that size was marked on the back of the arm. Then by the thumb and index finger (one cm above that point) the skin was separated from the muscle and the person was asked to hang his hand. Measuring the diameter of the skin, was performed in this case using calipers Japanese Harpenthal. After two seconds, the recorded size was recorded on a graduated caliper screen. This was repeated three times and an average of three times was recorded. To measure subcutaneous fat under the mitochondria, the person was asked to take his hand while had a 90-degree angle with the elbow. At this time the inferior angle of the scapula outstanding, was marked. Then, subject hand was placed free beside of the body and the subcutaneous fat was measured as described above. For the measurement of subcutaneous fat of the above of the iliac crest of the pelvis, after specifying the size of pelvic crown, 2 cm above that was marked diagonally and then measurement was performed by calipers in the same way as mentioned above. After measuring the subcutaneous fat of three points of arm triceps, under the scapular and pelvic edge of the right side of the person, body fat percentage of each sample was calculated using Jackson and Pollock equation, respectively [11]:
Body fat percentage = [(4.95 / Db) - 4.5] × 100 In this relation: Db = 1.099421 - (0.0009929 × S) + (0.0000023 × S2) - (0.0001392 × age) And S = the total thickness of subcutaneous fat triceps and sub scapular pelvis and under After obtaining fat percentage, multiplying the resulting number in the person's weight will yield the body fat. Subtracting body weight and fat weight will yield muscle mass (lean body weight (LBM)). Statistical method: To describe the data obtained from this study, descriptive statistics such as mean, standard deviation, and frequency were used and the normality of data distribution was examined using Shapiro-Wilk test then comparisons were analyzed by using the tests one- way analysis of variance and Kruskal-Wallis, and by the software SPSS edition 20. And required charts were drawn in Excel. The significance level was considered p ≥ 0.05.
percentage of fat. The percentage of body fat in futsal and volleyball players is not significantly different. The strength of the leg muscles and the cardiovascular fitness of the futsal group are the highest and the non-athlete group has the lowest. Volleyball and futsal difference between these groups was not significant. It also shows that there is no significant difference between the ratio of waist to hips and rear arc angle of these groups of students. But there is a significant difference between the muscle mass, lumbar lordosis angle and flexibility of these groups of students. Volleyball players have the highest and non-athlete groups have the lowest amount of muscle mass. According to Table 3 and the follow-up test, the differences between muscle mass of futsal and Futsal- Volleyball had no significance, but the difference between the two groups of Futsal – non athletes was significant. In the case of the difference between the lumbar lordosis angles, table 3 shows its difference just in the two groups of Futsal-non athletes was significant. As well as flexibility between groups of Volleyball- non-athletes and Futsal- non athletes is significant and the difference between the two groups of Futsal-Volleyball was not significant. It also shows that the difference of the percentage of body fat, leg muscle strength and cardiopulmonary fitness and between volleyball-non athletes and futsal-non athletes is significant.
Results
Table 1 shows the demographic characteristics of each group and the number of people participated in the test. Table 2 shows that there is no significant difference between the body mass index and navicular drop index among three groups of students. But the percentage of fat, leg muscle strength and cardio pulmonary fitness of students vary in three groups: volleyball, futsal and non- athletes. Volleyball players have the lowest percentage of body fat and non-athlete group have the highest
| Volleyball players | Futsal players | Non-athletes | |||||||
|---|---|---|---|---|---|---|---|---|---|
| Number | 20 | 20 | 20 | ||||||
| Age | 36.2±10.21 | 30.21±52.1 | 7.19±03.1 | ||||||
| Height (cm) | 65.164±20.6 | 48.160±84.3 | 60.158±44.5 | ||||||
| Weight (kg) | 63.58±30.10 | 73.53±65.7 | 03.53±39.9 |
Table 1: Results of the statistical tests for variables BMI, body fat percentage, leg muscle strength index navicular drop, cardi
- Variable volleyball player
- Futsal player
- Non-athlete the amount of P
- BMI (kg / m2)
- 21.59 ± 3.65
- 20.85±2.8
- 21.05±2.26
- 0.96
- Body fat percentage
- 18.75 ± 5.23
- 18.90 ± 4.21
- 22.1±5.12
- 0.03*
- Leg muscle strength (N)
- 33.52±17.15
- 34.77±24.45
- 20.64±9.22
- 0.04* navicular drop index (cm)
- 5.65±2.34
- 5.95±3
- 6.4±2.89
- 0.81
- Cardio Pulmonary Readiness g in
- ⁄
- 42.33±3.26
- 43.15±3.46
- 35.65±4.84
- 0.0001*
- WHR
- 0.73±0.05
- 0.74±0.04
- 0.71±0.04
- 0.13
- Lean body mass (Kg)
- 47.22±6.19
- 43.41±5.79
- 42.23±5.42
- 0.02*
- Kyphosis (degree)
- 0.62±0.26
- 0.66±0.23
- 0.60±0.16
- 0.71
- Lordosis (degree)
- 0.94±0.34
- 0.89±0.29
- 1.11±0.19
- 0.04*
- Flexibility (cm)
- 26.65±8.21
- 28.52±10.10
- 19.80±7.90
- 0.007*
- Variable group the amount of P
- Volleyball - Futsal
- 0.71
- Volleyball- non-athlete
- 0.02*
- Futsal - non-athlete
- 0.03*
- Body fat percentage
- Volleyball - Futsal
- 0.62
- Volleyball- non-athlete
- 0.01*
- Futsal - non-athlete
- 0.08*
- Leg muscle strength (N)
- Volleyball - Futsal
- 0.54
- Volleyball- non-athlete
- 0.0001*
- Futsal - non-athlete
- 0.0001*
- Cardiorespiratory fitness
- ( g in
- ⁄
- Volleyball - Futsal
- 0.10
- Volleyball-non-athlete
- 0.02*
- Futsal - non-athlete
- 0.79
- Lean body mass (Kg)
- Volleyball - Futsal
- 0.84
- Volleyball- non-athlete
- 0.15
- Futsal - non-athlete
- 0.04* lordosis (degrees)
- Volleyball - Futsal
- 0.77
- Volleyball- non-athlete
- 0.04*
- Futsal- non-athlete
- 0.008*
- Flexibility (cm)
Table 2: Results of the statistical tests for variables BMI, body fat percentage, leg muscle strength index navicular
Ilbeigi S, et al. The Comparison of Anthropometrical, Body Structural and Physical Fitness Parameters in Female Athletes and Non-Athletes Student. Ergonomics Int J 2018, 2(2): 000142.
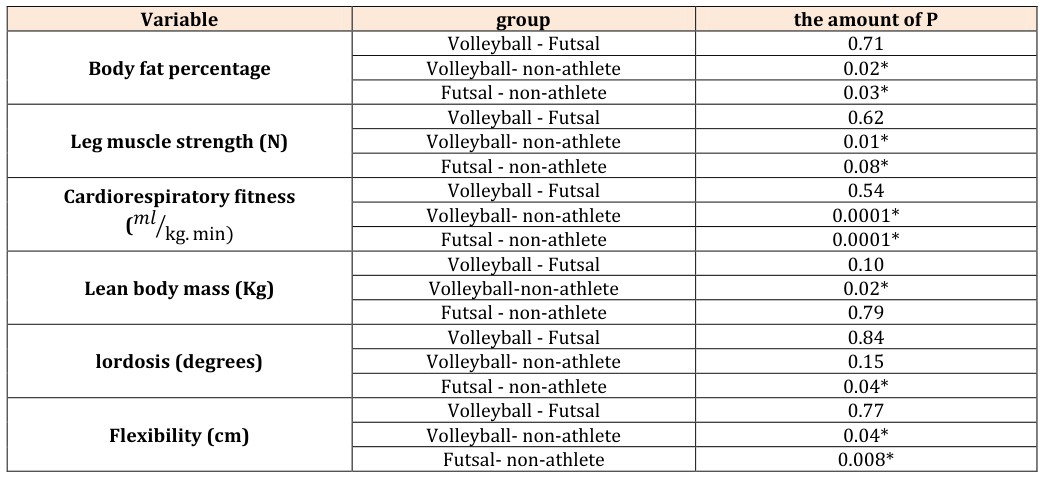
This study aimed to compare some factors including anthropometrical, body structure and physical fitness among female athlete and non-athlete students. According to the research results in relation to a number of factors of health-related physical fitness including: body composition (BMI, WHR, body fat percentage, muscle mass), leg muscle strength, flexibility and cardio- pulmonary fitness and body situation items including: arc angle of the back (kyphosis), the angle of lumbar lordosis (lordosis) and navicular drop index, it must be noted that among the subjects of this study, there is some differences between compared groups which were significant in the case of percentage of body fat, muscle mass, leg muscle strength, flexibility, Cardiorespiratory fitness and lumbar lordosis angles. The ideal body mass index for women is between 19 and 24. People with BMI less than 19 are considered skinny, 24-30 overweight and more than 30 are obese. The waist to hip ratio for women aged 20-29 is as follows: less than 0.71 is low, 0.71-0.77 is average, 0.78-0.82 is high, and more than 0.82 is too high [7]. Results showed that students in all 3 groups are in the optimal range in terms of BMI and WHR, and being athlete did not effect on these two components. Results of this research were in consistence with the work of Moghaddam, et al. [5, 6], Ilbeigi S, et al. The Comparison of Anthropometrical, Body Structural and Physical Fitness Parameters in Female Athletes and Non-Athletes Student. Ergonomics Int J 2018, 2(2): 000142.
Arab-Ameri et al. [12], Ferreira Marinho, et al. [13] and were in line with studies of Aires, et al. [14] and were the counter of Hojjati and Alipur [15] and Ara, et al. [16] investigations. This study showed that although the body mass index and waist-to-hip ratio are of reliable indicators in measuring body composition, but they cannot be the most accurate measurement indicators. In other words, it can be stated that using other methods to estimate body composition is also likely to change the results. As in the present study it was observed that by estimating the percentage of body fat mass and muscle mass there is a significant difference between athletes and non-athletes. As Fayyaz, et al. [17] as a result of their research, stated that the level of person physical activity was related with all anthropometric parameters such as weight, height, lean mass, fat mass, the ratio of waist to hips and percentage of body fat, but its association with body mass index were not significant. In relation to body fat percentage also results of this study showed that the majority of subjects in volleyball, indoor soccer and non-athletes groups were in excellent or very good range, according to the percentage of fat in the age 19 to 24 years. But the students' body fat in both volleyball and futsal were significantly lower than non- athletes group and consequently the amount of muscle mass for athlete students were significantly higher than non-athletes. Among the group of athletes also, Volleyball
group had less fat percent and more muscle mass compared to futsal's. These results were in line with the most researches accomplished by Aminian Razavi, et al. [18], Gharakhanlou, et al. [19], Grabara [20], Marinhoet al. and were in counter with Fazelkalkhoran, et al. [21], Moghaddam, et al. [6] and Gayini, et al. [22]. Also, the mean of kyphosis angle in Volleyball players was 0.62, in futsal players was 0.66 and in non-athlete players was 0.60. In other words, the angle of kyphosis in futsal players were more than volleyball players and volleyball players' kyphosis angle were greater than non- athletes. However, this difference was not statistically significant. According to researches, the natural kyphosis is variable, but in desired range of 50-20 degrees and more than 50 degrees is abnormal [23]. This study showed that all subjects' kyphosis angle is more than normal. Asadi Ghale Ni, et al. [24] stated that kyphosis angle in non-athletes and footballers were significantly less than that of volleyball players which was in counter with present study. Perhaps this difference was due to gender and age of the subjects because Asadi and others' research was done on 45-60-year-old man veteran volleyball players. This difference may also be because of the kind of the measurement tool. Because unlike this study, in the research of Asadi and others, spinal mouse was used to measure the angle of kyphosis and lordosis. Also this study wasnot in line with the study of Sheikh Zadeh, et al. [25], Rahnama, et al. [26], Hosseini and Sadeghi [27], Krenta, et al. [28], Lichota, et al. [29], Grabara & Hadzik [30]. But research of Andam [31], Grabara [20] was consistent with the findings of this research. The results of this study showed that there is a significant difference between the lordosis angle of the three groups of volleyball players, futsal players and non- athletes. The mean lordosis angle of the volleyball players was 0.49, futsal players was 0.90 and was 1.11 for non- athletes, indicating that the lordosis angle of all the three groups was higher than normal, but this difference was higher in the non-athlete group than in other groups. Research from Gerabra and Hadzik [30] is also consistent with this research. They said volleyball players had lower waist arches than non-athletes. However, the research of Asadi Ghale Ni and others [24], Grabara [32], Kishali, et al. [33] and Sharifian, et al. (1999) [34] were not the same with our results. Perhaps because Birjand University players in the futsal and volleyball had fewer sporting record, as earlier studies mostly used elite players and national team players. Also, that many studies have been Ilbeigi S, et al. The Comparison of Anthropometrical, Body Structural and Physical Fitness Parameters in Female Athletes and Non-Athletes Student. Ergonomics Int J 2018, 2(2): 000142.
done on boys could be a reason for the difference between this research and previous researches. Regarding the results, it was observed that the strength of the muscles of the athlete students was more than non- athlete (20.647) and in the athletes; the strength of the futsal players (34.770) was more than the volleyball players (33.523). In fact, the present study showed that exercise improves the muscle strength of the athlete's legs, and the greater strength of the muscles of the futsal players is probably due to the types of exercises and the more use of legs during the play and doing the various movements of this sport will lead to increased power of leg muscles. Most of previous studies also emphasized that exercise improves the muscle strength of body, which is here referred to as a few studies. Grant et al. [9] stated that grip power in female climbers was more than of female recreational climbers and non-climbers. Sohanyan Hghighi, et al. [35] in their study concluded that there is a significant difference between relative strength of the legs of experienced weight lifters and non-athletes. Bizheh and Hatef [36] in their study stated that there is a significant difference between the average strength of hamstring and high quadriceps muscles interest in favor of taekwondo. The results of the present study showed that in the case of navicular drop index, the three groups had normal footprint and exercise had no effect on the structure of the foot. According to the researcher's knowledge, in any research, the index of navicular drop and the type of footprint of athletes of different sporting disciplines have not been studied or compared between the athlete's foot with non-athlete. In the present study, the mean flexibility of athletes was significantly higher than non-athlete subjects (19.8). The average of futsal players (28.5%) also is more than volleyball players (26.6%). Perhaps the reason for the lesser flexibility of volleyball players than futsal players in this study is because of the greater muscle size of the volleyball team. Nabavi and Khaledan [37], by examining the changes in physical fitness of children and young boys participating in special football classes, showed that the selected football exercises had a significant effect on agility, abdominal of endurance muscles and flexibility of subjects, which was in line with the present study. But Pourkani, et al. [38] stated that body flexibility in the group of body building athletes was significantly less than that of non-athletes. The difference between the researches with other studies likely is due to the type of sport and the increase in muscle mass in the body of body building athletes, which is not consistent with the current study, but can justify the lower level of flexibility of the volleyball team [39, 40, 41]. The results of the present study showed that athletes had higher cardio pulmonary readiness than non-athlete and among them Futsal group showed higher cardio pulmonary readiness. Although the difference in cardio pulmonary readiness between volleyball group (42.33) and futsal group (43.15) is negligible, but this difference may be due to the type of training of the futsal group and more than aerobic training in futsal. This study about the cardio pulmonary readiness of athlete and non-athlete was in line with the results of most researches including Haji Nia, et al. [42], Jacquelyn et al. and Gonzalez-Suarez and Grimmer-Somers [43]. But Armstrong, et al. [44] did not observe a significant relationship between aerobic fitness and activity levels. That was inconsistent with the current study.
Conclusion
In general, in most studies in and outside the country, it has been emphasized that physical activity improves the components of physical fitness related to health and well- being. The present study also shows that exercise and physical activity can directly affect people's health related factors. Although this study showed that non-athletic students of Birjand University are in favorable condition for some body composition indices such as BMI and WHR, they are not in desirable position in terms of fat percentage and physical fitness characteristics. Therefore, encouraging students, especially girls, to have physical activity and to provide suitable facilities for exercise and mobility can ensure the improvement of the health and well-being of individuals. On the other hand, this study showed that although athletes and non-athletes did not have a normal back and lumbar arc angle, however exercise was able to some extent affect these abnormalities, and, as it can be seen, athletes are in a relatively better position than non-athletes. However, given that all individuals had abnormal back and wrist arc, necessary actions must be performed to correct those and prevent the exacerbation of these abnormalities.
Appreciation
Based on the master's thesis on sport physiology, this article is written instructing by Dr. SaeedIlbeigi and Dr. Mohammad Esmaeel Afzalpur. We are grateful to all the Ilbeigi S, et al. The Comparison of Anthropometrical, Body Structural and Physical Fitness Parameters in Female Athletes and Non-Athletes Student. Ergonomics Int J 2018, 2(2): 000142.
students and staff of the Sports Sciences Department in University of Birjand who helped us with this research.
References
-
Pouyanfard A (1994) Determination National fitness norms for students 9 to 17 years for a PhD thesis, Islamic Azad University of Tehran.
-
Esmaeil zadeh KH (1998) Assessment of the level of physical Magy teams dispatched to the third son of Tehran Universities Student Olympiad. Master's dissertation, Tehran University.
-
Ziaee V, Fallah J, Rezaee M, Biat A (2007) Relationship between body mass index and physical fitness in 513 medical students. Tehran University of Medical Sciences 65(8): 79-84.
-
Josephinjoy B, Lorenz M (2011) Health Risks determinants among freshmen students of the university of Santo Tomas. International Journal of Sport Science and Engineering 1: 58-64.
-
Moqadam M, Mahdi Zadeh S, Pakpour V, Heydari N, Afshinjoo M (2013) Check the status of obesity and its association with physical activity in West of Tehran in 1387. Adolescent Preventive Care in Nursing & Midwifery 3(1): 46-55.
-
Moqadam M, Hajikazemi A, Rouzbeh F, Hoshyar Rad A, Hosseini A (2011) Relationship between Physical activity and Triceps skin fold with high school girls. College of Nursing and Midwifery, Tehran University of Medical Sciences 24(69): 62-68.
-
Hadavi F, Ezadi A, Farahani A (2013) Measurement, assessment and evaluation in physical education. Hatmi Press, Tehran.
-
Hematinejad M, Rahmanienia F, Hematinejad M, Tayebi M (2009) Measurement and evaluation in physical education and application of SPSS software. Asr Entezar, Tehran.
-
Grant S, Hasler T, Davies C, Aitchison TC, Wilson J, et al. (2001) A comparison of the anthropometric, strength, endurance and flexibility characteristics of female elite and recreational climbers and non- climbers. Journal of sport sciences 19(7): 499-505.
-
Brody DM (1982) Techniques in the evaluation and treatment of the injured runner. Orthop Clin North Am 13(3): 541-558.
-
Mehrbani J, RahmaniNia F (2008) Physical activity, fitness and wellbeing. Mobtakeran Press (Persian), Tehran.
-
Arab Ameri E, Ehsani Sh, Dehkhoda MR, Sayyah M (2010) The relationship between general health, depression, body mass index male and female athletes and non-athletes Tehran University. Growth and learning exercises 3: 83-97.
-
Ferreira Marinho B, Vidal Andreato L, Follmer B, Franchini E ( 2016) Comparison of body composition and physical fitness in elite and non-elite Brazilian jiu-jitsu athleles. Science & sport 12(1): 1-6.
-
Aires L, Silva P, Silva G, Santos MP, Ribeiro JC, et al. (2010) Intensity of physical activity, cardiorespiratory fitness, and body mass index in youth. J Phys Act Health 7(1): 54-59.
-
Hojjati Z, Alipour V (2014) Relationship between physical activity and anthropometric indices related to the health of women employees. Hormozgan Medical Journal 18(2): 159-167.
-
Ara I, Moreno LA, Leiva MT, Gutin B, Casajús JA (2007) Adiposity, physical activity, and physical fitness among children from Aragon, Spain. Obesity (Silver Spring, Md) 15(8): 1918-1924.
-
Fayyaz E, Mohebi, H, Damirchi A (2011) Levels of physical activity, calcium intake, sources of calcium and anthropometric indices in young college women. Journal of Endocrinology and Metabolism. Nectar Beheshti University of Medical Sciences and Health Services 13(6): 679-704.
-
Aminiyan Razavi T, Ravasi AA, Soheili Sh, Souri R (2005) Review and compare body composition and physical factors in elite wrestlers with non-athletes. Motion Magazine 20: 5-14.
-
Gharakhanloo R, Safari F, Abbaspour M (2001) Comparison of blood fat, subcutaneous fat percentage and the relationship between athletes and non- athletes are students aged 15 to 18 years. Olympic Journal 8(3): 41-52. Ilbeigi S, et al. The Comparison of Anthropometrical, Body Structural and Physical Fitness Parameters in Female Athletes and Non-Athletes Student. Ergonomics Int J 2018, 2(2): 000142.
-
Grabara M (2015) Comparison of posture among adolescent male volleyball players and non-athletes. Biology of sport 32(1): 79-85.
-
FazelKalkhoran J, Abasgholipour A, Qaredaqi N (2011) The effects of inactivity on the psychological aspects (self-esteem) and physical (body fat mass) male and female students at Tehran University. Growth and learning exercises 7: 129-145.
-
Gaeeni A, Arazi H, Yousefi M (2011) Standardization body fat percentage athletic and non athletic teenage boys in Tehran. Journal of metabolism and physical activity 1(1): 79-89.
-
Mobini B, Ameri E, Behtash H, Ghandehari H, Khaki nahad M (2009) Treatment of kyphosis "Status" Adolescents with Milwaukee brace. Iranian Journal of Orthopedic Surgery 7(2): 52-57.
-
Asadi Ghalehney M, Bahiraei S, Daneshmandi H, Norasteh AA (2016) The comparison of head, shoulder, and spine in veteran soccer and volleyball players and non-athletes. J Rehab Med 5(2): 173-183.
-
Sheikh Zadeh M, Sadeqi H, Shojaee F (2013) Compare the main indices anthropometric, biomechanical, physiological, psychological and postural status, musculoskeletal and women's soccer, women's national team athletes. Master's thesis, Islamic Azad University Central Tehran Branch, Faculty of Physical Education and Sport Sciences.
-
Rahnama N, Bambaeichi E, Baqerian S, NejadRomzi S (2012) Compare the curves of the spine triple- conservatives and non-athletes. Journal of Medical School 30(196): 948-957.
-
Hossieni M, Sadeqi H (2011) Compare features anthropometric and biomechanical skeletal abnormalities athletic and non athletic women 18 to 35 years. Master's thesis. Payam Noor University of Tehran.
-
Krneta Z, Protic Gava B, Vukovic M, Sc'epanovic' T (2012) A comparative analysis of the postural status of young girls volleyball players from Vojvodina and their peers. Physical education and sport 10(4): 311- 318.
-
Lichota M, Plandowska M, Mil P (2011) The shape of anterior- posterior curvatures of the spine in athletes practicing selected sports. Pol J sport tourism 18(2): 112-121.
-
Grabara M, Hadzic A (2009) Postural variables in girls practicing volleyball. Biomedical human kinetic 1: 67- 71.
-
Andam R, Alizadeh MH, Bayat M (1999) Comparative evaluation of the situation round in men's volleyball and soccer city by offering Aslahy- move anymore. MA thesis, Tehran University, Faculty of Physical Education and Sport Sciences.
-
Grabara M (2012) Analysis of body posture between young football players and their untrained peers. Human movement 13(2): 120-126.
-
Kishali NF, Imamoglu O, Burmaoglu G, Atan T, Yildirim K (2004) Q-angle values of elite soccer and taekwondo athletes. The pain clinic 16(1): 27-33.
-
Sharifian E, Alizadeh MH, Khabiri M (1999) Study of Relationship between flexibility hamstring and lumbar spine curvature athletes and non-athletes. Olympic Journal 73-78.
-
Sohanian Haqiai AH, Ravasi AA, AimianRazavi T (1997) Review and compare body composition, strength, VO2max and anaerobic power elite lifters with non-athletes. Master's thesis (Persian).
-
Bizheh N, Hatef H (2008) Evaluation of bone mineral density (BMD) and strength in women's taekwondo and athletes. Research in Sport Sciences 6(19): 85-96.
-
Nabavi M, Khaledan A (2004) The effect on the Awali soccer fitness training program of 11- 17-year-old boys. Movement Magazine 22(22): 87-104.
-
Pour kiani M, Mohammadi A, Sabaqian Rad S (2014) Comparison of active and passive range of motion and stability of the trunk in men. Journal of Research in the Life Sciences sport 3(12): 59-76.
-
Basak S, Dutta S (2016) A comparative study of physical fitness parameters between general college students and training college students. International Journal of experimental research and review (IJERR) 4: 26-30.
-
Kulinski JP, Khera A, Ayers CR, Das SR, de Lemos JA, et al. (2014) Association Between Cardiorespiratory Fitness and Accelerometer-Derived Physical Activity and Sedentary Time in the General Population. Mayo Clinic Proceedings 89(8): 1063-1071.
-
Lundon KM, Li AM, Bibershtein S (1998) Interrater and intratter reliability in the measurement of Kyphosis in postmenopausal women with osteoporosis. Spine 23(18): 1978-1985.
-
Haji nia M, Hamedinia MR, Haqiqi AH, Davarzani Z (2013) Cardiovascular fitness and physical activity level and obesity and the pattern of changes in boys 12 to 16 years. Journal of Endocrinology and Metabolism. Martyr Beheshti University of Medical Sciences and Health Services 15(2): 143-151.
-
Gonzalez-Suarez CB, Grimmer-Somers K (2011) The Association of Physical Activity and Physical Fitness with Pre-Adolescent Obesity: An Observational Study in Metromanila, Philippines. Journal of Physical Activity and Health 8(6): 804-810.
-
Armstrong N, Tomkinson G, Ekelund U (2011) Aerobic fitness and its relationship to sport, exercise training and habitual physical activity during youth. Br J Sports Med 45(11): 849-858. Ilbeigi S, et al. The Comparison of Anthropometrical, Body Structural and Physical Fitness Parameters in Female Athletes and Non-Athletes Student. Ergonomics Int J 2018, 2(2): 000142.
- The Expanding Landscape of Road Rage: A Systematic Review of Conflicts Involving Drivers, Pedestrians, and Micromobility
- Validating Cognitive Models of Royal Navy Performance on Control Systems
- Comparing Standard and State-of-the-art Firefighter Coats on Postural Balance and Gait in a Live Burn Environment
- Investigating the Integration of Telemedicine into Clinicians Workflow: A Review of Methods
- Risk Assessment of Ergonomic Factors in a Textile Firm by RULA, REBA and Fine Kinney Methods
- Impact of Self-Esteem Training on Individuals with Disabilities Aged 17-30