An Effective Visual Method for Information Tracking System on Automotive Head-Up Display
To provide various functions such as an in-vehicle information system, in-vehicle displays are continuously becoming larger. The head-up display, which shows information on windshields, has entered the spotlight. While in the past, in-vehicle head-up displays showed simple information including driving speed and distance between cars, they recently started displaying complex information including advanced driver assistance information. Therefore, tracking tasks are required to search for information on the head-up display, similar to the menu navigation of in-vehicle information systems. Tracking tasks are controlled by multiple controllers of the driving information system. This study aimed to identify the effects of three levels of visual enhancements, including no visual enhancement, shaded reference bar, and translucent reference bar, on the information search.
Introduction
In the development of vehicle technology, the vehicle as a means of transportation had changed to intelligent vehicles that offer space for business, rest, and entertainment [1]. Studies on intelligent vehicles focused on two functional aspects: driving safety and the display of information on driving. To provide these functions, technologies such as the adaptive driver assistance system (ADAS), which help drivers to drive safely, and the in-vehicle information system (IVIS), which represents driving information in vehicle, have been greatly improved.
With the increasing amount of in-vehicle information offered to drivers, efforts to provide information using IVIS have progressed. IVIS was first developed as a driving information system (DIS), which displayed the vehicle’s information for the driver. As the amount of information provided has gradually increased, the IVIS was enhanced to an integrated information system, which is an information display that includes navigation, ventilation, telemetric service, and infotainment [2]. Even though such IVIS could help improve convenience and safety for the driver, much of the information has contributed to the workload on and distraction of the driver. Therefore, decreasing the cognitive workload on drivers has become an important problem [3]. Goodstein [4] reported that the cognition workload of drivers aggravated when the drivers search and deduce information. The effective design and use of the information display should be introduced to reduce driver workload because aggravated cognition workload can be a critical cause of traffic accidents [5]. Furthermore, the National Highway Traffic Safety Administration [6] reported that distraction accidents account for 10% of all crashes and 10% of all fatal crashes. To reduce distraction accidents, information should be provided to drivers in the smallest range of eye movement [7]. Therefore, the automotive companies have focused on the research and development of head-up displays (HUDs). The HUD displays information on the windshield, which is the primary visual area of drivers. Consequently, it reduces the duration of the driver’s sight deviations from the road and reduces cognitive workload [8]. The purpose of this study is to investigate the effects of visual enhancements for tracking tasks of the HUD on the cognitive workload and tracking performance of drivers.
Information Display in Vehicle
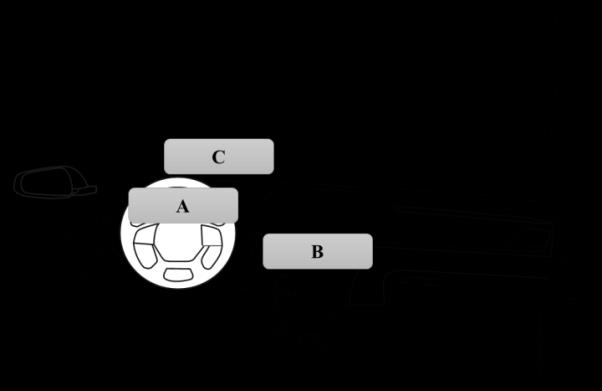
In-vehicle information displays present information ranging from simple to complex. These displays can be core factors of the human-machine interface (HMI). These information displays were classically located in center fascia, but the positions of these displays have recently become varied. Figure 1 shows the positions of the in- vehicle information display. Wittmann [9] suggested seven different display positions, but this figure shows the three commonly used display positions. The display positions are gauge cluster, center fascia, and front windshield. In addition, many studies on displays have focused on the shape of the gauge cluster, number and color of gauges, and display menu design [10, 11, 12, 13].
HUD in Vehicle
Research related to the HUD focused on the comparison among different positions and color, size, or layout of visual information. Specifically, studies on the use of HUD while driving were performed in terms of two aspects. Firstly, the information type provided on the HUD was tested in terms of the information size or color [14]. In addition, the effect of static HUD information on the driver’s visual search was verified [15]. However, the HUD information in existing vehicles is considerably restricted. Drivers cannot directly control the information displayed on HUD, which only functions as a simple indicator. With the advancement of technology for virtual and augmented reality, the information on HUD would become more diversified and complicated. The development of various input devices for automobiles also leads to these changes. Therefore, the design of an integrated controller for IVIS should be considered for conducting tracking tasks on HUDs.
Method
Participants
Four female and five male undergraduate and graduate students (aged between 26 and 39 years) participated in the experiment. The mean age of the participants was 30.22(±4.79) years. The mean driving experience of the participants was 6.44(±4.80) years. They were required to fill out a personal data form, and all were right handed with normal or corrected-to-normal vision and hearing. All the subjects read and signed a consent form before the experiment, and they were compensated for their participation. The experiment was carried out in compliance with the ethical standards for human subjects Jaekyu Park and Youngjae Im. An Effective Visual Method for Information Tracking System on Automotive Head-Up Display. Ergonomics Int J 2018, 2(2): 000143.
of the Korea National Institute for Bioethics Policy (KONIBP).
Experimental Apparatus and Environment
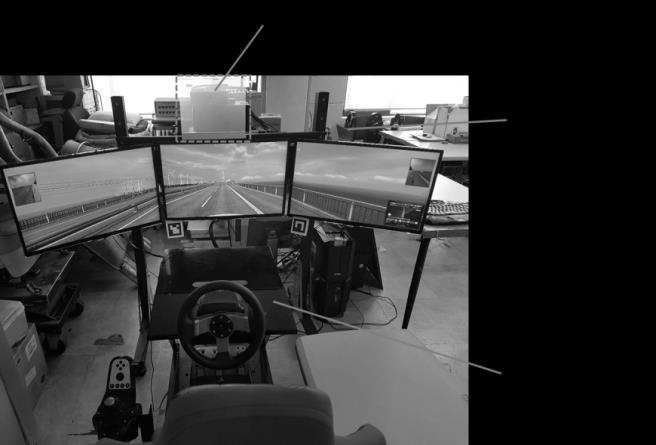
The equipment used for this experiment included a vehicle simulator, laptop computer, and Bluetooth mouse. The vehicle simulator included a desktop computer, three 27" monitors, a Logitech G27 steering wheel, pedals and gears, and a PNS GTs Plus seat buck. The desktop computer was equipped with an Intel i5 4460 processor with a frequency of 3.20 Hz. Euro Truck simulator II was used for the driving simulation task. The resolution of each display was 1680 × 1050, and the total combined resolution of all displays was 5040 × 1050. The HUD included a laptop computer, a 210 × 148 mm transparent acrylic board attached with a rear projection film, and an LG BX327 3D projector. The laptop computer was equipped with an Intel i3 processor with a frequency of 2.80 GHz. The sampling rate for data acquisition was 10 Hz. The indicator display of the HUD for the tracking task was simulated using Visual C++ 6.0 programming language. The experimental task was to control the cursor position with a mouse to pursue the motion of a horizontal bar on the indicator display. A HUD was installed on the vehicle simulator to measure the movement time required for control by tracking a horizontal bar provided within the indicator display. We ensured that the subjects were seated with a comfortable driving posture in the vehicle simulator environment, as shown in Figure 2.
Experimental Design
We used a within-subject factorial design with three levels of visual enhancement and three levels of task difficulty as independent measures. The visual enhancements and levels of task difficulty were the same as those used previously [16]. The three levels of visual enhancements included no visual enhancement (None), a shaded reference bar (Shade), and a translucent reference bar (Shade with line). The shaded reference bar and translucent reference bar were virtual cues overlaid on the horizontal bar of the indicator display, as shown in Figure 3. Three levels of task difficulty were established by changing the target speed (i.e., the horizontal bar on the indicator display). The difficulty of the task was adjusted to vary the participants’ workload. A preliminary study was conducted to tune the difficulty of the task. It was found that reliable changes in the difficulty level could be achieved by varying the target speed. Consequently, three difficulty levels that could be controlled by the speed of the horizontal bar were selected. The average speeds of the target for the low (Low), medium (Medium), and high difficulty (High) levels were 80, 100, and 120 pixels/s, respectively. Dependent measures included tracking errors and subjective ratings of the workload. The tracking error was defined as the total number of pixels between the target and the cursor during the task. The order of the task condition within the blocks was counter-balanced across the subjects in order to minimize the effect of learning. To measure the subjective workload, the modified Cooper- Harper (MCH) scale was used [17]. The MCH scale is a uni-dimensional scale in which a series of questions soliciting subjects’ decisions lead to a single rating. This method is an effective scale for estimating the subjective workload related to visual tasks.
![Figure 3: Three levels of task difficulty were established by changing the target speed (i.e., the horizontal bar on the indicator display). The difficulty of the task was adjusted to vary the participants’ workload. A preliminary study was conducted to tune the difficulty of the task. It was found that reliable changes in the difficulty level could be achieved by varying the target speed. Consequently, three difficulty levels that could be controlled by the speed of the horizontal bar were selected. The average speeds of the target for the low (Low), medium (Medium), and high difficulty (High) levels were 80, 100, and 120 pixels/s, respectively. Dependent measures included tracking errors and subjective ratings of the workload. The tracking error was defined as the total number of pixels between the target and the cursor during the task. The order of the task condition within the blocks was counter-balanced across the subjects in order to minimize the effect of learning. To measure the subjective workload, the modified Cooper- Harper (MCH) scale was used [17]. The MCH scale is a uni-dimensional scale in which a series of questions soliciting subjects’ decisions lead to a single rating. This method is an effective scale for estimating the subjective workload related to visual tasks.](/fulltextimages/2011/fig_3.jpeg)
From left: no visual enhancement (None), a shaded reference bar (Shade), and a translucent reference bar (Shade with line) Jaekyu Park and Youngjae Im. An Effective Visual Method for Information Tracking System on Automotive Head-Up Display. Ergonomics Int J 2018, 2(2): 000143.
Procedure
All the participants were instructed to practice the tracking task with all display configurations. The participants were instructed to maintain a minimum driving speed of 60 km/h throughout a driving simulator. After completing the exercise, experimental conditions were randomly assigned to the participants. The data from the tracking task were measured in 12 s per condition. According to NHTSA guidelines [18], the total eye-off road time should be less than or equal to 12 s; that is, the maximum controllable distraction time in driving is 12 s. After each task condition was completed, the participants were immediately asked the subjective rating Analysis of variance (ANOVA) results for visual enhancements (F(2, 16) = 3.846, p = 0.0433) and task difficulties (F(2, 16) = 14.690, p = 0.0002) showed that they had a significant effect on the tracking errors. Neither two-factor interactions nor two-factor interactions were found among all the variables (p > 0.05).
of their experience using the modified Cooper-Harper rating scale.
Results
Results of Tracking Errors
| Source | DF | SS | MS | F-Value | Pr>F | ||||||||||||
|---|---|---|---|---|---|---|---|---|---|---|---|---|---|---|---|---|---|
| Subject | 8 | 317.673 | 464.584 | ||||||||||||||
| Visual enhancement | 2 | 674.956 | 337.478 | 3.846 | 0.0433* | ||||||||||||
| Visual enhancement ×Subject | 16 | 1403.943 | 87.746 | ||||||||||||||
| Task difficulties | 2 | 601.602 | 300.801 | 14.69 | 0.0002* | ||||||||||||
| Task difficulties ×Subject | 16 | 327.628 | 20.477 | ||||||||||||||
| Visual enhancement × Task difficulties | 4 | 53.741 | 13.435 | 1.016 | 0.4137 | ||||||||||||
| Residual | 32 | 423.07 | 13.221 | ||||||||||||||
| *: significant at α=0.05 |
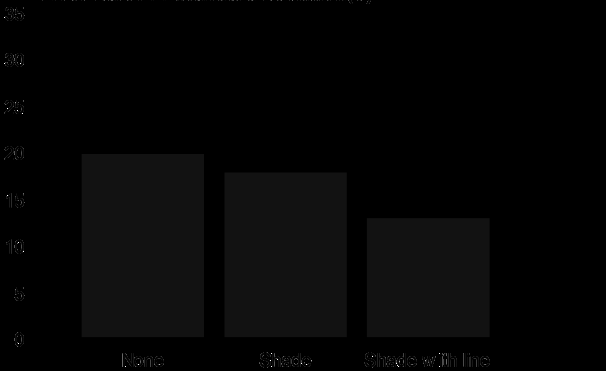
Table 1: ANOVA results for tracking errors. A comparison of the means of tracking errors for each visual-enhancement level showed
Table 1: ANOVA results for tracking errors. A comparison of the means of tracking errors for each visual-enhancement level showed that tracking errors decreased with the addition of the shadow and translucent reference bars. The result of the Student- Newman-Keuls (SNK) comparison of the means showed that they are divided into two groups (p < 0.05): group A: None, Shade; group B: Shade with line. The results imply that the translucent reference bar (Shade with line) significantly improved tracking performance. The visual enhancement cues play an important role in visual search on target location. Figure 4 shows mean tracking errors across the visual-enhancement conditions.
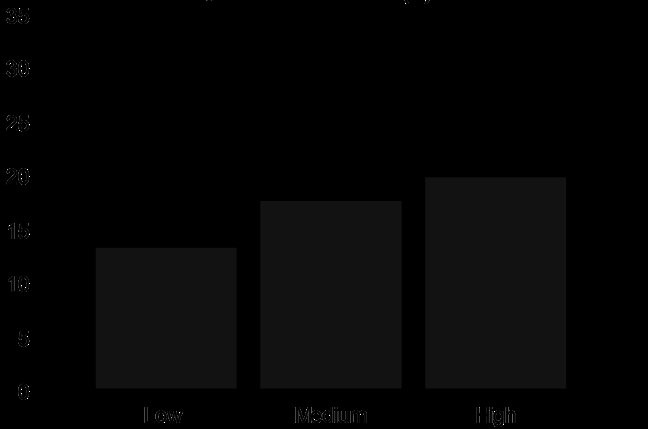
A comparison of the means of the tracking errors for each task difficulty level showed that tracking errors increased as the difficulty level was increased. The result of the Student-Newman-Keuls (SNK) comparison of the means showed that they are divided into two groups (p < 0.05): group A: Low; group B: Medium, High. Figure 5 shows the mean tracking errors across the task-difficulty conditions.
Jaekyu Park and Youngjae Im. An Effective Visual Method for Information Tracking System on Automotive Head-Up Display. Ergonomics Int J 2018, 2(2): 000143.
Results of Subjective Workload
Analysis of variance (ANOVA) results for visual enhancements (F(2, 16) = 11.146, p = 0.0009) and task difficulties (F(2, 16) = 21.058, p < 0.0001) showed that they had a significant effect on the subjective workloads as well. Neither two-factor interactions nor two-factor interactions were found among all the variables (p > 0.05).
| Source | DF | SS | MS | F-Value | Pr>F |
|---|---|---|---|---|---|
| Subject | 8 | 57.778 | 7.222 | ||
| Visual enhancement | 2 | 36.741 | 18.370 | 11.146 | 0.0009* |
| Visual enhancement ×Subject | 16 | 26.370 | 1.648 | ||
| Task difficulties | 2 | 47.185 | 23.593 | 21.058 | <0.0001* |
| Task difficulties ×Subject | 16 | 17.926 | 1.120 | ||
| Visual enhancement × Task difficulties | 4 | 0.074 | 0.019 | 0.046 | 0.9958 |
| Residual | 32 | 12.815 | 0.400 | ||
| *: significant at α=0.05 |
Table 2: ANOVA results for subjective workload. A comparison of the means of the subjective workloads for each visual-enhancement
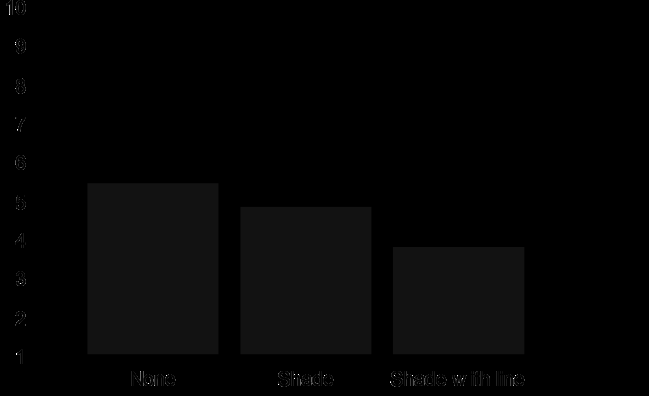
Table 2: ANOVA results for subjective workload. A comparison of the means of the subjective workloads for each visual-enhancement level showed that tracking errors decreased with the addition of the shadow and translucent reference bars. The result of the Student- Newman-Keuls (SNK) comparison of the means showed that they are divided into two groups (p < 0.05): group A: None, Shade; group B: Shade with line. The results imply that the shaded reference bar (Shade) and translucent reference bar (Shade with line) significantly decreased subjective workload. Figure 6 shows the mean subjective workloads across the visual-enhancement conditions.
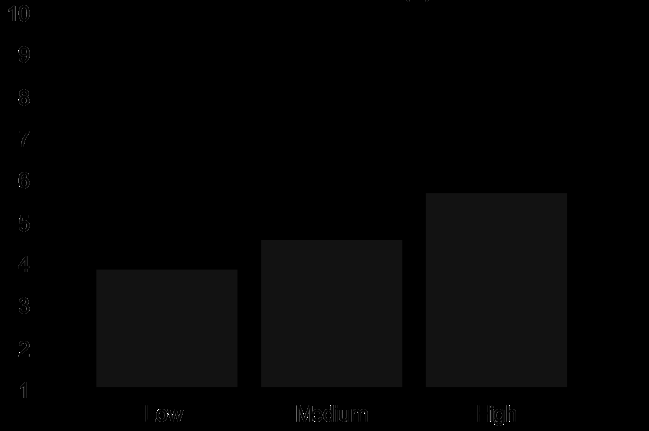
Figure 6: Means of the subjective workload for the visual-enhancement levels (Unit: score). A comparison of the means of the subjective workloads for each task difficulty level showed that tracking errors increased as the difficulty level was increased. The result of the Student-Newman-Keuls (SNK) comparison of the means showed that they are divided into three groups (p < 0.05): group A: Low; group B: Medium, group C: High. Figure 7 shows the mean tracking errors across the task- difficulty conditions.
Failure of Driving Task
We confirmed whether the driving task fails in experiments. Failure was defined as the occurrence of an accident caused by collision with another vehicle or a Jaekyu Park and Youngjae Im. An Effective Visual Method for Information Tracking System on Automotive Head-Up Display. Ergonomics Int J 2018, 2(2): 000143.
great movement away from the lane on the road. The highest failure rate of the driving task was 2 times per participant. The overall failure rate was 4.5% with 4 failures in 81 experiments. Even though this rate was low for the total number of experiments, it seems that accidents could happen when two different tracking tasks were performed simultaneously. Although the tracking task was simple when participants focused on the horizontal bar, the value was worthy of notice. The failure of the driving task occurred regardless of the driving experience.
Discussion
This study identified the performance and subjective workload of visual search on the HUD while driving. According to the results, visual enhancement and task difficulty were statistically significant for all dependent variables. The results reveal that the application of visual enhancement for automotive HUD improved tracking performance and decreased subjective workload, especially with the shadow effect. The comparison of mean difference among task difficulties revealed that their effect on the subjective workload was statistically significant. However, the difference of mean tracking error was not significant between the medium and high levels of task difficulty. This is one of the reasons for risks such as a visual distraction while driving. Nevertheless, the number of failures in the driving task was very low in the main experiment; the driver’s distraction is a critical factor for car accidents. Hence, the automotive information system should provide a low difficulty level for visual search. In addition, cruise control or a lane keeping assist system should provide support for more difficult driving tasks. A previous study [16] implemented visual enhancement on a static task. On the other hand, this research was based on a driving task, which is dynamic. Consequently, the rate of tracking error in our study in greater than that in the previous study for medium and high levels of task difficulty. This means that the user performance reduces when more than two simultaneous tracking tasks are performed. In particular, the user performance drastically decreases under an environment of augmented reality such as a HUD [19]. The guidelines for driver distraction mentioned in NHTSA [20] only concerns simple control when using in-vehicle electronic products. Therefore, a revision of guidelines regarding driver distraction should be made considering more complicated information devices.
The participants in this study conducted dynamic and complex tracking tasks while driving. However, this experiment was restricted to a mouse-type controller as the input device. Furthermore, the visibility of the HUD environment is generally low compared to that of other displays employed in smart phones or TVs. Therefore, further studies are required to understand the interaction between various types of input devices and visual enhancement on automotive HUD.
Conclusion
This study verified that the translucent reference bar significantly improved drivers' tracking performance. In addition, the shaded and translucent reference bar considerably decreased subjective workload. In this way, automotive HUDs can potentially enhance the driver's experience by providing a new visual modality. Further research is needed to examine different types of visually demanding tasks in a wider range of driving scenarios. These improvements may provide a more detailed view of the impact of HUDs on drivers.
References
-
Kim MH, Lee YT, Son J (2010a) Age-related physical and emotional characteristics to safety warning sounds: design guidelines for intelligent vehicles. Systems, Man, and Cybernetics, Part C: Applications and Reviews, IEEE Transactions on 40(5): 592-598.
-
Kim MH, Son JW, Lee YT, Shin SH (2010b) Development of vehicle environment for real-time driving behavior monitoring system. Journal of the Ergonomics Society of Korea 29(1): 17-24.
-
Engström J, Johansson E, Östlund J (2005) Effects of visual and cognitive load in real and simulated motorway driving. Transportation Research Part F: Traffic Psychology and Behaviour 8(2): 97-120.
-
Goodstein LP (1981) Discriminative display support for process operators. Human detection and diagnosis of system failures pp: 433-449.
-
Woods DD (1991) The cognitive engineering of problem representations. Human-computer interaction and complex systems pp: 169-188.
-
NHTSA (2016) Traffic Safety Facts Research Note, Distracted Driving 2014. DOT HS 812 260. National Highway Traffic Safety Administration, Washington, DC. Jaekyu Park and Youngjae Im. An Effective Visual Method for Information Tracking System on Automotive Head-Up Display. Ergonomics Int J 2018, 2(2): 000143.
-
Kim MJ, Pan YH (2015) A Study on the relationship between cognitive level and size according to the importance of vehicle head-up display channeled information. Korea Design Knowledge Journal 33(3): 163-170.
-
Liu YC, Wen MH (2004) Comparison of head-up display (HUD) vs. head-down display (HDD): driving performance of commercial vehicle operators in Taiwan. International Journal of Human-Computer Studies 61(5): 679-697.
-
Wittmann M, Kiss M, Gugg P, Steffen A, Fink M, et al. (2006) Effects of display position of a visual in-vehicle task on simulated driving. Applied Ergonomics 37(2): 187-199.
-
Tanoue C, Ishizaka K, Nagamachi M (1997) Kansei Engineering: A study on perception of vehicle interior image. International Journal of Industrial Ergonomics 19(2): 115-128.
-
Hong SP, Kim SM, Park SJ, Jung ES (2010) A Study on designing of a menu structure for the instrument cluster IVIS using Taguchi method. Journal of the Ergonomics Society of Korea 29(1): 39-46.
-
Jung G, Kim SM, Kim SY, Jung ES, Park S (2010) Effects of design factors of the instrument cluster panel on consumers’ affection. Proceedings of the International Multi Conference of Engineers and Computer Scientists 3: 1-4.
-
Kim T, Park J, Choe J, Jung ES (2015) Ergonomic design of the gauge cluster display for commercial trucks. Journal of the Ergonomics Society of Korea 34(3): 247-264.
-
Lee S, Yoo S (2014) Cognitive classification of visual information on both sides of transparent display. Korea HCI pp: 377-379.
-
Doshi A, Cheng SY, Trivedi MM (2009) A novel active heads-up display for driver assistance. IEEE Transactions on Systems, Man, and Cybernetics, Part B (Cybernetics) 39(1): 85-93.
-
Park J, Park SH (2007) The effects of various visual enhancements during continuous pursuit tracking tasks. International Conference on Human-Computer Interaction pp: 125-132.
-
Harper RP, Cooper GE (1986) Handling qualities and pilot evaluation. Journal of Guidance, Control, and Dynamics 9(5): 515-529.
-
NHTSA (2012) Visual-Manual NHTSA Driver Distraction Guideline for In-Vehicle Electronic Device. National Highway Traffic Safety Administration, Washington, DC.
-
Jose R, Lee GA, Billinghurst M (2016) A Comparative Study of Simulated Augmented Reality Displays for Vehicle Navigation. In: Proc. of the 28th Australian Conference on Computer-Human Interaction pp: 40- 48.
-
NHTSA (2008) Driver Electronic Device Use in 2007. DOT HS 810 963. National Highway Traffic Safety Administration, Washington DC. Jaekyu Park and Youngjae Im. An Effective Visual Method for Information Tracking System on Automotive Head-Up Display. Ergonomics Int J 2018, 2(2): 000143.
- The Expanding Landscape of Road Rage: A Systematic Review of Conflicts Involving Drivers, Pedestrians, and Micromobility
- Validating Cognitive Models of Royal Navy Performance on Control Systems
- Comparing Standard and State-of-the-art Firefighter Coats on Postural Balance and Gait in a Live Burn Environment
- Investigating the Integration of Telemedicine into Clinicians Workflow: A Review of Methods
- Risk Assessment of Ergonomic Factors in a Textile Firm by RULA, REBA and Fine Kinney Methods
- Impact of Self-Esteem Training on Individuals with Disabilities Aged 17-30