Structural Loading of the Lower Lumbar Area in Different Level of Rubber Tapping
Around half of professional rubber tappers are known to have low back pain. It is speculated that this is due to prolonged lateral and forward bending of the trunk. Yet assessment on compression and shear force on the back and the level of back muscle fatigue and the role of degree of bending have never been done. This study aimed to evaluate the effects of tapping level on structural loading of the lower lumbar area and evaluated the factors associated with fatigue after a day of routine rubber tapping work. 48 healthy rubber tappers volunteered to join in the study. Data collected includes onetime biomechanical modeling of the lower lumbar spine during varying levels of rubber tapping using the University of Michigan 3D Static Strength Prediction Program (3DSSPP) and before-and-after one-day work evaluation of low back muscle activity using electromyography (EMG) and perceived fatigue scale. The results show that the lower the tapping level was, the higher the values of compression and shear force at L5/S1 and L4/L5 would be (p-value=0.001). For EMG, the amplitude was increased with a spectrum shifted toward lower frequency. The percentage of maximal voluntary contraction (%MVC) was also increased by more than 20%. The degree of perceived fatigue after work was at moderate level. These parameters were more severe among those tapping at lower level both before work, and more importantly, after work. Other independent predictors for fatigue were number of trees tapped per day but not sex, age, weight, and height. Low level rubber tapping exerts harmful effects on trunk structural loading. Further research to prevent its consequence is needed. Relevance to Industry Rubber tapping potentially has many ergonomic problems and high prevalence of low back pain was confirmed. Prior to this research there has not been study to quantify the excessive stress imposed on the lower lumbar area during rubber tapping at different tapping levels.
Relevance to Industry
tapping at different tapping levels.
Keywords: Rubber Tapping; Structural Loading; Biomechanical Model; Fatigue
Introduction
Trunk health of human-being is a result of interaction between spinal loadings and torso muscular strength expressed as trunk structural loading. The former further consists of compression and shear forces acting on various intervertebral joints in the lumbosarcral area [1]. The latter (strength) ability to tolerate the former (loading) is depleted under fatigue. Increase in spinal loading in combination with muscle fatigue is known to be a cause of low back pain [2, 3]. The model of spinal loading was demonstrated among sheep sheerers, crab fishers, drywall workers, and healthcare services providers [4, 5, 6, 7].
Biomechanical model of the lower lumbar spine loading of the compression and shear force are usually assessed on the lumbosarcral disc at L4/L5 and at L5/S1 [8]. For muscle fatigability assessment, electromyography (EMG) and perceived fatigue scale are often used. The increasing of the EMG amplitude (expressed as root mean square value; RMS) with a spectrum shifted toward lower frequency is interpreted as a sign of muscular fatigue [9, 10]. Moreover, a higher percentage of maximal voluntary contraction (%MVC) is another indicator of increase risk of muscle fatigue due to the restriction of blood flow [11]. Subjectively, the perceived fatigue scales are ranging from 0-10. A score of zero indicates not at all fatigue and a higher score indicates an increasingly of fatigue degree [12].
Thailand is among the top world exporter of rubber resin product. Approximately 1.2 million people are engaged in job in year 2009. The reported prevalence of low back pain among rubber tappers varied from 55.1% to 55% [13]. In performing this task, a special sharp tapping knife is used to shave off the thinnest possible layer of the bark along a downward 30° degree left to right oblique curve. The levels of tapping vary from above eye to below knee, depending on the age of trees with are usually equal in each plantation. Trunk twisting and bending are unavoidable. The lower the level of tapping is the higher level the body is demanded to bend and twist. Fatigue of back muscle can occur after long working hours. These could be harmful to workers’ trunk health. Yet the suspicions have never been verified with real data. The relationship between rubber tapping level and the degree of compression and shear forces as well as the degree of fatigue is also not known. The objective of this study was to evaluate the effect of tapping level on structural loading of the lower lumbar area and evaluated the factors associated with fatigue after a day routine rubber tapping work.
Methods
Subjects and Study Design
This study was approved by the Ethics Committee of the Faculty of Medicine, Prince of Songkla University (SUB.EC 51/354-009). All of the subjects signed their formal consent form before data collection. Forty-eight healthy active rubber tappers (24 male and 24 female) who had at least one year of experience in rubber tapping were recruited from four villages in Chumphon province. They must be 18 to 40 years old with normal body mass index (18.5-23.4 kg/m2). The level of tapping for over 80% of the tree of each individual must be more or less the same (trees growth on the same batch). The subjects were first assessed compression and shear force on lower back with different tapping level above the ground. Subsequently by portable EMG applied before and after they daily rubber tapping work. Fatigability was assessed from the EMG spectrum and perceived fatigue score that interview before and after working.
Data Collection
Biomechanical modeling of the lower lumbar spine during rubber tapping: The subjects were assigned to perform rubber tapping at eye (150 cm), waist (100 cm), and knee (50 cm.) level. At each level, the subject held the special tapping knife with both hand and pulls the stroke over the rubber tree along a downward 30° left to right oblique curve to cut of the bark. Three digital VDO cameras were used. Each of them was fixed to a tripod so that their horizontal level were the same and the shooting directions were from the front, back and left side of the working person with most orthogonal view and equal distance between each camera. The shootings were synchronized with a shutter speed of 1 per 10,000 sec and 30 frames per second. These video files were loaded to a computer and analyzed for animation with the University of Michigan Three-Dimensional Static Strength Prediction Program (3DSSPP). The segment angles with additional data on sex, height and weight (external load was assume to be zero) were used as input to the model. The body segments orientations were expressed from the coordinated system specified within the 3DSSPP. Predicting compression and shearing force on L5/S1 and L4/L5 disc were calculated by a linear programming optimization algorithm of the model. Assessment EMG of low back muscle from real rubber tapping task: On a separated day, the same subjects were assessed on amplitude and frequency of EMG signals of erector spinae muscle at L4 level. Biopac disposable surface electrodes were placed on both sides of L4 at 3 cm apart from the midline with a sample rate of EMG at 1,000 per second. EMG signal was assessed for 3 times, firstly during maximal isometric constriction of the back to evaluate the maximal voluntary contractions (MVC) of the back muscle with a rest period of 15 minutes to wash out fatigue, the second EMG was done then the tapper started their daily work. The third times EMG was measured at the last 5 minutes before the end of that work when the rubber tapper has completed 600-700 trees. The raw data of EMG signals were processed and normalized relative to the frequency (median frequency; MF) and amplitude (root mean square; RMS) using the Fast Fourier Transform (FFT) technique to provide information from the signals. At the end of EMG session, the subjects were asked to rating the level of their perceived fatigue of the back using visual analog scale (Borg scale) that ranging from 0 to 10 and then recall on the number of tree tapped and tapped level. The time used for tapping was recorded.
Statistical Analysis
Descriptive statistics were used to summarize general characteristics of the subjects, and all assessments. The correlation coefficient between EMG outcomes and perceived fatigue score was analyzed. Since each subject was measured more than one, linear mixed effects models were used to compute the random effects due to individual variation and the fixed effect of tapping levels on various outcome variables, namely L5/S1 and L4/L5 disc compression and shear force, EMG parameters (MF, RMS, and %MVC), and perceived fatigue score, adjusted for other independent variables. Interaction between tapping levels and other independent variables were explored to see whether the tapping effect was consistent across joint level and time of measurement. The statistical significant level was set at <0.05.
Figure 1 displays the distribution on the compression and shear forces at L5/S1 and L4/L5 when the subjects were assigned to tap at waist-eye, knee-waist and below knees levels. Both forces decrease their values as the level of tapping move up. At below knees level, compression force on L5/S1 and L4/L5 was the highest and more or less equal (median being 2,712.5 N and 2,581.3 N, respectively). As the level of tapping was raised, the compression consistently declined on both intervertebral joints. For sheer force, the degree of force reduction was less substantial at L5/S1 than at L4/L5. In other word, L5/S1 tended to subject to relatively high shear even at a high level of tapping. Table 2 compares results of mixed effects analysis of variance of compression force and shear force. It confirmed that the pattern of decline in compression force was consistent in both joint levels (p- value of tapping level-joint level interaction term=0.41). In contrast, the corresponding interaction term predicting shear force was highly significant (p<0.001) indicating dissimilarly of decline. Nevertheless, all subjects had the value of both compression and shear forces within safety level (marked by the horizontal dash lines in Figures 1a and 1b).
Results
General Characteristics of the Subjects
Table 1 presents the general information of the subjects. Most were adult male in the required range of body mass index values. Right handedness was strongly predominated. The number of tapped trees per day raged from 400-800 trees with an average of 650±90 trees per person per day. The subject was tapping the tree at eyes, waist and knees level in a similar proportion with the mean duration of more than 3 hours.
| Characteristic | N (%) | ||||
|---|---|---|---|---|---|
| Sex | |||||
| - Male | 31 (64.6) | ||||
| - Female | 17 (35.4) | ||||
| Age (mean±SD) = 28.7±5.9 yrs | |||||
| BMI (mean±SD) = 21.1± 1.5 kg/m2 | |||||
| Handedness | |||||
| - Right | 44 (91.7) | ||||
| - Left | 4 (8.3) | ||||
| Work load (number of tapped trees per day) | |||||
| - 400-500 | 6 (12.5) | ||||
| - 501-600 | 7 (14.6) | ||||
| - 601-700 | 22 (45.8) | ||||
| - 701-800 | 13 (27.1) | ||||
| Current tapping level | |||||
| - Knees or below | 14 (29.2) | ||||
| - Above knee to waist | 15 (31.2) | ||||
| - Waist to eyes | 19 (39.6) | ||||
| Working hour per day (mean±SD) = 3.23±0.58 hrs. |
Table 1: General characteristics of the subjects.
Low Back Compression and Shear Forces by Level of Tapping
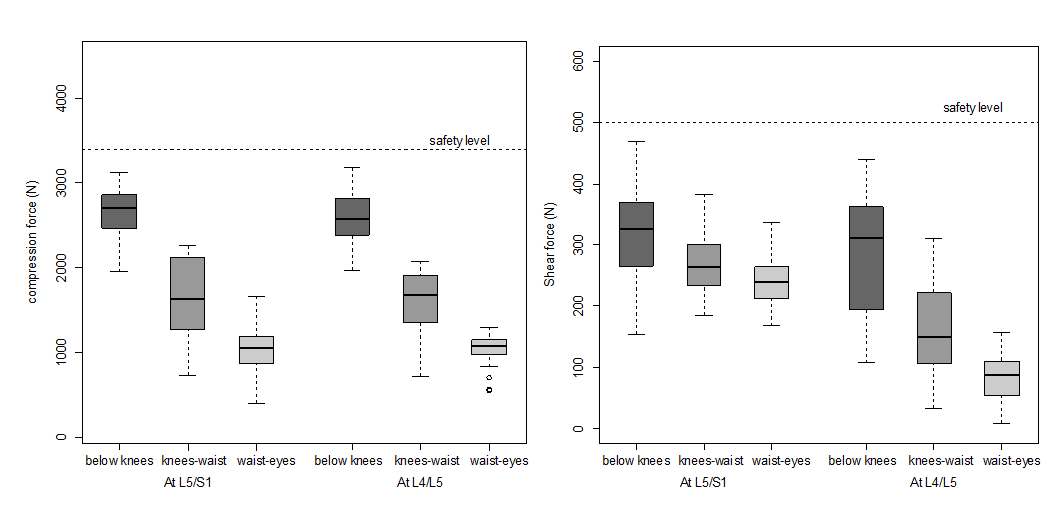
1a 1b Figure 1: Compression (1a) and shear force (1b) on the L5/S1 and L4/L5.
| Compression force | Shear force | |||||||||||
|---|---|---|---|---|---|---|---|---|---|---|---|---|
| DF | F-value | p-value | DF | F-value | p-value | |||||||
| Intercept | 1, 235 | 3368.46 | <0.001 | 1, 235 | 1409.77 | <0.001 | ||||||
| Main effects | ||||||||||||
| Tapping levels | 2, 235 | 875.71 | <0.001 | 2, 235 | 148.78 | <0.001 | ||||||
| Joint L5/S1 vs L4/L5 | 1, 235 | 0.78 | 0.38 | 1, 235 | 230.12 | <0.001 | ||||||
| Interaction | ||||||||||||
| Tapping levels*joint levels | 2, 235 | 0.89 | 0.41 | 2, 235 | 29.49 | <0.001 |
Table 2: The results of mixed effects analysis of variance of L5/S1 and L4/L5 disc compression and shear force across the tapping
EMG Analysis and Perceived Fatigue of the Lower Back of Rubber Tapping Work
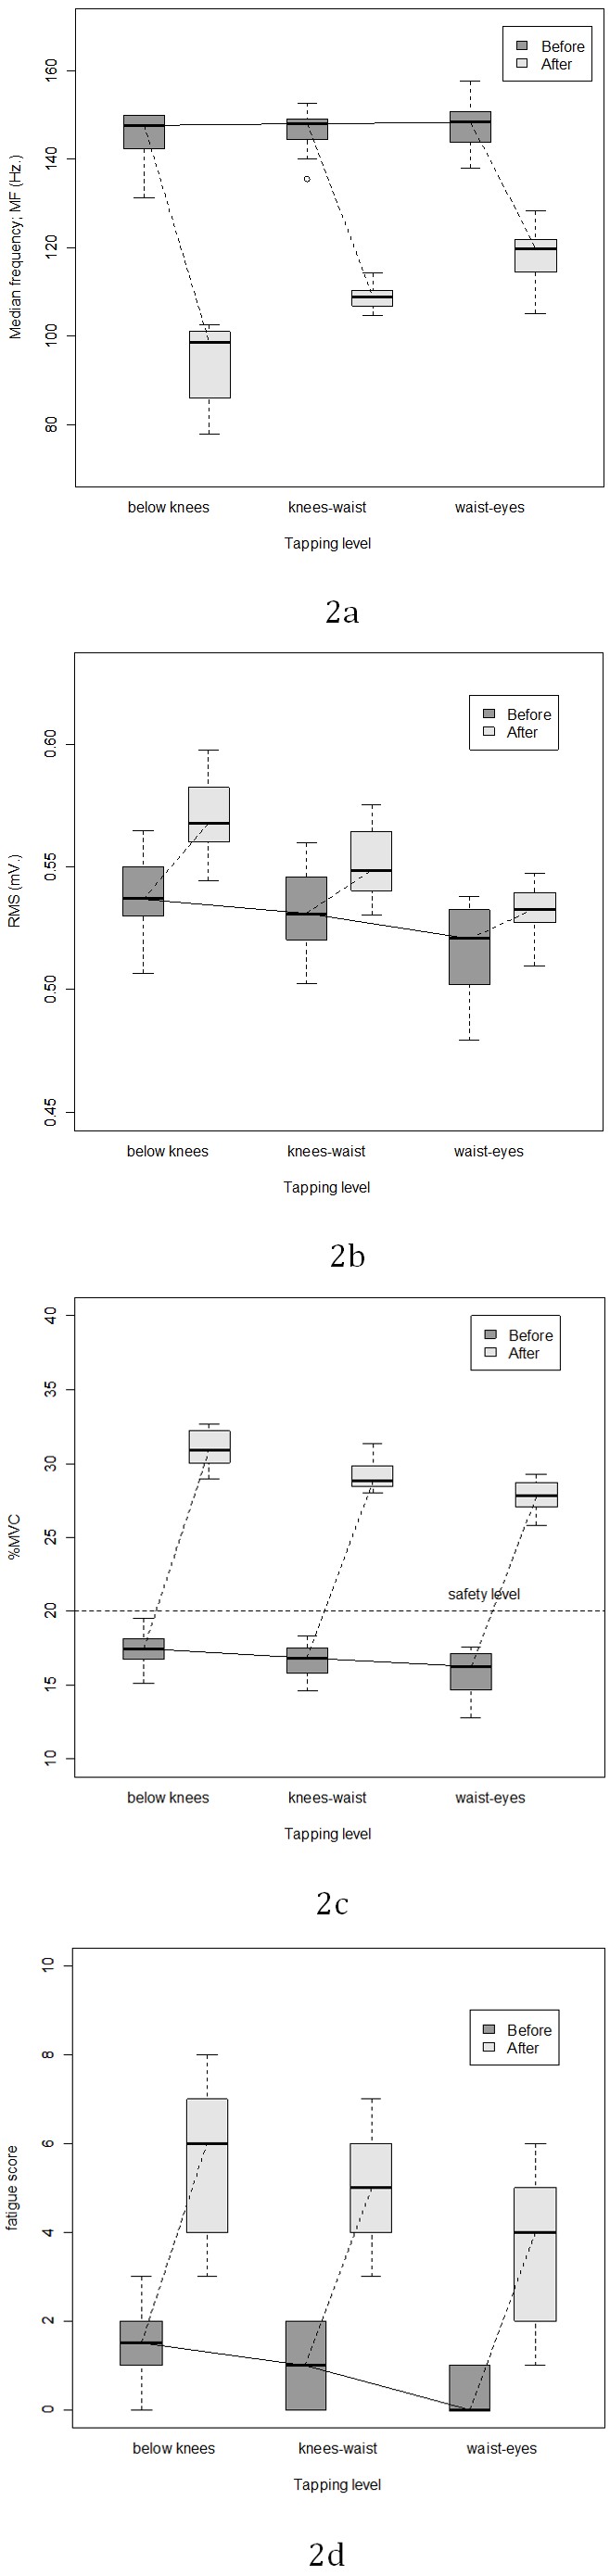
The decrease of MF depress reduced as the level of tapping raised. Before work, RMS, %MVC values, and perceived fatigue score decrease as the level of tapping was farer from the ground. These parameters were slightly higher among rubber tappers who usually tapped at the lower level. After work end, RMS and %MVC in all groups quite stable rose across the level of tapping. The maximal voluntary contraction increased more remarkably by work. It was over 20% MVC, which exceeding the safety level discussed by Oddsson, et al. [11]. The average perceived fatigue score of the subjects after work completed was a moderate level (mean=4.7±1.9) with a significantly higher than those at before work.
EMG pattern of the left and right erector spine muscles was not significantly different. The two-side average values were used for spectrum analysis. Figure 2 summarizes the change of median frequency; MF (Figure 2a), root mean square; RMS (Figure 2b), percentage of maximal voluntary contraction; %MVC (Figure 2c), and perceived fatigue score due to the daily tapping task (Figure 2d). MF among rubber tapper of different tapping levels was quite similar before their work. At the end of the work, all groups had significantly reduced MF.
The Correlation between Perceived Fatigue Score and Various EMG Parameters
Table 3 shows the correlation coefficients between perceived fatigue score and the EMG parameters (MF, RMS, and %MVC) at before and after work. Before work, the perceived fatigue score relatively poorly correlated with EMG parameters (absolute value of r ranging from .18 to .33); while relatively strong correlation between these two outcomes was found after work (absolute value of r ranging from .53 to .67).
| MF | RMS | %MVC | ||||||||||||
|---|---|---|---|---|---|---|---|---|---|---|---|---|---|---|
| before | after | before | after | before | after | |||||||||
| Perceived fatigue score before work | -0.18 | -0.62 | 0.33 | 0.52 | 0.33 | 0.53 | ||||||||
| Perceived fatigue score after work | -0.28 | -0.67 | 0.41 | 0.53 | 0.42 | 0.55 |
Table 3: Correlation coefficients between perceived fatigue score and various EMG outcomes.
Factors Associated with Fatigue
Table 4 shows the variables associated with perceived fatigue score from work and EMG outcomes (MF, RMS, and %MVC) of low back muscle using linear mixed effect model. Compression force and shear force were not included in the model since they are not active force and show no correlation with all fatigue parameters (details omitted). RMS was multiplied by 100 while %MVC, and perceived fatigue score multiplied by 10, to increase the coefficients to achieve readable values. Out of several interactions among independent variables tested, only that between time (after vs before work) and tapping level was significant.
Coefficient of main effect of after vs before work were all significant and positive (except for MF), indicating that the subjects were more fatigue after rubber tapping. The coefficient of tapping level at waist-knees and below knees were all significant when the highest level was the reference suggesting that the lower the tapping level is the more the subject would be fatigue before their work. Exceptions were MF, which was not significantly different among different groups of level of tapping before the work began (see also figure 3a). The signs and the magnitude of the interaction terms at level between waist-knees and below knees were consistent with those of main effect of times, suggesting that at the end of daily work, the extent of the fatigue from the work were more pronounced among low level tapping. Coefficients of main effect of number of tree tapped per day were all significant indicating that more work load contributes a more fatigue. No significant main effects and interaction term of sex, age, weight, and height was observed suggesting that these characteristics had no influence on base line level and they do not change the effects of work on the degree of fatigue
| Coeff (Std.Error) of outcomes | ||||||||
|---|---|---|---|---|---|---|---|---|
| Variables | ||||||||
| MF | RMS*100 | %MVC*10 | Fatigue score*10 | |||||
| Intercept | 174.74(17.58)* | 44.51(1.63)* | 87.59(44.96) | 36.80(28.82) | ||||
| Times (After vs before) | -29.02(1.53)* | 1.53(0.32)* | 122.20(2.36)* | 33.68(2.60)* | ||||
| Tapping level: ref.= waist-eyes | ||||||||
| - knees-waist | 0.81(1.83) | 1.51(0.57)* | 8.65(4.72)* | 5.88(2.45)* | ||||
| - below knees | 0.13(1.88) | 1.56(0.59)* | 13.53(4.85)* | 10.59(2.53)* | ||||
| Number of tapped trees per day | -0.03(0.01)* | 0.01(0.002)* | 0.05(0.02)* | 0.03(0.01)* | ||||
| Female vs male | 1.29(1.29) | -0.44(0.41) | -0.58(3.29) | -2.11(2.11) | ||||
| Age | 0.24(0.13) | -0.01(0.04) | 0.05(0.33) | 0.33(0.21) | ||||
| Weight | 0.04(0.09) | 0.02(0.03) | 0.11(0.23) | -0.20(0.14) | ||||
| Height | -0.12(0.11) | 0.02(0.04) | 0.20(0.29) | 0.15(0.19) | ||||
| Interaction between times and tapping level | ||||||||
| Time2: knees-waist tapping level | -8.37(2.31)* | 0.34(0.48) | 2.55(3.55) | 5.65(3.91) | ||||
| Time2: below knees tapping level | -21.65(2.35)* | 1.67(0.49)* | 12.66(3.62)* | 8.46(3.99)* | ||||
| Random effect variance (SD) | 13.39(3.66)* | 1.86(1.36)* | 133.47(11.55)* | 26.58(5.16)* |
Table 4: Factors associated with perceived fatigue score and EMG of low back muscle. * Statistical significant at p<0.05
Discussion
This study has illustrated the details of trunk structural loading from rubber tapping work. The lower the tapping level was, the higher values of compression and shear force would be. The response between the compression and tapping level was similar for at L5/S1 and L4/L5. Reduction of shear force at L5/S1, however, responses to change of tapping level relatively little compared that at L4/L5. On the other hand, the averages of the disc compression and shear forces at both L5/S1 and L4/L5 in all tapping levels were within acceptable limits. EMG results which indicated the fatigability of the lower back muscle, especially work performance at the lower tapping level, were correlated more with perceived fatigue score after than before work. Lower level rubber tapping is associated with increased degree of fatigue both before work, and more importantly, after work. Other independent predictor for fatigue included number of tree tapped per day but not sex, age, weight, and height.
Rubber tapping at below waist level requires body bending forward. Taking posterior point of the back as fulcrum, the more the body is bending forward in a standing position, the stronger the forward bending moment is. The counteracting moment exert force at the anterior part of the spine with relatively short moment arm, which substantially increase compression force on the joint. Similarly, the spine is twisted increase the lumbar shear force on the disc. At the same level of bending (tapping level), compression force at L4/L5 is close to that at L5/S1, as the curve of lower back is graceful. Trunk twisting is different. When tapping rubber tree at high level, Shearing force at L5/S1 was higher than that at L4/L5 because the lumbar shear force could be distributed to many joints at the lumbar spine but not the sarcrum. At low level of tapping, tranaxial rotation is more intense. Lumbar spine in a fully flex position poorly distributes shear force.
According to the revised NIOSH equation, L5/S1 compression force of 3,400 N was limited as a safety level while the spinal shear loading of less than 500 N has also been recommended for the safety threshold by McGill, et al. [14, 15]. The values of both disc compression and shear force from our study were much less than those recommendations, which should be acceptable.
While compression and shear force were within safety limit, fatigue after daily rubber tapping was quite serious. All subject had increase EMG amplitude with a spectrum shift toward lower frequency and %MVC above 20%, which had been documented to be associated with the decreasing of muscle performance due to fatigue [11, 16, 17, 18]. The effects is more pronounced in low level tapping because forward bending requires a stronger counter balance force at the back by lattisimus dorsi and erecter spinae muscles [19]. With prolonged such demand, at the end of work, the level of RMS, % MVC and fatigue score increase sharply among the low level than the high level tapping. The effect was carried over to the next working cycle, similar causing noticeable relationship between tapping level and pre-work fatigue.
The only other significant predictor of fatigue was increasing of work load (numbers of trees tapped per day). On the other hand, demographic characteristics of the subject (age, sex, weight, and height) were not associated with fatigue outcome. This is in contrast with the study by Kankaanpaa,a et al. [20] which indicating being female, older age, and high BMI have a significant influence on lumbar paraspinal muscle fatigability during isometric test. Fatigue can be easier generated by isometric muscle constriction than dynamic constriction [21]. While in laboratory, all subjects are usually assigned to have equal fixed period of load. In real working, a person may prolong their resting stage making the fatigue less pronounced. Our study could firmly document the increase in compression and shear force on the spine and increase of fatigue in association with low level tapping. However, whether the rubber taper should have intermittent resting and shortening of working period on each day, which was recommended in many reports, should be recommended in our population is too early to judge [21, 22, 23]. Unlike factory work, time and duration of rubber tapping in Thailand are both self-regulated. A further research is needed to check whether such self regulation is enough to protect the health of these rubber tappers.
While our data cover both biomechanical model and EMG and perceived fatigue score measurement, we still lack of dynamic model. The data were from cross- sectional study. Workers who had to leave their job due to any reason would already be excluding from sample. The information that the level of ergonomic risk from work among the rubber tappers is moderate should be interpreted with caution.
Conclusion
Fatigue was the main factor that may consequent to more serious back problems among rubber tappers. Attempts should be made to find ways to reduce fatigue of the lower lumbar area during rubber tapping work.
Acknowledgment
This study was financially supported by the Thailand Research Fund. Special thanks are owed to all subjects in Chumphon province.
References
-
Davis KG, Marras WS (2000) The effects of motion on trunk biomechanics. Clin Biomech (Bristol, Avon) 15(10): 703-717.
-
Kumar S (1990) Cumulative load as a risk factor for back pain. Spine (Phila Pa 1976) 15(12): 1311-1316.
-
Norman R, Wells R, Neumann P, Frank J, Shannon H (1998) A comparison of peak vs cumulative physical work exposure risk factors for the reporting of low back pain in the automotive industry. Clin Biomech (Bristol, Avon) 13(8): 561-573.
-
Milosavljevic S, Carman AB, Schneiders AG, Milburn PD, Wilson BD (2007) Three-dimensional spinal motion and risk of low back injury during sheep shearing. Appl Ergon 38(3): 299-306.
-
Mirka GA, Shin G, Kucera K, Loomis D (2005) Use of the CABS methodology to assess biomechanical stress in commercial crab fishermen. Appl Ergon 36(1): 61- 70.
-
Pan CS, Chiou SS (1999) Analysis of biomechanical stresses during drywall lifting. Int J Ind Ergonom 23(5-6): 505-511.
-
Skotte JH, Essendrop M, Hansen AF, Schibye B (2002) A dynamic 3D biomechanical evaluation of the load on the low back during different patient-handling tasks. J Biomech 35(10): 1357-1366.
-
Chaffin D, Andersson GBJ (2006) Occupational biomechanic. 4th (Ed.), John Wiley & Sons, United States of America.
-
Luttmann A, Jager M, Laurig W (2000) Electromyographical indication of muscular fatigue in occupational field studies. Int J Ind Ergonom 25(6): 645-660.
-
Farina D, Gazzoni M, Merletti R (2003) Assessment of low back muscle fatigue by surface EMG signal analysis: methodological aspects. J Electromyogr Kinesiol 13(4): 319-332.
-
Oddsson LI, Giphart JE, Buijs RJ, Roy SH, Taylor HP, et al. (1997) Development of new protocols and analysis procedures for the assessment of LBP by surface EMG techniques. J Rehabil Res Dev 34(4): 415-426.
-
Borg G (1990) Psychophysical scaling with applications in physical work and the perception of exertion. Scand J Work Environ Health 16(S1): 55-58.
-
Bensaard N, Tuntiseranee P, Anuntaseree S (2004) Work conditions and prevalence of musculoskeletal pain among para-rubber planters: a case study in Tambon Nakleua, Kantang District, Trang Province. Songkla Med J 22(2): 101-110.
-
Waters TR, Putz-Anderson V, Garg A, Fine LJ (1993) Revised NIOSH equation for the design and evaluation of manual lifting tasks. Ergonomics 36(7): 749-776.
-
McGill SM, Norman RW, Yingling VR, Wells RP, Neumann P (1998) Shear happens! Suggested guidelines for ergonomists to reduce the risk of low back injury from shear loading. Proceedings of the 30 Annual Conference of the Human Factors Association of Canada, Mississanga, Ontario, pp: 157-161.
-
Adams MA, Dolan P (1995) Recent advances in lumbar spinal mechanics and their clinical significance. Clin Biomech (Bristol, Avon) 10(1): 3-19.
-
Hostens I, Ramon H (2005) Assessment of muscle fatigue in low level monotonous task performance during car driving. J Electromyogr Kinesiol 15(3): 266-274.
-
Roja Z, Kalkis V, Vain A, Kalkis H, Eglite M (2006) Assessment of skeletal muscle fatigue of road maintenance workers based on heart rate monitoring and myotonometry. J Occup Med Toxicol 1: 20.
-
Marras WS, Davis KG, Granata KP (1998) Trunk muscle activities during asymmetric twisting motions. J Electromyogr Kinesiol 8(4): 247-256.
-
Kankaanpää M, Laaksonen D, Taimela S, Kokko SM, Airaksinen O, et al. (1998) Age, sex, and body mass index as determinants of back and hip extensor fatigue in the isometric Sorensen back endurance test. Arch Phys Med Rehabil 79(9): 1069-1075.
-
Kroemer KHE, Kroemer HB, Kroemer KE (1994) Ergonomics: How to Design for Ease and Efficiency. Prentice Hall, United States of America.
-
Allen DG, Lamb GD, Westerblad H (2008) Skeletal muscle fatigue: cellular mechanisms. Physiol Rev 88(1): 287-332.
-
Westerblad H, Bruton JD, Katz A (2010) Skeletal muscle: energy metabolism, fiber types, fatigue and adaptability. Exp Cell Res 316(18): 3093-3099.
- The Expanding Landscape of Road Rage: A Systematic Review of Conflicts Involving Drivers, Pedestrians, and Micromobility
- Validating Cognitive Models of Royal Navy Performance on Control Systems
- Comparing Standard and State-of-the-art Firefighter Coats on Postural Balance and Gait in a Live Burn Environment
- Investigating the Integration of Telemedicine into Clinicians Workflow: A Review of Methods
- Risk Assessment of Ergonomic Factors in a Textile Firm by RULA, REBA and Fine Kinney Methods
- Impact of Self-Esteem Training on Individuals with Disabilities Aged 17-30