Electrochromic Glass Enhances the Passenger Experience in Airports
Interviews were conducted with airline passengers in the flight gate areas at a major international airport under each of 2 conditions, one where the gate seating area had low-e glass, and one where the gate seating area had electrochromic glass that changes its visual transmittance (tint) as a function of predicted glare or solar gain via an automated software program. Face-to-face interviews were conducted with a total of 503 passengers over a 5 weeks period. On-site surveys and video footage of passenger behavior were collected to measure the comparative seat occupancy, seat dwell time and occupant behavior at both gates. Economic data was collected from proximate vendors at each gate. Results show that proximity to a window is important to the passenger experience and passenger opinions of electrochromic glass were either better or comparable to those for low emissivity glass. Significantly fewer passengers reported adverse glare effects with the electrochromic glass. Seat dwell times at gates with electrochromic glass was significantly longer for seats located close to the glass compared to the gate with low-e glass. There was suggestive evidence that passengers at the gate with the electrochromic class also tended to spend more money. Separately, an adjacent bar (also retrofit with electrochromic glass) reported average revenue increases of 102% for the 6 months after the glass was installed. Overall, electrochromic glass at airport gates and in retail outlets with external walls can improve the visual environment for airline passengers and may boost revenue.
Introduction
There are at least 17,678 commercial airports worldwide [1] and they generate over $150 billion in revenue [2]. In 2016, airlines worldwide carried 7.7 billion airplane passengers [2]. Today, rather than simply being transportation facilities, many airports are perceived as being enjoyable destinations providing retail, food and entertainment services [3]. Indeed, current airport revenues from non-aeronautical sources, such as retail, food concessions, entertainment, parking etc., can be as much as 60% of gross revenues [3]. The level of spending at an airport is closely correlated with the quality of the passenger experience and enhancing this experience is shaping current design thinking [3].
Dallas/Fort Worth International Airport (DFW) is the 4th busiest airport in the USA and in 2016 it served over 65 million passengers that year, which is some 180,000 passengers daily [4]. Passenger traffic is projected to grow, and by 2020 DFW will handle more than 70 million passengers [4]. DFW has previously been voted the best large airport in the USA in terms of customer satisfaction yet it continues to strive to improve its facilities to further enhance the customer experience [5]. To meet with forecasted demand, the airport has a strategic plan that is focusing on several initiatives, including enhancing the customer experience by further improving the physical environment of the airport.
To date there have been comparatively few systematic behavioral studies in airports, but those that have been conducted show that the airport environment plays a crucial role in the quality of the user experience and the commercial performance of the airport in terms of non- aeronautical revenues. Airport design features that reduce passengers stress have been shown to increase the retail revenues [6]. Good lighting has been identified as important to the user experience in an interview study of 346 passengers at a Dutch international airport that looked at a range of environmental design preferences [7]. This study also found that providing retail facilities for passenger and comfortable spaces proximate to the departure/arrival gates is of growing economic importance [7].
In DFW the average airport dwell time is 90 minutes which affords passengers an ample opportunity to shop, eat/drink, work, or otherwise experience the airport [5]. It is generally recommended that passengers be available in the boarding gate area some 30-60 minutes prior to actual boarding of an airplane, so boarding gate areas are designed to promote substantial dwell times. Boarding gates typically are areas that have an external wall and usually this has large window areas for external views.
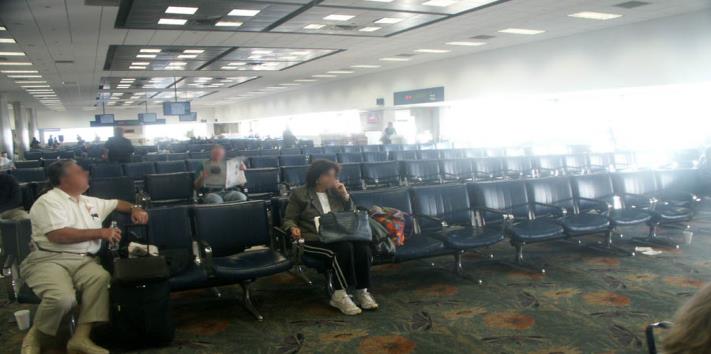
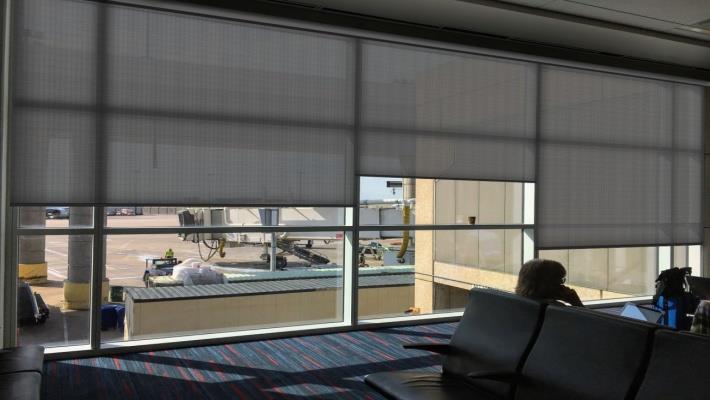
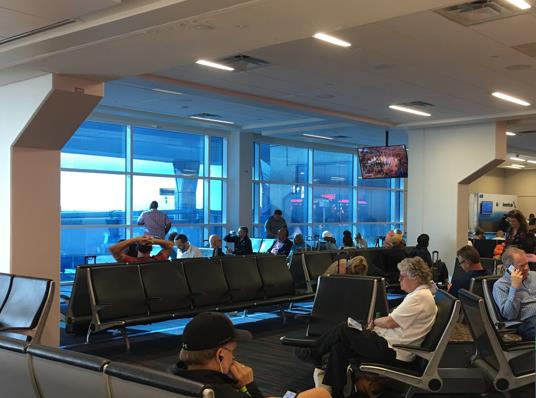
As the first carbon neutral airport in North America, DFW has 6 million square feet (557,000m2) of terminal space that must be cooled either with super-cooled water in the summer months, or air-conditioned. Annual energy costs, a substantial portion of which is for air- conditioning operations, are almost $30 million [5, 8]. The façade of DFW is comprised of large areas of glass and on average the sky is clear, mostly clear, or partly cloudy 74% of the time, and overcast or mostly cloudy 26% of the time [9]. This presents a large area for solar heat gain and for daylight glare intrusion (see Figure 1). External or internal blinds can be used to reduce solar heat gain and block daylight glare, but they restrict the clarity of any window view, and in an airport a clear window view is a critical requirement for safe operations (Figure 2). Also, if the blinds are internal they may not effectively block solar heat gain. Previous researchers have stated that “Anyone who has ever sat near a cold window on a winter day or in direct sunlight on a hot day recognizes that windows can cause thermal discomfort [10].” Passenger comfort in an airport is a significant factor that enhances the passenger experience and a more positive experience may translate in more retail revenues for the airport [11].
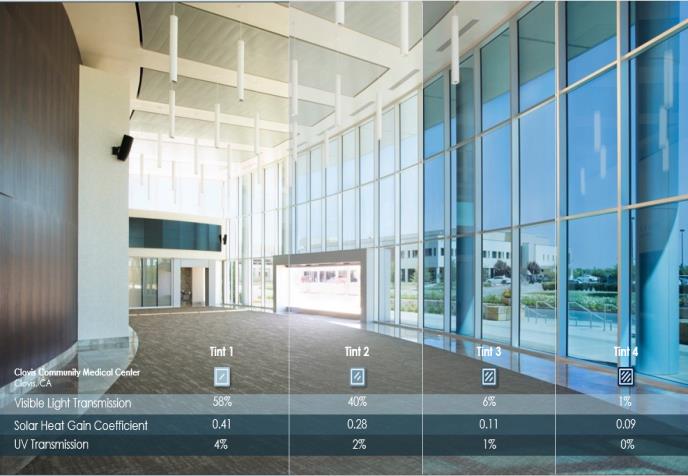
Electrochromic glass (EC) is an innovative technology that can automatically vary its light and heat transmission from the glass being in a clear state to a darker state by the application of direct current. EC can significantly reduce solar heat gain which in turn can save on building energy usage. EC can optimize daylight penetration when needed, control daylight glare and improve the visual and thermal environment for occupants and reduce solar heat gain, thereby saving energy and improving the user experience. EC also allows for unrestricted views to the outdoors in all states (see Figure 3) and access to a window view has been shown to be important to the health of individuals [12].
This study compared passenger reactions and seating behavior to either convention allows emissivity glass (Low-e) or EC installed in a gate adjacent to the Low-e. Both gates had the same southeast orientation. It was hypothesized that the EC would reduce daylight glare and improve the visual environment and customer experience for the airport passengers.
Methods
Participants
The participants for interview were 503 randomly selected unpaid volunteer passengers at Dallas-Fort Worth International Airport. 252 participants were passengers departing from a gate with Low-e and 251 participants were passengers departing from an adjacent gate with EC.
Test Sites
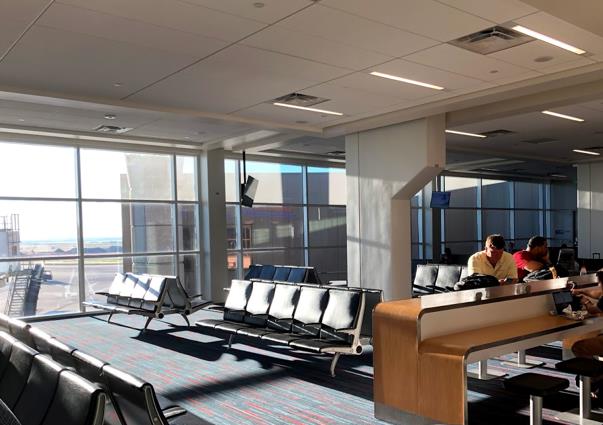
The primary test site was comprised of two adjacent gate areas (A25 and A28) at DFW airport that were selected for the study. Both gates had window walls with a southeast orientation. Gate A25 had insulated glass units with Low-e, as shown in Figures 4 and gate A28 that had insulated glass units with EC (Figure 5).
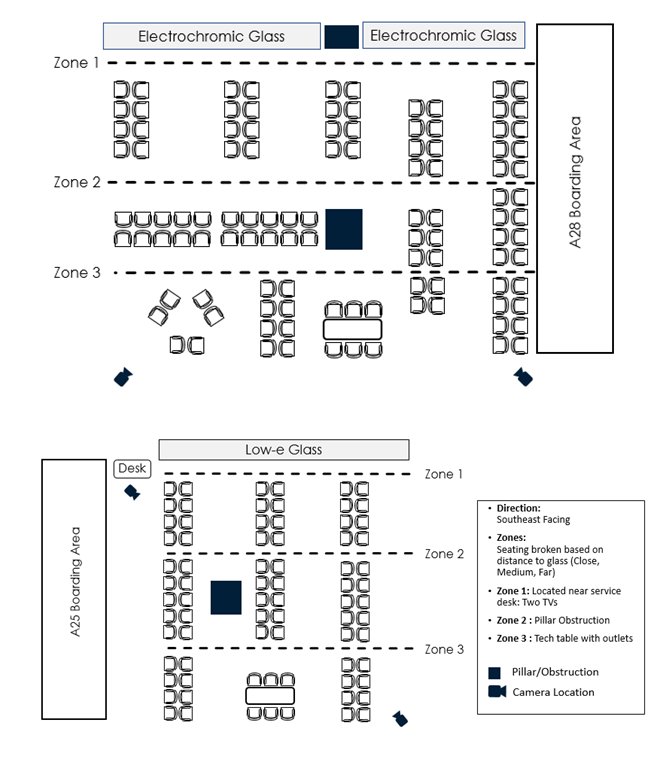
Three zone areas were defined for each gate: zone 1 represented seats that were close to the windows, zone 2 represented seats at an intermediate distance, and zone 3 represented seats that were most distant from the windows (see Figure 6). Both gates had 2 TVs located on zone 2, one pillar obstruction located in zone 2, and one tech table (with power outlets) located in zone 3.
Simultaneous to the EC installation at the gate, EC was also installed in a secondary test site in an enclosed restaurant concession (The Twisted Root) adjacent to Gate A25 on October 1st. In this restaurant 80-90% of the seats have a view of the bar which in turn has the southeast facing exterior windows, and the bar area represents approximately 50% of the wall length and 100% of the available natural light and views in the restaurant.
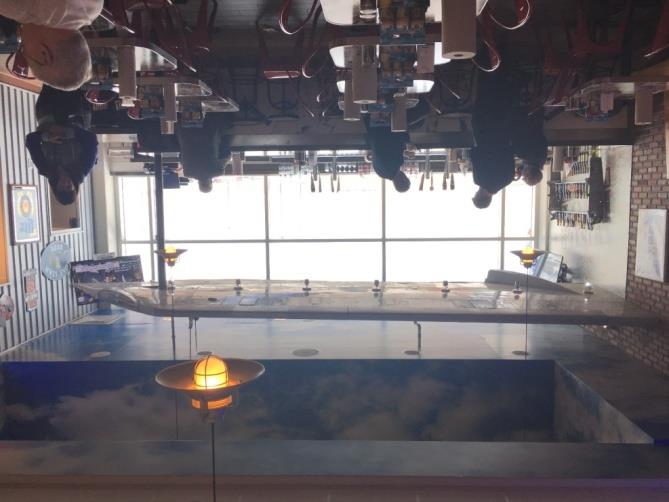
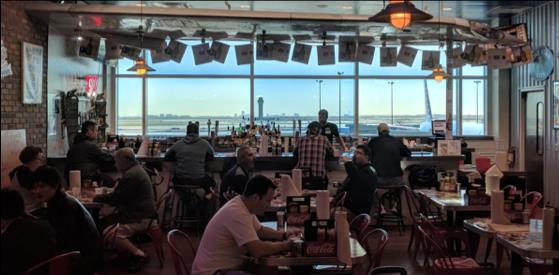
Figure 7 shows this bar and window view with the pre-test Low-e, and Figure 8 shows this same view after installation of the EC.
Apparatus
Four wireless video cameras (Nest Cam IQ indoor cameras) were installed; two at each gate (Figure 6).
Procedure
All face-to-face interviews were conducted by a contract market research firm (National Research Center) on non-rain days for a 5-week period beginning September 25 through October 31, 2017. For the structured interview schedule 30 questions were asked to determine the overall quality of the passenger experience at the gate area regarding the natural light provided by the EC compared to Low-e, using a structured interview. Approximately 50 interviews were conducted with passengers at each gate each week. Because the windows at both gates were facing southeast, interviews were conducted from 8am to 12pm to capture time periods with incident morning sun. Outside weather conditions were recorded on interview days. At the end of each interview the participant was taken to the other gate (i.e. from Low-e to EC or vice versa) and asked whether they noticed anything and if they had any comments about the glass and light quality. Video analysis of occupant seating behavior was conducted for 20 flights, 10 from Low-e, and 10 from EC. All flights were serviced by American Airlines with an average load factor of 90% (90% full). Video recordings were made between 7am-11am, excluding rainy days for a period of 90 minutes prior to scheduled departure time (i.e., if a flight departure time was 8am, the recording period was 6:30am-8am).
Data Analysis
All face-to-face interview data were entered in a spreadsheet (Microsoft Excel). Two-way cross tabulated data was tested using Chi-square with Cramer’s Phi as the measure effect of size. Comparative comments about the glass and light were sorted into positive, null, or negative comments. Video recordings were analyzed to measure seat dwell time for all participants and these were collected for Zones 1-3. The dwell time was defined as the period when a passenger sits down until they stand up and leave their immediate area (i.e. to board, bathroom, discomfort). Passengers who sat for less than 1 minute, or who remained after boarding were excluded from the analysis. Analysis of variance was used to analyze seat dwell times. An average dwell time was computed for each zone. All data were analyzed using a multivariate statistical package (PSPP 1.01).
Results
Weather conditions were not significantly different for the interviews conducted at the 2 gates (Table 1).
| Weather | Low-e | EC | ||||||
|---|---|---|---|---|---|---|---|---|
| Sunny | 60.4% | 51.6% | ||||||
| Cloudy (no sun) | 28.9% | 36.6% | ||||||
| Partly cloudy (some sun) | 10.7% | 11.8% |
Table 3: Study weather conditions.
There was a significant difference (χ2 (1, N=503) = 4.919, p = 0.027) in the numbers of business versus non- business travelers sampled at the gates (Table 2).
| Type of Traveler | Low-e | EC | ||||||
|---|---|---|---|---|---|---|---|---|
| Business | 52.8% | 62.5% | ||||||
| Non-business | 47.2% | 37.5% |
Table 5: Types of traveler at each gate.
There was no significant difference in whether participants had experienced a gate change: no change was reported by 97.2% (Low-e) and 94.0% (EC), or whether participants had experienced a flight delay or not: no delay was reported by 93.6% (Low-e) and 92.1% (EC) at the time of interview. There was no significant difference between gates in where participants chose to sit (Table 3).
| Seat Location | Low-e | EC | ||||||
|---|---|---|---|---|---|---|---|---|
| Closest to window | 59.5% | 59.8% | ||||||
| Near columns/TV | 20.6% | 19.9% | ||||||
| Near power outlets | 19.8% | 20.3% |
Table 1: Seat locations at the two gates.
There was a significant difference (χ2 (2, N=503) = 19.726, p = 0.000 ø = .198) in the seating orientation at each gate (Table 4), and more participants sat facing the window or backing to the window at the EC gate. This was probably because of the different physical layout of seats at the two gates (Figure 6). Because of the different seat layouts at the two gates there was also a significant difference (χ2 (3, N=503) = 10.884, p = 0.012 ø = .147) in the actual window proximity of participants (Table 5), and most participants sat perpendicular to the windows and within 25’ of the windows at both gates.
| Seat Orientation | Low-e | EC | ||||||
|---|---|---|---|---|---|---|---|---|
| Facing window | 0.4% | 6.0% | ||||||
| Back to window | 1.2% | 5.2% | ||||||
| Perpendicular window | 98.4% | 88.8% |
Table 2: Seat orientation at each gate.
| Window proximity | Low-e | EC | ||||||
|---|---|---|---|---|---|---|---|---|
| Very close, <10' | 60.7% | 49.8% | ||||||
| Fairly close, 10-25' | 31.0% | 37.1% | ||||||
| Not very close, 26'+ | 8.3% | 10.8% | ||||||
| Can't see window | 0.0% | 2.4% |
Table 4: Participant’s window proximity at each gate.
There was no significant difference in the ages of participants (Table 6).
| Age (years) | |||||||
|---|---|---|---|---|---|---|---|
| Glass | 20-25 | 25-34 | 35-44 | 45-54 | 55-60 | ||
| Low-e | 8.3% | 17.1% | 20.6% | 22.2% | 31.7% | ||
| EC | 9.2% | 14.3% | 22.3% | 24.7% | 30.6% |
Table 6: Age distribution of participants at each gate.
There was a significant difference between gates (χ2 (1, N=503) = 13.250, p = 0.000 ø = -.162) in the gender of participants, and there were more men sampled at the EC than the Low-e gate (Table 7).
| Gender | Low-e | EC | |||||
|---|---|---|---|---|---|---|---|
| Male | 47.6% | 63.74% | |||||
| Female | 52.4% | 36.3% |
Table 7: Gender distribution of participants at the gates.
Participants were asked to rate ‘the quality, brightness and color of the daylight’ at their gate.
There was a significant difference (χ2 (3, N=503)= 13.307, p = 0.004 ø = .163) in ratings of daylight quality at each gate, with most participants rating this as excellent/good for both types of glass (see Table 8).
| Daylight Quality | Low-e | EC | ||||||
|---|---|---|---|---|---|---|---|---|
| Excellent | 58.3% | 43.4% | ||||||
| Good | 37.3% | 49.0% | ||||||
| Fair | 4.0% | 7.6% | ||||||
| Poor | 0.4% | 0% |
Table 9: Daylight quality ratings at each gate.
There was, however, no significant difference in opinions of how comfortable participants found the quality of the light (daylight + artificial light) at the gate (Table 9).
| Lighting comfort | Low-e | EC | |||||
|---|---|---|---|---|---|---|---|
| Very comfortable | 66.3% | 66.9% | |||||
| Fairly comfortable | 23.0% | 20.3% | |||||
| Neutral | 7.9% | 11.2% | |||||
| Fairly uncomfortable | 2.4% | 1.6% | |||||
| Very uncomfortable | 0.4% | 0% |
Table 11: Opinions of the lighting comfort (daylight + artificial light) at the gate.
There was no significant difference in ratings of how daylight affected mood (Table10). A majority at both gates said that the daylight was pleasant and made them feel either a little or a lot happier.
| Daylight effects on mood | Low-e | EC | |||||
|---|---|---|---|---|---|---|---|
| Pleasant & lot happier | 52.4% | 47.4% | |||||
| Pleasant & little happier | 29.0% | 25.5% | |||||
| Annoying, worsens mood a little | 0.4% | 0.8% | |||||
| Annoying, worsens mood a lot | 0.4% | 1.6% | |||||
| No effect on mood | 17.9% | 24.7% |
Table 12: Daylight effects on mood.
There was a significant beneficial effect of EC on whether there was any glare from daylight and how this affected the participants ability to sit at the gate (χ2 (3, N=503)= 13.352, p = 0.004 ø = .163). More participants reported no glare at the EC gate than the Low-e gate (Table 11).
- Daylight glare effect on ability to sit at the gate
- Low-e
- EC
- No glare, no interference with ability to sit
- 48.0% 62.5%
- Glare but no interference with ability to sit
- 38.5% 26.3%
- Glare, and a little interference with ability to sit
- 10.7% 10.4%
- Glare, and a lot of interference with ability to sit
- 2.8%
- 0.8%
Table 8: Daylight glare interference effects on ability to
Although only a minority of participants reported daylight glare at their seats, specific reported problems were less frequent for EC than Low-e gate (Table 12).
| Effect of daylight glare at seat | Low-e | EC | ||||||
|---|---|---|---|---|---|---|---|---|
| Makes it harder for me to see information on my devices or gate information | 7.1% | 4.0% | ||||||
| Makes my eyes feel sore or irritated | 4.8% | 1.2% | ||||||
| Prevents me from reading and/or using the computer | 4.8% | 3.6% | ||||||
| Prevents me from relaxing in this seat | 2.8% | 1.2% |
Table 10: Effect of daylight glare at the seat in the boarding gate.
There was no significant difference in opinions of the glass at the gate (Table 13).
A majority at both gates said that they liked their glass and improved the quality of the lighting. However, no comparative opinions were collected in which the same person viewed both types of glass.
| Opinions of the glass at the gate | L | ow- | e | EC | ||||
|---|---|---|---|---|---|---|---|---|
| Like the glass/improves light quality | 75.8% | 78.9% | ||||||
| No effect of window glass on light quality | 16.7% | 15.9% | ||||||
| Dislike glass, it makes light quality worse | 7.5% | 5.2% |
Table 13: Opinions of the gate window glass.
Passengers’ open-ended comments about the glass were categorized as positive, null or negative with respect to the electrochromic glass and there was a significant difference in the valency of these comments (χ2 (2, N=503)= 54.222, p = 0.000 ø = .328) and over twice as many positive comments were made about the EC than comments made about the Low-e (Table 14).
| Comments | EC | Low-e | ||||||
|---|---|---|---|---|---|---|---|---|
| Positive | 42.6 | 17.1 | ||||||
| Null | 48.2 | 54.0 | ||||||
| Negative | 9.2 | 29.0 |
Table 14: Open-ended comments about the gate window glass.
All participants were asked to rate the importance of 7 factors in choosing their seat at the gate on a scale where 5 was ‘very important’ and 1 was ‘not at all important’. Table 15 shows the results. Having access to views or daylight was the 2nd highest rated factor for determining seat choice at the boarding gate.
| Important Seat Choice Factors | Mean rating | ||||
|---|---|---|---|---|---|
| Having an empty seat next to me | 3.76 | ||||
| Access to views or daylight | 3.47 | ||||
| Near an outlet | 3.41 | ||||
| Near a bathroom | 3.21 | ||||
| Near restaurants or stores | 2.81 | ||||
| Near the TV | 1.97 |
Table 15: Factors influencing boarding gate seat choice.
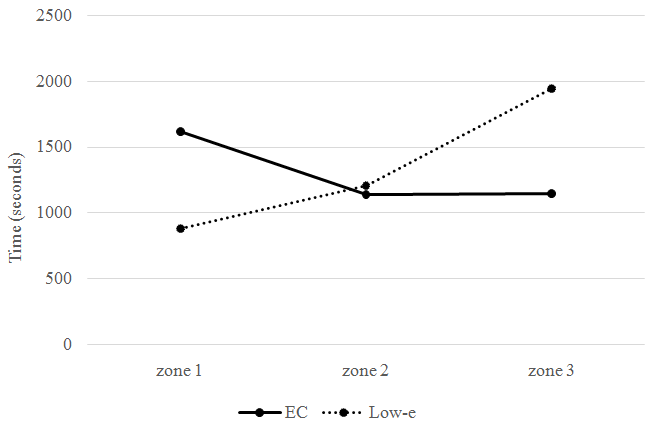
Dwell time results were obtained from the video recordings of participant behavior at each gate. The dwell time data were analyzed to test for effects of type of glass and zone of seating proximity to the glass using analysis of variance. There were no significant main effects of type of glass or of zone on mean dwell times. However, there was a significant interaction effect of glass type and of zone (F (2, 190) = 10.382, p=0.000, adj. R2 = 0.091) and this is shown in Figure 9. For the EC, the average time that passengers sat in zone 1 for almost twice as long (26 minutes 56 seconds) compared with those with the Low-e (mean = 14 minutes 41 seconds), both groups sat for almost equal times in zone 2 (EC mean = 18 minutes 59 seconds: Low-e mean = 20 minutes 4 seconds), and in zone 3 Low-e passengers sat for almost twice as long a time as for those with the EC (EC mean = 19 minutes 9 seconds: Low-e mean = 32 minutes 26 seconds).
Finally, there was a trend suggesting that passengers may spend more when in a more acceptable visual environment because the purchasing mean value at the gate fitted EC was $16.59 compared to $15.23 for the Low-e fitted gate, but this difference was not statistically significant. However, at the restaurant that was retrofitted with the EC there has been an increase in revenue which in October 2017 following the EC installation reported 89% increases of its 2016 alcohol revenue. This trend was repeated in November 2017 with a 108% increase over November 2016 and in December 2017 with a 101% increase over December 2016. January 2018 sales were up 107% over January 2017 sales. February 2018 sales were up 83% compared with February 2017, and March 2018 sales were up 128% compared with March 2017. For the 6 months post- installation of the EC this represents an average 102% increase in revenue.
Discussion
This study examined the effects of EC installed in the gate area for a large sample of airport passengers, compared with those at an adjacent gate with traditional Low-e in a functioning commercial airport. The study combined the subjective data of self-reports from interviews with passengers and objective data from video recordings of passenger behavior and economic data from bar revenue.
From passenger interviews, both types of glass façades performed comparably for perceived daylight quality experience, however, results showed that the EC outperformed the traditional glass with fewer reports of daylight glare issues, which affected passenger’s ability to sit at the gate, and access to views or daylight was rated highly as the second factor influencing boarding gate seat choice. Previous work has reported that the quality of the passenger experience correlates with airport spending [3], and current results would seem to confirm this. Suggestive evidence was found that the use of EC also may create a less stressful experience which in turn enhances the passenger experience and which also encourages passengers to spend more money at the airport. The use of EC in the bar area of a bar and restaurant also resulted in a substantial increase in customers and in revenue from patrons.
Although factors such as the departure time of flights and the flight size in terms of numbers of passengers were matched as closely as was practicable, and interviews were only conducted on non-rain days, this field research study was not able to control for differences in seating layout at each of the gates, and the EC gate had 108 seats and a double area of glass, compared with the Low-e gate, which had 54 seats and a single area of glass. In future studies such a difference might be minimized if more boarding gates were available for study.
Given that EC has been shown to improve the visual environment by reducing daylight glare and knowing that is will also reduce solar heat gain, thereby saving money on cooling costs, this is a physical environment modification that can both benefit the airport passenger experience and further reduce the airport’s energy footprint.
Future research on the potential beneficial effects of EC over longer time-periods, on the behavior of passengers along with that of other airport and airline employees, and on airport energy use will be valuable.
Acknowledgement
We thank Andrea Thomas, National Service Research for the market research and Keith Dauson, View Glass, for assistance with the project.
References
-
Aeronewtv (2016) Video - How many commercial airports are there in the world?
-
Airports Council International (2017) ACI Airport Statistics Infographics.
-
Dussart A (2017) Making sense of multiple measurements of passenger satisfaction. Journal of Airport Management: an International Journal 12(1): 36-44.
-
DFW (2018) DFW International Airport Strategic Plan 2016-2020.
-
(2018) DFW Advertising.
-
Adey P (2008) Airports, mobility and the calculative architecture of affective control. Geoforum 39(1): 438-451.
-
Van Oel CJ, van den Berkhof FW (2013) Consumer preferences in the design of airport passenger areas. Journal of Environmental Psychology 36: 280-290.
-
Green Air (2018) Dallas Fort Worth becomes the first North American airport to achieve carbon neutrality. Green Air Online.
-
Weather Spark (2018) Average Weather at Dallas/Fort Worth International Airport.
-
Huizenga C, Zhang H, Mattelaer P, Yu T, Arens E, et al. (2006) Window Performance for Human Thermal Comfort: Final Report to the National Fenestration Rating Council. Center for the Built Environment, University of California, Berkeley, Berkeley, CA 94720-1839.
-
Omar O (2002) Airport retailing: Examining airline passengers’ impulsive shopping behaviour. Journal of Euromarketing 11(1): 87-105.
-
Ulrich RS (1984) View through a window may influence recovery from surgery. Science 224(4647): 420-421.
- The Expanding Landscape of Road Rage: A Systematic Review of Conflicts Involving Drivers, Pedestrians, and Micromobility
- Validating Cognitive Models of Royal Navy Performance on Control Systems
- Comparing Standard and State-of-the-art Firefighter Coats on Postural Balance and Gait in a Live Burn Environment
- Investigating the Integration of Telemedicine into Clinicians Workflow: A Review of Methods
- Risk Assessment of Ergonomic Factors in a Textile Firm by RULA, REBA and Fine Kinney Methods
- Impact of Self-Esteem Training on Individuals with Disabilities Aged 17-30