Low Back Injury Risk among Workers Engaged in LPG Supply Chain
Manual handling of containers may expose workers to physical conditions (e.g., force, awkward postures, and repetitive motions) that can lead to injuries, over consumption of energy and time. Present study evaluates the lifting, lowering and handling of LPG cylinder by the delivery boy of Northern India. Therefore, risk of low back injuries among workers was assessed using NIOSH lifting equation and Lifting Index. The study involved, 40 different workers working in 3 modes of transportation of LPG cylinders via Trucks, 3 wheelers and cycle rickshaw. The results revealed that 100 % of the workers were performing under different levels of risk as reflected by the lifting index (LI) > 1. The study revealed that most contributing factors were horizontal distances of grip. However, no statistically significant difference was found between the lifting tasks performed by the workers of different modes of supply of the cylinders. The study concluded that there is a need to redesign in terms of mechanizing the lifting and lowering tasks.
Introduction
Liquefied Petroleum Gas (LPG) has become the single most popular household fuel. Since it was introduced in 1955, LPG consumption has gone up tremendously. HP Gas has over 33 million domestic LPG consumers catered through a network of over 2630 distributors. India’s demand for LPG has raised drastically due to government measures to provide cleaner cooking fuel to rural households, and expected the consumption to keep rising. About two- thirds of India’s population live in rural areas, typically using firewood, coal or dried dung cakes for cooking. India consumed a record 24.9 million tonnes of LPG in the financial year 2018/19, 53 percent higher than five years ago, and 6.9 percent higher than the previous year. Gas distribution agencies are present all over India providing employment to millions of unemployed workforce in India. The objective of this study is to ergonomically assess the risk of low back injuries (LBI) among the north Indian workers engaged in the distribution/supply of LPG cylinders for domestic use. The LPG distributors in India do not have automation in handling LPG cylinders as their western counterparts so their workers young and old are prone to back injury and pain. Ergonomic interventions are still missing in the lifting / lowering tasks of the workers involved in distribution supply chain of cylinders. It is crucial and beneficial to both management and labor to evaluate such tasks ergonomically based on the 1991 revised NIOSH lifting equations for identifying risk factors that may cause musculoskeletal disorders.
Literature Review
Garg A, et al. (1989) compared maximum permissible limits based on measured horizontal distances with those based on the rule of thumb proposed in the NIOSH guide (H= 15 + W/2 cm). They observed that there were large differences in maximum permissible limits between subjects for a given lifting task caused by differences in horizontal distance. They concluded that there is a considerable variation in the measured H distance among the subjects and this distance is much greater than the rule of thumb proposed in the guide (H= w/2 + 15 cm). Norrish and Cryer [1] reported that two thirds of all musculoskeletal injuries were back strains. Lifting, lowering, loading, or unloading boxes were responsible for over one third of the injuries and 36% of total reimbursement costs. Whereas, Karwowski [2] suggested that the assumptions of a multiplicative effect on the load constant must be examined carefully. Karwowski and Brokaw [2] showed that the 1991 equation was much more restrictive with respect to defining the acceptable jobs in terms of RWL than the older version of the equation (1981). It was showed that more than two thirds of the analyzed tasks exceeded the RWL and would need redesign. Karwowski [3] reported that only 4.17% of the 24 lifting tasks studied were acceptable under the 1983 guide if the criterion of LI = 1.0 is adopted. The compression force design limit of 3400 N was exceeded in 62.5% of all tasks whereas the upper (permissible) limit of 6400 N was exceeded in 16.67% of the tasks. Karwowski and Gaddie [4] used a computer simulation model to examine the behavior of the 1991 revised NIOSH lifting equation under variety of realistic industrial lifting tasks. The results indicate that under most of the examined lifting conditions (99.5% of the simulated cases), one can reasonably expect that an implementation of the 1991 lifting equation at the level of the Lifting Index of 1.0, which is designed to protect 90% of the mixed industrial working population, would necessitate redesign of manual lifting tasks according to threshold RWL (TRWL) values. The TRWL values are equal to or lower than (a) 13.0 kg for up to 1 hr of lifting, (b) 12.5 kg for less than 2 hrs of exposure, (c) 10.5 kg for lifting over an 8-hr shift [5]. Auguston [6] reported that that the dynamic motion in lifting tasks is associated with an increased risk of low back injury. Whereas, the NIOSH equations are based on models that do not take into account motions of the trunk, namely angular position, velocity, and acceleration during lifting tasks. Therefore, NIOSH equation may not correctly determine the risk level of a given task. Nussbaum [7] investigated the form of the asymmetric multiplier through analysis of several asymmetric lifting tasks. The results suggest that there is a non-linear increase in injury risk with respect to asymmetry. Only moderate increases in risk were predicted for asymmetry angle of 0–30 degrees, and sharp increasing risk as asymmetry reaches 90 degrees. This is contrary to the form of the asymmetric multiplier as suggested by NIOSH
1991 guidelines, which assumed a linear increase with an increased angle of asymmetry. Lee Park, Chun [8] evaluated the validity of the load constant for the Korean population using the psychophysical approach. According to their results, the maximum acceptable weight of lift for 99percent of the young Korean male population was extremely close to the 23-kg load constant recommended in the revised NIOSH equation. Leskinen and Haijanen [9] conducted a biomechanical validation study using human factors modeling software (Jack). Those investigators applied the software not only to model the lifting posture but also to calculate the lumbosacral (L5/S1) torque. Their results confirmed a significant correlation between torque index and LI (r = .77). The torque index was defined as the ratio between the lumbosacral torque and 200 Nm. Wang [10] conducted a survey to evaluate the relation between low- back discomfort ratings and the use of revised NIOSH lifting guide to assess the risk of manual materials handling (MMH) tasks. Ninety-seven MMH jobs of 15 factories were included, 42 of the 97 jobs analyzed had a recommended weight limit of zero, which was attributed to either a horizontal distance or lifting frequency. Apparently, the limits for the horizontal distance and the maximum allowable frequency are too stringent to accommodate many existing MMH jobs, therefore, resulted in many out-of-bounds cases. Jager and Luttmann [11] investigated the rationale behind the introduction of the 3400 N compression force on the lumbo-sacral disc by NIOSH 1991 guidelines. They reported that, regarding this biomechanical criterion, several inconsistencies and discrepancies are revealed when comparing the NIOSH validation approaches and the respective data of the literature sources. Dempsey and Fathallah [12] investigated the reduction in the recommended weight limit (RWL) w.r.t. the presence of asymmetry in the lifting tasks. There was 8.8 % and 5.1 % reduction in RWL when the angle of asymmetry changes from 30o to 60o and from 60o to 90 o respectively. The results pointed out to the need of re addressing the form of the asymmetric multiplier as suggested by NIOSH guidelines. Gerri F and Mani L [13] studied the work related low back pain. Occupational risk factors for low back pain include forceful lifting, bending and twisting of the trunk, whole body vibration and heavy manual labor. For those with simple low back pain, minimal use of medical tests and quick return to limited activity, whereas, to prevent long-term low back pain work modification were suggested. Chaffin DB [14] described how injurious stresses on the low back can be predicted by such biomechanical models during the early phases of designing materials handling tasks in industry. These simulations provide a scientific basis for specific ergonomics guidelines meant to reduce the risk of future low back pain in industry. Singh S [15] investigated the effectiveness of mechanical lifting aid in single task lifting of fire brick manufacturing company. In mechanically assisted lifting it is observed that for 10 and 15 kg there was decrease in task time and physical stress associated with lifting. In 20 kg lifting it was recommended that the load should be shared between two workers. Singh LP [16] reported the association between the low back injury risk and work factors in small scale casting firms of North India. The results of the study revealed that 85% of the workers were performing their tasks with a risk of injury to the lower back, while 15 % of the workers were working safely. It was observed that out of the 85 % workers, 38.23 % were under low risk, 32.35 % of workers were under medium risk and 29.41 % of the workers were under high risk.
Methodology
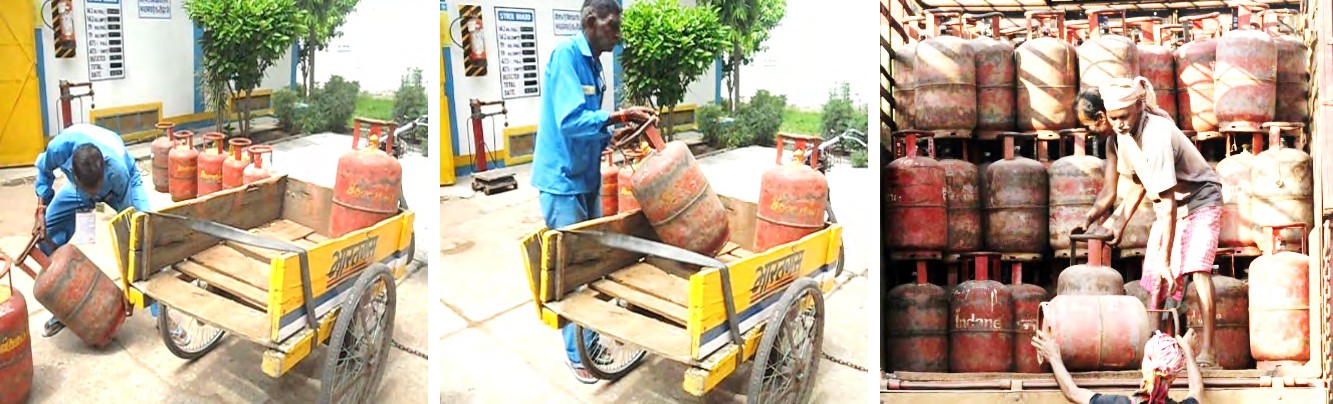
The Study included 40 delivery workers engaged in cylinder lifting, lowering and handling job. The data collection was performed on actual onsite locations, for each worker 10 observations were made. The data was analyzed using revised NIOSH lifting equation (1991). Both filled and empty cylinders were considered as tasks. Significant control was not required at the destination for the cylinder lifting / lowering as precise placement was not required in the tasks involved. Recommended weight limits (RWL) and lifting index (LI) was calculated at the origin and destination of the cylinder handling task. Table 1 below lists the cylinder handling jobs analyzed in each of the three category of mode of supply of cylinder [17, 18, 19, 20, 21, 22, 23].
| Mode of cylinder supply | No of Jobs Analyzed |
| Truck | 12 |
| Auto-rickshaw (Three Wheeler) | 18 |
| Cycle Rickshaw | 10 |
Table 1: No of worker analyzed.
Procedural Steps to Calculate the LI using NIOSH Lifting Equation
• Step 1: Measure and Record Task Variables For each lifting task analyzed, the evaluator will need to determine the task variables as outlined below. The following task variables are evaluated to calculate the multipliers that are used in the NIOSH equation to determine the RWL.
1) Horizontal Location of the Hands (H) The horizontal location is measured as the distance (inches) between the employee’s ankles to a point projected on the floor directly below the mid-point of the hands grasping the object. In those situations, where the H value cannot be measured then H may be approximated from the following equation: Metric: H= 20 + W/2 for V ≥ 25cm and H= 25 + W/2 for V< 25cm US Customary: H=8 + W/2 for V ≥ 10 inches H=10 + W/2 for V< 10 inches W is the width of cylinder in the sagittal plane and V is the vertical location of the hands from the floor. Horizontal restriction: If the horizontal distance is less than 10 inches (25cm) then H is set to 10 inches. Although cylinders can be carried or held closer than 10 inches from the ankles, most objects that are closer than this cannot be lifted without encountering interference from the abdomen or hyper extending the shoulders. With 25 inches as the maximum value of H, cylinders at a distance of more than 25 inches from the ankles normally cannot be lifted vertically without loss of balance.
2) Vertical Location of the Hands (V) The vertical location is measured from the floor to the vertical mid-point between the two hands as shown below. The middle knuckle can be used to define the mid-point. Vertical location is limited by the floor surface and the upper limit of vertical reach for lifting (70 inches or 175 cm). The vertical location should be measured at the origin and destination of the lift to determine the travel distance (D).
3) Vertical Travel Distance (D) It is defined as the vertical travel distance of the hands between the origin and destination of the lift. The vertical travel distance of a lift is determined by subtracting the vertical location (V) at the start of the lift from the vertical location (V) at the end of the lift. For a lowering task, subtract the V location at the end from the V location at the start. The variable (D) is assumed at least 10 inches and not greater than 70 inches.
4) Asymmetric Angle (A) Asymmetry refers to a lift that begins or ends outside the mid sagittal plane. Measure the degree to which the body is required to twist or turn during the lifting task. The asymmetric angle is the amount (in degrees) of trunk and shoulder rotation required by the lifting task. The angle A is limited to the range from 00 to 1350.
5) Coupling (C) Determine the classification of the quality of the coupling between the worker’s hands and the object as good, fair, or poor (1,2, or 3). A good coupling will reduce the maximum grasp forces required and increase the acceptable weight for lifting, while a poor coupling will generally require higher maximum grasp forces and decrease the acceptable weight for lifting. A worker should be able to comfortably wrap the hand around the object without causing excessive wrist deviations or awkward postures and grip should not require excessive force.
6) Lifting Frequency (F) Lifting frequency refers to average number of lifts per minute. For lifting tasks with a frequency less than 0.2 lifts per minute, set the frequency equal to 0.2 lifts per minute Lifting frequency depends on the vertical location of the object (V) and the duration of lifting.
- Minimum is 0.2 lifts/minute
- Maximum is 15 lifts/minute.
7) Load (L) Determine the weight of the object lifted. If necessary, use
a scale to determine the exact weight. If the weight of the load varies from lift to lift, you should record the average and maximum weights lifted.
8) Duration Determine the lifting duration as classified into one of three categories: 1 = Short – lifting ≤ 1 hour 2 = Moderate - lifting between 1 and 2 hours 3 = Long – lifting between 2 and 8 hours
• Step 2: Calculate the Multipliers Each multiplier should be computed from the appropriate formula from the table. The Table 2 calculates the multipliers, penalties, or reduction coefficients using the task variables.
| Metric | US. Customary | ||
|---|---|---|---|
| Load Constant | LC | 23 kg | 51 lbs. |
| Horizontal Multiplier | HM | ( 25/ H ) | ( 10/H ) |
| Vertical Multiplier | VM | 1- ( 0.003|V-75| ) | 1- ( 0.0075 |V-30| ) |
| Distance Multiplier | DM | 0.82 + ( 4.5 / D ) | 0.82 + ( 1.8 / D ) |
| Asymmetric Multiplier | AM | 1- ( 0.0032 A ) | 1- ( 0.0032 A ) |
| Frequency Multiplier | FM | See Appendix Table (A) | |
| Coupling Multiplier | CM | See Appendix Table (B) |
Table 2: Multiplier Equations. Source: Revised NIOSH Lifting Equation (1991)
- Step 3: Calculate the RWL using the NIOSH lifting equation
- Step 4: Conduct the risk assessment by calculating the LI for the cylinder lifting/lowering task.
Lifting task limitation The lifting equation is a tool for assessing the physical stress of two-handed manual lifting tasks. As with any tool, its application is limited to those conditions for which it was designed. Specifically, the lifting equation was designed to meet specific lifting related criteria that include biomechanical, work physiology, and psychophysical assumptions and data.
Results and Discussion
The descriptive demographic data and statistics regarding the workers and their historical exposure in their current cylinder distribution jobs are shown in table 3. The workers average age was around 34 years and their average exposure time (Cylinder supply job experience) was slightly more than 7.5 years. The average weight they handled was 25.8 kg. The weight of the cylinder handled ranged from 16 kg (empty cylinder) to 38 kg.
| Mean | S.D | Range | |
|---|---|---|---|
| Age(years) | 33.92 | 12.15 | 18-63 |
| Body Height (cm) | 171.42 | 4.0 | 163-180 |
| Body Weight (kg) | 77.95 | 7.37 | 62-95 |
| Job experience (years) | 7.67 | 5.44 | 2-25 |
| Weight Lifted (kg) | 25.815 | 7.47 | 16-30.2 |
Table 3: Physical and Demographic statistics for worker.
19 out of the 40 workers reported that they experienced no low back pain and rest 21 workers reported lower back disorder due to handling of cylinders. This finding reveals that the validity of their back discomfort should be high. Table 4 gives an overview for evaluation of results of LI and the potential risk involved in the cylinder-handling job.
| Potential Risk Level | Action Required | Physical stress of job task | |
|---|---|---|---|
| 0-1 | No | No | Not stressful |
| 1-2 | Low | Yes | Moderately stressful |
| 2-3 | Medium | Yes | Highly stressful |
| >3 | High | Yes | Very Highly stressful. Ergonomic intervention and job redesign required |
Table 4: Risk associated with the lifting index.
Overall Lifting Index (LI)
As for the evaluation results of LI for the worker is concerned, all worker was found working unsafe with LI > 1, out of 40 workers, 9 (22.5%) were found with LI between
1-2, whereas 13 (32.5%) workers had 2- 3, and rest of the 18 (45%) workers had LI > 3. The overall Lifting Index of sample group varied from 1.26 to 8.35. The results of Lifting Index are shown in Table 5 shows that all the cylinder-lifting workers are at risk.
| 0-1 | 1-2 | 2-3 | >3 | |
|---|---|---|---|---|
| Truck | 0 | 3 | 2 | 7 |
| Auto Rickshaw (Three Wheeler) | 0 | 5 | 7 | 6 |
| Cycle Rickshaw | 0 | 1 | 4 | 5 |
| Total | 0 | 9 | 13 | 18 |
| % | 0 | 22.5 % | 32.5 % | 45 % |
Table 5: Overall worker percentage wise lifting indexes.
Overall Multipliers
As for evaluation of multipliers Table 6 shows that the multipliers with the smallest magnitude and the greatest penalties are horizontal multiplier (HM = 0.62), vertical multiplier (VM = 0.86) and asymmetric angle multiplier (AM=0.89). The HM was the critical variable which contributed towards higher and unsafe LI as it contributed for the maximum reduction in RWL. Vertical multiplier (VM) was the next critical variable contributing to the reduction in load constant which increased the lifting index followed by AM, FM, DM, CM.
| Multipliers | HM | VM | DM | AM | FM | CM |
|---|---|---|---|---|---|---|
| Mean | 0.62 | 0.86 | 0.90 | 0.89 | 0.90 | 0.99 |
| S.D | 0.16 | 0.079 | 0.03 | 0.082 | 0.14 | 0.013 |
Table 6: Overall Mean Value of Multipliers for all the modes of cylinder supply.
Mean Lifting Index Mode Wise
The Overall Mean Lifting Index of sample group was 3.14. The range and mean LI for different modes of cylinder supply are shown in the Table 7. The truck workers LI varied from 1.41 to 8.35 with a mean of 3.62. LI for 3 Wheeler workers varied from 1.26 to 4.21 with a mean of 2.73. For cycle rickshaw workers the LI varied from 1.64 to 4.56 with a mean of 3.29.
| Mode of cylinder supply | Minimum (LI) | Maximum (LI) | Mean (LI) |
|---|---|---|---|
| Truck | 1.41 | 8.355 | 3.62 |
| Auto Rickshaw (Three Wheeler) | 1.26 | 4.21 | 2.73 |
| Cycle Rickshaw | 1.64 | 4.56 | 3.29 |
Table 7: Mean and range of lifting index.
Group Wise LI Distribution
Truck Workers: The main job profile of the truck workers involved in distribution of cylinders is unloading of filled cylinders whose weight range from 30.2 kg (domestic) and 38 kg (commercial) and loading of empty cylinders whose weight range from 16 kg to 19 kg, received back from the consumers. Around 58.33% of workers engaged in cylinder distribution from trucks were found under high risk as reflected in LI>3, whereas, 16.67 % proportion of workers were found with LI, 2-3 relatively lower risk, and rest of 25 % of these workers were found under low risk and whereas none of these workers were working safely. The Lifting Index of Truck workers varied from 1.41 to 8.35, the same is shown in Table 8.
| Lifting Index (LI) | 0-1 | 1-2 | 2-3 | >3 |
|---|---|---|---|---|
| No of Truck Workers | 0 | 3 | 2 | 7 |
| Percentage of workers (%) | 0 % | 25 % | 16.67 % | 58.33 % |
| No of three Wheeler Workers | 0 | 5 | 7 | 6 |
| Percentage of workers (%) | 0 % | 27.77 % | 38.88 % | 33. 33 % |
| No of Cycle Rickshaw Workers | 0 | 1 | 4 | 5 |
| Percentage of Workers % | 0 % | 10 % | 40 % | 50 % |
Table 8: Distribution of LI for truck workers.
Three Wheeler Workers: The job profile of the 3 wheeler includes loading and unloading the 3 wheelers with cylinders as per the requirement from the customers. The three-wheeler (auto rickshaw) workers provided door-to- door supply to the customers. Around 33.33 % of workers engaged in cylinder distribution from 3 Wheelers were found under high risk, 38.88 % proportion of workers were found under medium risk, 27.77 % of these workers were found under low risk and whereas no worker was working safely. The Lifting Index of 3wheeler workers varied from 1.26 to 4.21. Table 8 shows the distribution of 3 wheeler workers.
Cycle Rickshaw Workers: Cycle rickshaw workers were involved in loading and unloading of cylinders to be delivered to the customers for a particular area from the distributor’s go down. Around 50 % of workers engaged in cylinder distribution from cycle rickshaw for door to door delivery of cylinders were found under high risk, 40 % proportion of workers were found under medium risk, 10 % of these workers were found under low risk and whereas 0 % of these workers were working safely. The Lifting Index of cycle rickshaw workers varied from 1.64 to 4.56. Table 8 shows the distribution of LI for cycle rickshaw workers [23, 24, 25, 26, 27, 28, 29, 30, 31, 32, 33].
Group Wise Multiplier Analysis
For Truck workers, the major variables which were penalized for their high Lifting Index were HM=0.63 (Mean) and FM = 0.68 (mean). Hence it is suggested that, if the frequency of lifts/min ‘F’ and horizontal distance ‘H’ both should be reduced, the Lifting Index will be reduced and workers will be working under safe condition. Similarly, for the auto rickshaw mode workers, the major parameters which penalized for their high Lifting Index are HM= 0.63 (mean), VM= 0.84(mean) and AM = 0.85 (Mean). Hence, it is suggested that the horizontal distance H should be decreased and twisting should be reduced so that the Lifting Index may be reduced and workers will be working safely. For cycle Rickshaw workers the major parameters which were penalized for their high Lifting Index are HM= 0.58(mean) and VM= 0.84 (mean). Hence, it is suggested that the horizontal distance ‘H’ needs to be reduced for reducing the Lifting Index and making the task risk free.
| Multipliers | HM Mean | VM Mean | DM Mean | AM Mean | FM Mean | CM Mean |
|---|---|---|---|---|---|---|
| Truck | 0.63 | 0.90 | 0.88 | 0.90 | 0.68 | 0.99 |
| Auto Rickshaw (Three Wheeler) | 0.63 | 0.84 | 0.89 | 0.85 | 1 | 0.99 |
| Cycle Rickshaw | 0.58 | 0.841 | 0.94 | 0.93 | 1 | 0.99 |
Table 9: Multiplier Mean cylinder supply mode wise.
Statistical Analysis of Data
Analysis of variance (ANOVA): Analysis of variance is used to analyze the differences between group means and their associated procedures (such as “variation” among and between groups), developed by R.A. Fisher. In its simplest form, ANOVA provides a statistical test of whether or not the means of several groups are equal. The ANOVA test applied on the data of LI of all the three modes of transportation with the null hypothesis that there is no significant difference between the LI of workers of the 3 modes of transport. The results are shown in the Table 10.
| Source of Variation | Degrees of Freedom | SS | MSS | F Ratio |
|---|---|---|---|---|
| Between groups | 3-1 =2 | SSC = 5.99 | 5.99/2= 2.995 | F=2.995/1.8475= 1.621 |
| Within groups | 40-3 = 37 | SSE = 68.36 | 68.36/37= 1.8465 | - |
| Total | 39 | 74.36 |
Table 10: ANOVA Test result.
Table Value (Critical value): F (2, 37) = 3.25. Since 1.621 < 3.25, we accept the null hypothesis that there is no significant difference between the Lifting Index of Truck, 3 wheeler and Cycle rickshaw modes of cylinder supply workers.
Conclusion
Analysis of the results concludes that there is a need to redesign the job task. The workers of the cylinder distributors should lift the cylinder close to the body so that the horizontal distance is reduced. If possible, mechanical aid or low-cost automation may be provided for lifting of cylinders. The weight of the cylinder should be reduced by using cylinders with less LPG gas or cylinders should be made of lighter material.
The results also show that 100 % workers are at a risk of developing low back pain with 45 % of the workers having unsafe LI>3. The overall mean LI of sample is 3.14, which suggests that cylinder-lifting job is physically highly stressful. Hence, ergonomic intervention is required. Around 52.5 % of the workers reported lower back pain. Hence, there is a strong need to educate the workforce of these distributors of cylinders regarding the critical risk factors due to weight of cylinder and consequently the risk of low back injuries.
The Truck workers need to decrease the horizontal distance while handling the cylinders and decrease the frequency of lifting the cylinders. The distributors should provide more truck workers for the handling cylinder jobs. The destination of the lift should be reduced. The vertical distance between the origin and the destination should be reduced to increase the distance multiplier and reduce the lifting index. Similarly, auto-rickshaw mode workers also need to handle cylinders close to the body and lower the height of lifting the cylinder. The cycle rickshaw mode workers should also need to decrease the horizontal distance while handling the cylinders as horizontal multiplier is having the maximum reduction in the load constant as compared to other modes of distribution supply.
It is recommended to optimize the rest of the variable appropriately so that LI is reduced. The main reason for existing low back pain and LBI risk is lack of awareness and guidance of the tasks undertaken is. Ergonomic interventions are necessary to prevent the complaints of low back pain and MSDs of the cylinder lifting workers so that they work in a hazard free and friendly environment.
Future Scope
The present study was limited to the workers involved in handling and delivery of LPG cylinders for the distributors of various natural gas dealers/companies. The study can be further extended through the posture analysis of workers involved at the manufacturing and distribution of LPG cylinders and various depots of oil marketing companies where large number of workers is involved in manual lifting activities. Similar studies could be performed for a large number of workers at gas distributors in south, east, and west India and assess the risk associated with the handling of cylinders.
References
-
Auguston A (1995) Does the NIOSH lifting equation add up? Modern Materials Handling 12: 51-53.
-
Ayoub M, Bethea N, Dievanayagm S, Asfour S, Bakken G, et al. (1978) Final report: Determination and modeling of lifting capacity. Unpublished manuscript, Texas Tech University, Institute of Ergonomic Research, Lubbock, TX, USA.
-
Bobick T (1997) The effects of lifting height and asymmetry on maximum acceptable Weight of lift, average heart rate, and estimated biomechanical loading to the lumbar Spine. Unpublished doctoral dissertation, West Virginia University, USA.
-
Brinham C, Garg A (1983) The role of biomechanical job evaluation in the reduction of overexertion injuries. In 23rd Annual American Industrial Hygienists Association Conference, American Industrial Hygiene Association Press, Fairfax, VA, USA, pp: 138-144.
-
Chaffin J, Page G (1993) Postural effects on biomechanical and psychophysical weight Lifting limits. Ergonomics 37(4): 663-676.
-
Chaffin DB (2005) Primary prevention of low back pain through the application of biomechanics in manual materials handling tasks.GItal Med LavErgon. University of Michigan, Ann Arbor 48109-2117, USA, 27(1): 40-50.
-
Dempsey P, Fathallah F (1999) Application issues and theoretical concerns regarding The 1991 NIOSH equation asymmetry multiplier. International J Industrial Ergonomics 23(3): 181-191.
-
Elfeituri F, Taboun S (1999) The effects of working in restricted workspaces on lifting Capacity. In G Lee, (Ed.), Advances in occupational ergonomics and safety, Amsterdam, The Netherlands, IOS Press, pp: 95-100.
-
Gerri F, Mani L (2000) Work-related low back pain Prim Care, Department of Environmental and Occupational Health, Rollins School of Public Health, Emory University, Atlanta, Georgia, USA 27(4): 865-876.
-
Genaidy A, Karwowski W, Christensen D, Vogiatzis C, Deraisheh N, et al. (1998) What is ‘heavy’? Ergonomics 41: 420-432.
-
Hidalgo J, Genaidy A, Karwowski W, Christensen D, Huston R, et al. (1995) A cross-validation of the NIOSH limits for manual lifting. Ergonomics 38(12): 2455-2464.
-
Hidalgo J, Genaidy A, Karwowski W, Christensen D, Huston R, et al. (1997) A comprehensive lifting model: Beyond the NIOSH lifting equation. Ergonomics 40(9): 916-927.
-
Honsa K, Vennettilli M, Mott N, Silvera D, Niechwiej E, et al. (1998) The Efficacy of the NIOSH (1991) hand- to-container coupling factor. In Proceedings of the 30th Annual Conference of the Human Factors Association of Canada, Human Factors Association of Canada, Canada, pp: 253-158.
-
Jager M, Luttmann A (1999) Critical survey on the biomechanical criterion in the NIOSH method for the design and evaluation of manual lifting tasks. Int J Industrial Ergonomics 23(4): 331-337.
-
Karwowski W (1992) Comments on the assumption of multiplicity of risk factors in the Draft revisions of NIOSH lifting guide. In: Kumar S, (Ed.), Advances in industrial ergonomics and safety IV, Taylor & Francis, London, UK, pp: 905-910.
-
Karwowski W, Brokaw N (1992) Implications of the proposed revisions in a draft of The revised NIOSH lifting guide (1991) for job redesign: A field study. In Proceedings Of the 36th Annual Meeting of the Human Factors Society. Human Factors Society, Santa Monica, CA, US, pp: 659-663.
-
Karwowski W, Caldwell M, Gaddie P (1994) Relationships between the NIOSH (1991) lifting index, compressive and shear forces on the lumbosacral joint, and low Back injury incidence data based on industrial field study. In Proceedings of the Human Factors and Ergonomics Society 38th Annual Meeting, Human Factors Society, Santa Monica, CA, USA, pp: 645-657.
-
Karwowski W, Gaddie PR (1995) Simulation of the 1991 revised NIOSH manual lifting Equation. In Proceedings of the Human Factors and Ergonomics Society 39th Annual Meeting. Human Factors and Ergonomics Society, Santa Monica, CA, USA, pp: 699-701.
-
Karwowski W, Gaddie P, Jang R, GeeLee W (1999) A population-based load Threshold limit (LTL) for manual lifting tasks performed by males and females. In: Karwowski W, Marras WS, (Eds.), The occupational ergonomics handbook. CRC Press, Boca Raton, FL, USA, pp: 1063-1074.
-
Karwowski W, Pongpatanasuegsa N (1991) Linguistic interpretation in human categorization of load heaviness. In Proceedings of the 11th Congress of the International Ergonomics Association, Taylor & Francis, London, UK, pp: 425-427.
-
Leskinen T, Haijanen J (1996) Torque on the low back and the weight limits Recommended by NIOSH in simulated lifts. In Proceedings of the 4th International Symposium on 3-D Analysis of Human Movement, Université Joseph Fourier, Grenoble, France.
-
Lee KS, Park HS, Chun KS (1996) The validity of the revised NIOSH weight limit in a Korean young male population: A psychophysical approach. International Journal of Industrial Ergonomics 18(2-3): 181-186.
-
Mital A (1984) Maximum weight of lift acceptable to male and female industrial workers for extended work shifts. Ergonomics 27(11): 1115-1126.
-
Mital A, Ramakrishnan A (1999) A comparison of literature-based design recommendations and experimental capability data for a complex manual materials handling activity. International Journal of Industrial Ergonomics 24(1): 73-80.
-
Min K Chung, Dohyung Kee (2000) Evaluation of lifting tasks frequently performed during fire brick manufacturing processes using NIOSH lifting equations. International J Industrial Ergonomics 25(4): 423-433.
-
Nussbaum M, Chaffin D, Page G (1995) A biomechanical investigation of the Asymmetric multiplier in the revised NIOSH lifting equation. In Proceedings of the Human Factors and Ergonomics Society 39th Annual Meeting, Human Factors and Ergonomics Society, Santa Monica, CA, USA, pp. 709-713.
-
Norrish A, Cryer P (1990) “Work related injury in New Zealand commercial Fishermen.” British Journal of Industrial Medicine 47(11): 726-732.
-
Snook S, Ciriello V (1991) The design of manual handling tasks: Revised tables of maximum acceptable weights and forces. Ergonomics 34(9): 1197-1213.
-
Singh S, Kumar S (2010) The effect of mechanical lifting aid insingle task lifting using revised niosh lifting equation. International Journal of Advanced Engineering Technology 1(2): 165-172.
-
Singh LP (2013) Prevalence of low back injury risk due to manual lifting tasks among small scale casting industry workers. Wyno Academic J Engineering Technology Research 1(3): 30-36.
-
Wang M, Garg A, Chang Y, Shin Y, Yeh W, et al. (1998) The relationship between low back discomfort ratings and the NIOSH lifting index. Human Factors 40(3): 509-515.
-
Waters T, Putz-Anderson V, Garg A, Fine L (1993) Revised NIOSH equation for the design and evaluation of manual lifting tasks. Ergonomics 36(7): 749-776.
-
Wright E, Haslam R (1999) Manual handling risks and controls in a soft drinks distribution center. Applied Ergonomics 30(4): 311-318.
- The Expanding Landscape of Road Rage: A Systematic Review of Conflicts Involving Drivers, Pedestrians, and Micromobility
- Validating Cognitive Models of Royal Navy Performance on Control Systems
- Comparing Standard and State-of-the-art Firefighter Coats on Postural Balance and Gait in a Live Burn Environment
- Investigating the Integration of Telemedicine into Clinicians Workflow: A Review of Methods
- Risk Assessment of Ergonomic Factors in a Textile Firm by RULA, REBA and Fine Kinney Methods
- Impact of Self-Esteem Training on Individuals with Disabilities Aged 17-30