Phytoplankton Diversity in Bangalore Lakes, Importance of Climate Change and Natures Benefits to People
<p>Studies were carried out during the monsoon of 2017 to observe the percentage of phytoplankton in two lakes namely Nirmalagiri Lake & Kengeri Lake in Bangalore. The work gains importance due to long incubation period and scanty rains. Present studies Aims to understand the positive implication of Climate Change and Nature’s Benefits to People, and to analysis the distribution of phytoplankton which was influenced after a continuous rain for six months. In these two lakes seven groups of phytoplankton has been observed, which belong to group Chlorophyceae, Euglenophyceae, Bacillariophyceae, Cyanophyceae, Charophyceae, Dynophyceae. Out of which 6 groups were found in Kengeri Lake while 4 groups were found in Nirmalagiri Lake. The percentage of phytoplankton in Nirmalagiri Lake is 63.28% while the percentage of phytoplankton in Kengeri Lake is 36.71%. In case of Nirmalagiri Lake the percentage has been calculated for different groups. The percentage of Chlorophyceae is 86.12%, while Euglenophyceae is 0.90%, Bacillariophyceae is 5.85%, Cyanophyceae is 7.11% and incase of Kengeri Lake Chlorophyceae is 76.55%, Euglenophyceae is 1.24%, Bacillariophyceae is 7.14%, Cyanophyceae is 12.57%, Charophyceae is 2.32%, Dinophyceae is 0.15%. Chlorophyceae was the most dominating group in the both lakes. The diversity indices of the phytoplankton were found using “PAST†software.</p>
Introduction
Nature and its contributions to a good quality of life are often perceived and valued by people in starkly different and often conflicting ways. Co-construction of assessments of the state of the world’s biodiversity and the benefits it provides to humans Phytoplankton are at the base of aquatic food webs and of global importance for ecosystem functioning and services. The dynamics of these photosynthetic organisms are linked to annual fluctuations of temperature, water column mixing, resource availability and consumption. Biodiversity means the variability among all living organisms in a particular ecosystem. Ecological impacts of recent climate change on ecosystems worldwide. A major challenge in climate change research on phytoplankton succession is to understand the multiple factors, which drive ecological changes in phytoplankton communities. Climate can modify environmental factors and alter phytoplankton structure, seasonal dynamics, and taxonomic composition.
Journal of Ecology & Natural Resources
Studies of the ecology of lake phytoplankton have provided a wealth of insight into the interactions between abiotic factors and biotic ones such as competition and predation. Theoretical investigations into the effect of lake thermal stratification on phytoplankton communities have been especially fruitful have provided predictions for the occurrence of plankton blooms among others [1, 2, 3]. The continuous heavy rainfall that occurred in Bangalore from June 2017 to November 2017 lead to stratification beginning to diminish completely and rain water mixed in the lake and produced a high concentration of Dissolved Oxygen (DO). Heavy rainfall accelerated the formation of an anoxic zone at the bottom of the Lake and promoted Chlorophyceae and other phytoplanktons due to the high nutrient input and the increased water temperature. Heavy rainfall influences the dynamics of phytoplankton in lake. Growth of phytoplankton is influenced by the presence of limiting nutrient caused by inflow of freshwater. Limiting nutrient of phytoplankton growth was nitrogen on little volume of freshwater inflow. However, the limiting nutrient was changed from nitrogen to phosphorus after heavy rain. This may be due to the high inflow of freshwater containing dissolved inorganic nitrogen and phosphorous.
Some notable studies on phytoplankton diversity have been made by Ariyadej, et al.; Mishra, et al.; and Joseph and Yamakanamardi [4, 5, 6]. According to Pawar, et al. the Present plankton study is useful tool for the assessment of biotic potential and contributes to overall estimation of basic nature and general economic potential of water body [7].
Material and Methods
Study Site
The lakes of Bangalore occupy about 4.8% of the city’s geographical area (640 Sq. Km.) covering both urban and rural areas. The present study was done in the lakes (Figures 1 & 2) both are situated in Kengeri urban area and its geographical coordinates are 12°54' 0" North, 77°29' 0" East. The lakes are predominantly rain fed and are used for irrigation, agriculture and fish culture etc., Due to its high elevation of 900 m (3,000 ft) above sea level, Bangalore usually enjoys a more moderate climate throughout the year, although occasional heat waves can make summer somewhat uncomfortable. Winter temperatures rarely drop below 14°C (57°F), and summer temperatures seldom exceed 36°C (97°F).
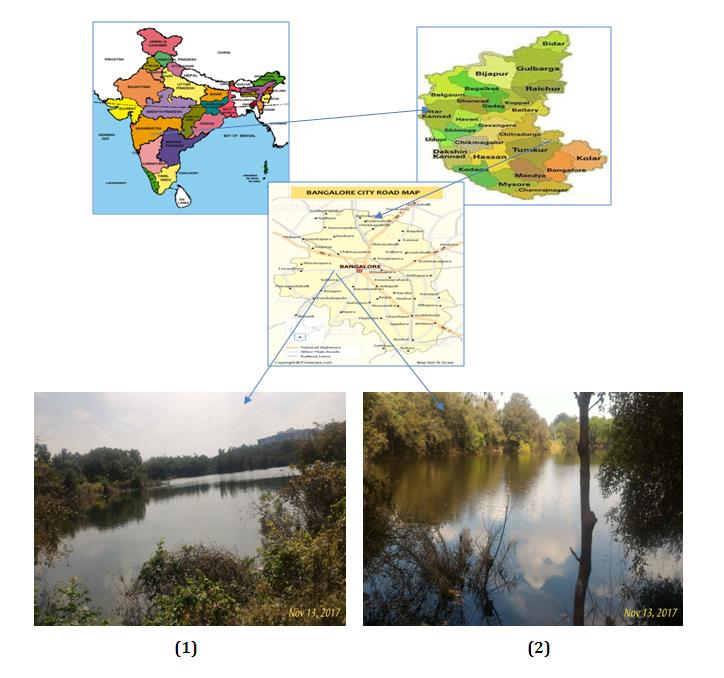
Figure1: Nirmalagiri Lake. Figure 2: Kengeri Lake.
Journal of Ecology & Natural Resources
Sampling
The sampling was done during the monsoon months of year 2017 from two lakes (Nirmalgiri and Kengeri). Collection of phytoplankton samples was made by sieving 25 litres of habitat water from approximately 10 ‐ 12 cm below the surface level passed through a 25 μm mesh net and the collected samples were transferred to 1litre capacity plastic bottles. Then the samples which were collected was allowed to centrifuge to concentrate and made up to 100ml after removing the surface water in the centrifuging tube. The population of plankton accumulated in the container were then transferred to other bottle and immediately preserved in Lugol’s Iodine solution, labeled and then transferred to laboratory for further experimentation. Each sample was stirred smoothly just before microscope examination. One ml from agitated sample was transfer to a Sedge‐wick Rafter counting cell with a wide mouth graduated pipette. The abundance of plankton was estimated by counting their presence per focus of the microscopic field. Plankton were identified by using the keys of Lloyd M and RJ Ghelardi 1964, Needham JG and PR Needham 1966, Bhouyain AM and SM ASMAT 1992 and Ali S and T Chakrabarty 1992 [8, 9, 10, 11].
Results and Discussion
The results of the phytoplankton in the two lakes are presented in Table 1 the abundance and percentage composition of phytoplankton in two lakes are presented in Table 2 and the calculated diversity indices are presented in Table 3. Figure 3 show the microphotographs of phytoplankton in Nirmalagiri lake and Kengeri lake.
| Group | Nirmalagiri Lake | Kengeri Lake | ||||||||||
|---|---|---|---|---|---|---|---|---|---|---|---|---|
| CHLOROPHYCEAE | Organisms/ml | Organisms/L | % age Composition | Cells/ml | Organisms/L | % age Composition | ||||||
| Chlamydomonas sp. | 20 | 80,000 | 2.09 | 14 | 56,000 | 2.83 | ||||||
| Gonium formosum | 02 | 8000 | 0.20 | 01 | 4000 | 0.20 | ||||||
| Volvox sp. | 156 | 6,24,000 | 16.31 | 70 | 2,80,000 | 14.19 | ||||||
| Sphaerocystis sp. | 00 | 00 | 00 | 01 | 4000 | 0.20 | ||||||
| Elakatothrix gelatinosa | 189 | 7,56,000 | 19.76 | 72 | 2,88,000 | 14.60 | ||||||
| Schroederia sp. | 00 | 00 | 00 | 01 | 4000 | 0.20 | ||||||
| Pediastrum simplex | 195 | 7,80,000 | 20.39 | 78 | 3,12,000 | 15.82 | ||||||
| Coelastrum sp. | 30 | 1,20,000 | 3.13 | 16 | 64,000 | 3.24 | ||||||
| Chlorella sp. | 54 | 2,16,000 | 5.64 | 12 | 48,000 | 2.43 | ||||||
| Clostridium sp. | 04 | 16,000 | 0.41 | 08 | 32,000 | 1.62 | ||||||
| Selenastrum sp. | 92 | 3,68,000 | 9.62 | 42 | 1,68,000 | 8.51 | ||||||
| Kirchaneriellah sp. | 00 | 00 | 00 | 05 | 20,000 | 1.01 | ||||||
| Scenedesmus sp. | 06 | 24,000 | 0.62 | 04 | 16,000 | 0.41 | ||||||
| S. Dimerphus sp. | 01 | 4000 | 0.10 | 02 | 8000 | 0.40 | ||||||
| S. bijugarus sp. | 07 | 28,000 | 0.73 | 04 | 16,000 | 0.81 | ||||||
| S. obliquus sp. | 07 | 28,000 | 0.73 | 05 | 20,000 | 1.01 | ||||||
| Phytoconosis sp. | 70 | 2,80,000 | 7.32 | 89 | 3,56,000 | 18.05 | ||||||
| Nostoc muscorum | 28 | 1,12,000 | 2.92 | 13 | 52,000 | 2.63 | ||||||
| Draparnaldia sp. | 02 | 8000 | 0.20 | 00 | 00 | 00 | ||||||
| Spirogyra sp. | 13 | 52,000 | 1.35 | 12 | 48,000 | 2.43 | ||||||
| Closterium sp. | 01 | 4000 | 0.10 | 00 | 00 | 00 | ||||||
| Oocytis sp. | 05 | 20,000 | 0.52 | 05 | 20,000 | 1.01 | ||||||
| Staurastrum sp. | 00 | 00 | 00 | 08 | 32,000 | 1.62 | ||||||
| Euastrum sp. | 12 | 48,000 | 1.25 | 02 | 8000 | 0.40 | ||||||
| Pleurotaenium sp. | 52 | 2,08,000 | 5.43 | 14 | 56,000 | 2.83 | ||||||
| Hyalotheca sp. | 10 | 40,000 | 1.04 | 15 | 60,000 | 3.04 | ||||||
| Total | 956 | 38,24,000 | 100 | 493 | 19,72,000 | 100 | ||||||
| EUGLENOPHYCEAE | ||||||||||||
| Phacus sp. | 10 | 40,000 | 100 | 08 | 32,000 | 100 | ||||||
| Total | 10 | 40,000 | 100 | 08 | 32,000 | 100 |
Table 1: Phytoplankton Species in Nirmalagiri Lake and Kengeri Lake (November 2017).
Journal of Ecology & Natural Resources
| BACLLARIOPHYCEAE | ||||||
|---|---|---|---|---|---|---|
| Diatoms sp. | 61 | 2,44,000 | 93.84 | 42 | 1,68,000 | 91.30 |
| Asterionella sp. | 04 | 16,000 | 6.15 | 04 | 16,000 | 8.69 |
| Total | 65 | 2,60,000 | 100 | 46 | 1,84,000 | 100 |
| CYANOPHYCEAE | ||||||
| Chroococcus sp. | 01 | 4000 | 1.26 | 00 | 00 | 00 |
| Synechocystis sp. | 00 | 00 | 00 | 01 | 4000 | 1.23 |
| Merismopedia sp. | 43 | 1,72,000 | 54.43 | 41 | 1,64,000 | 50.61 |
| Anabaenopsis circularis | 21 | 84,000 | 26.58 | 22 | 88,000 | 27.16 |
| Gloeotrichia sp. | 00 | 00 | 00 | 03 | 12,000 | 3.70 |
| Anacystis | 14 | 56,000 | 17.72 | 14 | 56,000 | 17.28 |
| Total | 79 | 3,16,000 | 100 | 81 | 3,24,000 | 100 |
| CHAROPHYCEAE | ||||||
| Nitella sp. | 00 | 00 | 00 | 15 | 60,000 | 100 |
| Total | -- | -- | -- | 15 | 60,000 | 100 |
| DINOPHYCEAE | ||||||
| Ceratium sp. | 00 | 00 | 00 | 01 | 4000 | 100 |
| Total | -- | -- | -- | 01 | 4000 | 100 |
Table 2: Phytoplankton Species in Nirmalagiri Lake and Kengeri Lake (November 2017).
| Nirmalagiri Lake | |||||||||||||
|---|---|---|---|---|---|---|---|---|---|---|---|---|---|
| Group | % Composition | Kengeri Lake (Organisms/ml) | % Composition | ||||||||||
| (Organisms/ml) | |||||||||||||
| Chlorophyceae | 956 | 86.12 | 493 | 76.55 | |||||||||
| Euglenophyceae | 10 | 0.90 | 08 | 1.24 | |||||||||
| Bacillariophyceae | 65 | 5.85 | 46 | 7.14 | |||||||||
| Cyanophyceae | 79 | 7.11 | 81 | 12.57 | |||||||||
| Charophyceae | Nil | Nil | 15 | 2.32 | |||||||||
| Dinophyceae | Nil | Nil | 01 | 0.15 |
Table 3: Abundance and Percentage composition of Phytoplankton in Nirmalagiri lake and Kengeri Lake (November 2017).
| Nine Diversity Indices of Phytoplankton | Nirmalagiri Lake | Kengeri Lake | |||||
|---|---|---|---|---|---|---|---|
| Taxa_S | 4 | 6 | |||||
| Individuals | 1110 | 644 | |||||
| Dominance_D | 0.7503 | 0.6077 | |||||
| Shannon_H | 0.5253 | 0.8059 | |||||
| Simpson_1-D | 0.2497 | 0.3923 | |||||
| Evenness_e^H/S | 0.4227 | 0.3731 | |||||
| Menhinick | 0.1201 | 0.2364 | |||||
| Margalef | 0.4278 | 0.7731 | |||||
| Equitability_J | 0.3789 | 0.4498 | |||||
| Fisher_alpha | 0.5220 | 0.9149 | |||||
| Berger-Parker | 0.8613 | 0.7655 |
Table 4: Nine Diversity Indices of Phytoplankton Using PAST Software of Nirmalagiri Lake and Kengeri Lake.
Journal of Ecology & Natural Resources
| Chlamydomoas sp. | Gonium formosum | Volvox sp. | Sphaerocystis sp. | Elakatothrix sp. | Schroederia sp. |
|---|---|---|---|---|---|
| Pediastrum simplex | Ceolastrum sp. | Chlorella sp. | Clostridium sp. | Selenastrum sp. | Kirchaneriella sp. |
| Scenedesmus sp. | S.dimerphus sp. | S.bijugarus | S.obliquus | Phytoconis sp. | Nostoc muscorum |
| Draparnaldia sp. | Spirogyra sp. | Closterium sp. | Oocystis sp. | Euastrum sp. | Staurastrum sp. |
| Pleurotaenium sp. | Hyalotheca sp. | Phacus sp. | Diatom sp. | Asterionella sp. | Chroococcus sp. |
| Synechocystis sp. | Merismopedia sp. | Anabaenopsis circularis | Gloeotrichia sp. | Anacystis sp. | Nitella sp. |
| Ceratium sp. |
Table 5: Nine Diversity Indices of Phytoplankton Using PAST Software of Nirmalagiri Lake and Kengeri Lake.
Journal of Ecology & Natural Resources
Figure 3: Microphotographs of Phytoplankton in Nirmalagiri Lake and Kengeri Lake Water November (2017). X 40. The distribution of species indicates that Nirmalgiri lake has the highest number of phytoplankton having 1110 organisms/ml while the Kengeri lake has 628 organisms/ml. The algae were expressed as organisms per ml for the purpose of calculating diversity indices. A total of 37 algal species belonging to six groups namely Cholrophyceae, Euglenophyceae, Bacillariophyceae, Cyanophyceae, Charophyceae and Dinophyceae were recorded. The most dominating Chlorophyceae group in both the lakes consisted of species like Pediastrum simplex, Elakatothrix sp., Volvox sp., Selenastrum sp. Phytoconis sp., Pleurotaenium sp. Similarly the most dominating Euglenophyceae groups in both the lakes consisted of Phacus sp., among Bacillariophyceae the most dominating species are Diatoms sp. and among Cyanophyceae most dominating species are Merismopedia sp., and Anabaenopsis circularis. In the present study the species of Euglenophyceae and Dinophyceae were poorly represented when compared to other groups of the study. The occurrence of Euglenophyceae and Dinophyceae were inversely related to Chlorophyceae. Chlorophyceae was the most dominating group in Nirmalagiri lake with 956 organisms/ml with percentage composition of 86.12 while in Kengeri Lake it was 493 organisms/ml with a percentage composition of 76.55. Charophyceae and Dinophyceae were absent in Nirmalagiri Lake and in Kengeri Lake. Charophyceae and Dinophyceae consisted of about 2.32% and 0.15% respectively. In Nirmalagiri Lake among 29 species of phytoplankton 22 belonged to Chlorophyceae, 1 belonged to Euglenophyceae, 2 belonged to Bacillariophyceae, 4 belonged to Cyanophyceae. During the present investigation, the percentage abundance of phytoplankton in November, 2017 were Chlorophyceae (86.12%), Euglenophyceae (0.90%), Bacilllariophyceae (5.85%), and Cyanophyceae (7.11%). In Kengeri Lake 34 species of phytoplankton 24 belonged to Cholrophyceae, 1 belonged to Euglenophyceae, 2 belonged to Bacillariophyceae, 5 belonged to Cyanophyceae, 1 belonged to Charophyceae, 1 belonged to Dinophyceae. During the present investigation the percentage abundance of phytoplankton in November, 2017 was Chlorophyceae (76.55%), Euglenophyceae (1.24%), Bacillariophyceae (7.14%), Cyanophyceae (12.57%), Charophyceae(2.32%), and Dinophyceae (0.15%). Graph 1 and Graph 2 show the percentage composition of phytoplankton species in Nirmalagiri Lake and Kengeri Lake respectively. Graph 3 represents the comparative abundance of phytoplankton in Nirmalagiri Lake and Kengeri Lake.
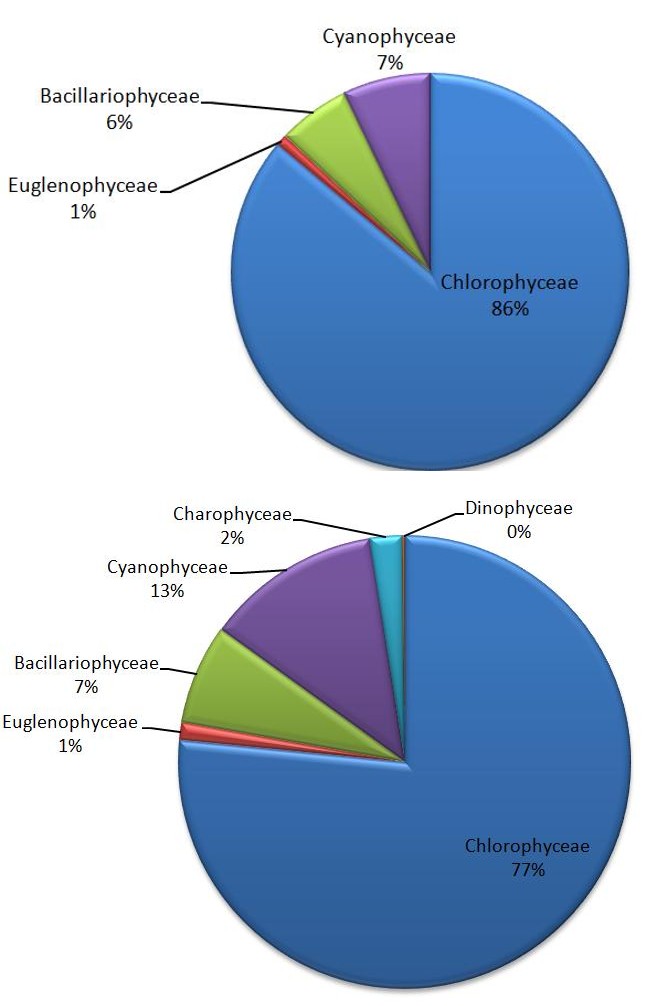
Graph 1: Percentage composition of phytoplankton Species in Nirmalagiri Lake during November 2017
Graph 2: Percentage Composition of Phytoplanton Species in Kengeri Lake November 2017
Journal of Ecology & Natural Resources
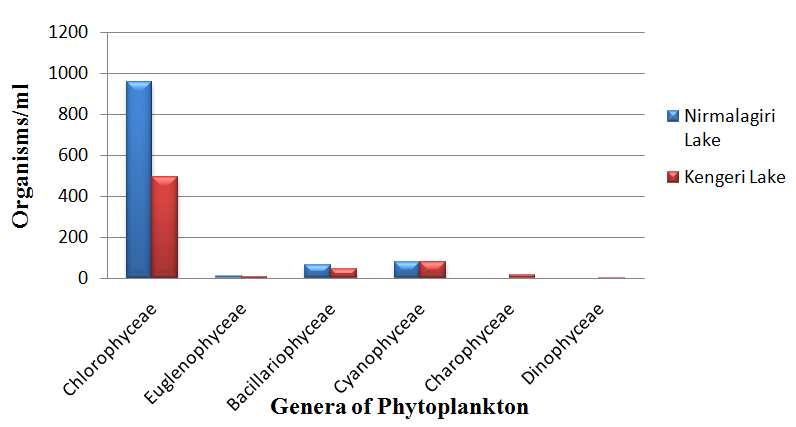
Graph 3: Abundance of Phytoplankton in Nirmalagiri Lake and Kengeri Lake The above data were subjected to a software program “PAST” which generates nine diversity indices namely Dominance D, Shannon H, Simpson, Evenness, Menhinick, Margalef, Equitability J, Fisher alpha and Berger-Parker. As diversity increases index value gets smaller [12]. Dominance index is a simple measure of the numerical importance of the most abundant species. The Dominance index in the present study indicates that Nirmalagiri lake (0.75) has the highest dominance of planktonic species and Kengeri lake (0.60) has the least dominance. Shannon and Weiner index represents entropy. It is a diversity index into account the number of individuals as well as the number of taxa [13]. This index can also determine the pollution status of a water body. Normal values range from 0 to 4. Wilham and Dorris concluded that the values of the index greater than 3 indicate clean water, values in the range of 1 to 3 are characterized by moderate pollution and values less than 1 characterized as heavily polluted [14]. According to this index, both Nirmalagiri lake (0.52) and Kengeri lake (0.80) are heavily polluted. The Simpson’s index is often used to quantify the biodiversity of the habitats. According to Simpson’s index species are not evenly distributed. The values range from a minimum of 0.71 and 0.96. In the present study the value of Simpson’s index in Nirmalagiri lake (0.24) and Kengeri lake (0.39). The Pielou’s evenness index states that species evenness is diversity index, a measure of diversity that quantifies how equal the community is equally [15]. The Evenness in Nirmalagiri Lake was (0.42) and Kengeri Lake (0.37). Menhinick’s and Margalef’s indices measure richness of species in an ecosystem. Menhinick’s index is low in Nirmalagiri Lake (0.12) and reaches a high value of 0.23 in Kengeri Lake. Menhinick’s index is low in Nirmalagiri Lake (0.42) and reaches a high value of 0.77 in Kengeri Lake. The Equitability index is a measure of the evenness with which individuals are divided among the taxa present. Equitability takes the values between 0 and 1, with 1 being complete evenness. The index when applied to the present study indicates that Nirmalagiri Lake has 0.37 and Kengeri Lake 0.44. Fisher’s alpha index is a mathematical calculation for determining diversity within a population [16]. It represented the first attempt to describe mathematically the relationship between the number of species and the number of individuals of those species. The index is very low in Nirmalagiri Lake (0.52) and is highest in Kengeri Lake reaching 0.91. This indicates the abundance of species were in Kengeri lake. Berger-Parker dominance index is the number of individuals in the dominant taxon divided by number of individuals (n) [17, 18]. The values are high in Nirmalagiri lake (0.86) and is least in Kengeri lake (0.76).
Conclusion
Diversity measures are more useful in Lake Ecosystem, which harbor a large variety of algal species in general and species diversity within genera. Calculating the diversity indices during this period indicated that Nirmalagiri lake had the richness of phytoplankton species when compared to Kengeri lake. This richness of species enhanced the growth of fishes in Nirmalagiri lake. The role of phytoplankton species and their assemblage as bio-indicators reflected the pollution status of the study lakes. Hence both the pollution indicator species and the beneficial species are present in the above investigated lakes. Hence environmental monitoring makes use of the fact that polluted or stressed communities are characterized by a change in the species abundance.
References
-
Huisman J, Weissing FJ (1995) Competition for nutrients and light in a mixed water column: A theoretical analysis. Am Nat 146(4): 536-564.
-
Klausmeier CA, Litchman E (2001) Algal games: The vertical distribution of phytoplankton in poorly mixed water columns. Limnol Oceanogr 46(8): 1998- 2007.
-
Diehl S (2002) Phytoplankton, light, and nutrients in a gradient of mixing depths: Theory. Ecology 83(2): 386-398.
-
Ariyadej C, Tansakul R, Tansakul P, Angsupanich, Saowapa (2004) Phytoplankton Diversity and its Relationships to the Physico-Chemical Environment Journal of Ecology & Natural Resources in the Banglang Reservoir, Yala Province, Song Klanakarin J Sci Technol 26(5): 595-607.
-
Mishra BB, Chaturvedi GB, Tewari DD (2010) Phytoplankton Fluctuatuations under the Stress of Abiotic Factors at Kohargaddi Dam, Balrampur. J Exp Sci 1(5): 22-24.
-
Joshep B, Yamakanamardi MS (2011) Monthly Changes in the Abundance and Biomass of Zooplankton and Water quality Parameter in Kukkarahalli Lake of Mysore, India. J Environ Biol 32(5): 551-557.
-
Pawar SK, Pulle JS, Shendge KM (2006) The Study on Phytoplankton of Pethwadaj Dam. Tq. Kandhar, Dist. Nanded, Maharashtra. J Aqua Boil 21(1): 1-6.
-
Lloyd M, Ghelardi RJ (1964) A table for calculating the “equitability’’ component of species diversity. J Animal Ecol 33(2): 217‐225.
-
Needham JG, Needham PR (1966) A guide to the freshwater biology. 5th (Edn.), Holden day Inc. San. Fransisco, Calif. Pp 108.
-
Bhouyain AM, Asmat SM (1992) Freshwater Zooplankton from Bangladesh, 1st (Edn.), Gazi Publishers, 37, Banglabazar, Dhaka, Bangladesh. Pp: 137.
-
Ali S and T Chakrabarty (1992) Bangladesher Mitha Panir Amerudandi Prani (A book of freshwater invertebrates of Bangladesh), 1st (Edn.), Bangla Academy, Dhaka Bangladesh. Pp: 207.
-
Hammer O, Harper DA, Rayan PD (2001) PAST: Palentological Statistics software package for Education and Data Analysis. Palaenotological Electronica 4(1): 4-9.
-
Shannon CE, Weiner V (1949) A mathematical Theory of Communication. University Press Illinois Urban 101-107
-
Wilham JL, Dorris TC (1968) Biological Parameters of water Quality Criteria. Bioscience 18(6): 447-481.
-
Pielou EC (1975) Ecological Diversity. John Wiley and Sons newyork Pp: 165.
-
Fisher RA, Corbert AS, Williams CB (1943) The relation between the numbers of species and the number of individuals in a random sample of an animal population. J Anim Ecol 12(1): 42-58.
-
Berger WH, Parker FL (1970) Diversity of Planktonic Foraminifera in deep sea Sediments. Sci 168(3937): 1345-1347.
-
Díaz S, Demissew S, Joly C, Lonsdale WM, Larigauderie A (2015) A Rosetta Stone for Nature’s Benefits to People. PLoS Biol 13(1): e1002040.
- Lessons to Learn: Trees are More than the Lungs of the World
- Community Forestry Enterprises as a Model for Sustainable Forest Development: The Case Of The "Baja Tarahumara" in Chihuahua, Mexico
- Ecological and Socio-Economic Impacts of Chromolaena odorata and Mesosphaerum suaveolens, Two Invasive Alien Species in Central and Southern Benin, West Africa
- Epigenetic Sustainability: Modeling the Human Factor as a Natural Resource through Science 4.0 and the NR3C1 Biological Pilot
- Growth-at-Risk: A Framework for Assessing Economic Vulnerability
- The Rural Territory as a Socioecological System for the Management of Public Policy for Sustainable Rural Development