Estimation of the Wild Boar Population in the Italian Apennines by Pellet Count Group Technic- A Pilot Study
Today the development of wild ungulates represents one of the most relevant changes of the Italian wildlife in the last decades. The occurrence of damages by wild boars raised dramatically in the last decades and amounts to hundreds of thousands of Euros per year in several European countries. Knowledge of distribution, abundance and population dynamics is essential for their correct management, especially for the Wild boar (Sus scrofa) considering its impact on the natural and agricultural ecosystem. This paper proposes an estimate of the wild boar population in a study area, located in the south / south-eastern part of the Italian Apennines. The census technique was planned through field inspections and cartographic elaborations using GiS software and the Pellet Count Group technic. The data of the Pellet Group discovery were marked on special field cards. 7.010 linear meters and 14.020 m2 were crossed; 12 Pellets Group were found. From this database and knowing the extent of each specific habitat it was detected the presence of about 7/8 animals per 100 ha. These densities, projected by the number of hectares of each analyzed habitat, indicate a presence of animals ranging between 187 and 164. Considering that, the optimal density for the study area would be about 47 animals per 100 ha, this means that the real density exceeds considerably these values. Therefore, the population within the Park should be reduced through a set-up of a real census plan deriving from different types of census repeated over several years.
Introduction
The wild ungulates development represents today one of the most important changes occurred in the past decades in Europe and in Italy. Wildlife is responsible for causing considerable amounts of damage to agriculture, specially to croplands [1, 2, 3, 4]. The occurrence of damages by wild boars raised dramatically in the last decades and amounts to hundreds of thousands of Euros per year in several European countries [5, 6]. In contrast to many other ungulates, the wild boar is an omnivore and inhabits a vast range of habitats [3]. This situation often determines serious conflicts with humans [7, 8]. The wild boar (Sus scrofa) greatly expanded their distribution areas because of the progressive adaptation to the most varied ecological and environmental conditions linked in most part to modified biological factors [9, 10, 11, 12]. In thirty years, the home-range has quintupled, involving different geographical areas. Wild boars are now diffused from lowlands to hilly and mountainous areas; the presence of wild boars has been observed also in the periphery of urban areas (e.g. Rome).
The strong impact that the wild boar has on some activities of economic interest contributes to sharpen the contrasts between social categories (hunters, farmers, foresters, public entities) having divergent interests. The efficiency of hunting, feeding and fencing to reduce crop damage by wild boars was largely studied [13]. The conflict of interests linked to the presence of the wild boar on the territory, together with some difficulties of technical nature (for example related to the quantitative estimate of the population), makes the management of this species particularly problematic. In fact, the management policies are inadequate as the lack of technical organization. Today, the serious lack of money invested by institutions to estimate the wild boars population and its biological characteristics (e.g. potential rates of population growth), together with the limited knowledge in this field determine considerable difficulties to face and solve these problems.
The first step in the management policies is to determine the wild boars populations and the possible changes coming out from the territories, appreciating their incidence on the trophic scale in a given environment. The estimation of the density of wildlife is fundamental to improve the management and conservation of this resource [14]. For many years, the scientific community has developed accurate techniques to register these populations through different census applications. These techniques have to be calibrated in relation to the species and the habitats. The outcome will depend on the costs and the number of operators available in the field. In this work, we applied one of these estimation techniques on the local wild boar population: the Faecal pellets Count Group. The Pellets Count Group (PCG) has been widely adopted, for the large-scale monitoring, since its first description in 1940 [15]. It was finalized to obtain a relative abundance index, and used to ascertain the population distribution; moreover, it allowed analysing the use of the habitat, although the latter use is widely controversial.
This technique allowed to develop predictive models, processed through the use of a GiS. Generally, this technique is applied to obtain an estimate of the abundance of ungulates, in environments with extensive forest cover, where other methods cannot be used successfully and are characterized by an unsatisfactory cost / benefit ratio. The basic concept is that the density of pellet groups is related to the average number of animals in the same area for a given period. There are two main types of pellet count: FSC (Faecal Standing Crop) and FAR (Faecal Accumulation Rate).
The usual technique consists in counting the number of pellet groups (PG) present within spatial sampling units (transects, UC), selected according to a probabilistic procedure, usually observing a stratification for habitat, in order to improve the accuracy of the result [16]. In this application, the sampling strategy is the most important aspect in the planning phase; the effectiveness of the results depends in most part on it. A preliminary procedure (such as a pilot study) is recommended, in order to verify if the technique is appropriate in relation to: objectives; available economic and human resources; environmental context; distribution of the abundance of the target species. These latter elements strongly influence the sampling procedure and the final result. In particular, the pilot study is functional to the sampling quantification (total length of the paths), useful to obtain estimates values characterized by the desired degree of variability [17]. Another fundamental element is the preparation of the technicians.
In fact, the detection error could indeed represent an important source of variability in the final result. It is therefore necessary that the number of technicians involved is limited and provided of an adequate specific training. Also, the individual reading capacity of the sampling unit should be accessed through a specially planned field test. Before to start the process and the data collection it is important to define the mode of quantification of pellet groups and to establish rules for the treatment and classification of all possible cases. These cases are partly known and treated in specialized literature; however, the execution of the pilot study will help to identify others, helping to standardize the detection mode between technicians. Pellet group is defined as an accumulation of at least 6 pellets produced in the same event [18]. A pellet group needs of at least 6 fecal pellets [19]. When a PG is present on the edge of the sampling unit, its inclusion or exclusion must be established on the basis of the percentage of pellets inside or outside the sampling unit; if the PG is situated exactly on the edge of the sampling unit, it has to be included and excluded from the count alternately [18].
The different ways to carry out the pellet count are characterized by different levels of precision depending in most part on the financial resources, the logistic and organizational aspects. The accuracy of both methods seems strongly influenced by the population density: both are not very effective at low density (<5 heads / km2), where they would not be able to detect a decrease of 10% of the population, only after many years of monitoring [20]. In the same conditions, the FSC produces more precise estimates than FAR and others technics, although the differences are rather small [19, 20]; generally, these differences depend on the accumulation time necessary to apply the FAR. It should be stressed, however, that if accumulation times are too long, the onset of PG deterioration may occur; this situation could determine a wrong application of the technique. The accuracy of the results achievable with FAR may also be affected by a larger number of zero-count sampling units and a smaller overall sample, considered the detection effort (two visits). According to FSC (Faecal Standing Crop), the UCs is inspected only once. The FSC is measured by quantifying the number of PG present in the UC; data are subsequently converted into an estimate of the population size, using some parameters such as: the rate of defecation of the specific species and the decay rate of the PG. This technique can also be combined to the distance sampling technique. Usually, the measurement of the defecation rate and the rate of decay are taken from the literature, which provides fairly consistent values for each species and for each habitat.
The FSC technique has some limitations, related to systematic errors coming from the difficulty of detection and classification of PG deteriorating [21], and the quantification of defecation and decay rates. Smart, et al. [20] believe that the FSC is more reliable than the FAR, so much that it could be considered a valid alternative to other methods, such as the distance sampling using infrared technology; but it is important to underline how the best performances of the technique depend on the correct quantification of the decay times, habitats and specific site of pellet groups. Generally, the count of pellets groups can be considered an effective population monitoring tool. The counting of pellet groups could be the right method to combine to the classical methods of monitoring, where the data of consistency of the population produced do not allow detecting its dynamics. In this case, a survey by pellet count every 2-5 years with an appropriate sampling effort could be sufficient to verify any changes in the population size [20].
The realization of a pilot study, however, is essential to ascertain which of the two modes of application is most suitable to the environmental context, and the expected goals, to get information about the ability of the technical resolution in accordance to the extent of the demographic variations that you want to detect. In this experimental work, we tried to apply one of these estimation techniques on the local wild boar population detected in an Italian Regional Park located in Benevento area (Southern Italy). The Faecal pellets Count Group was applied to a large study area of this park, in order to produce an experimental protocol, to consider as pilot study to apply in other areas.
Materials and Methods
Study Area
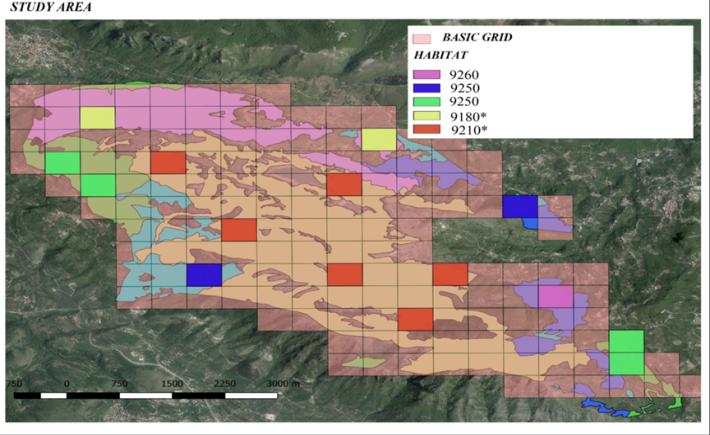
The study area is located in the Italian Regional Natural Park Taburno- Camposauro (Benevento - Southern Italy). This park is inside the Taburno massif (1394 m), where the surveys area for the estimate of the population of wild boar was identified. The areas of the Integral Reserve and of the General Reserve were selected as sample unit (UC), eliminating inhabited centres and anthropized areas (Figure 1). The survey area was approximately of 2642 hectares. The habitats more representative (> 200 ha) were selected: - Chestnut woods (habitat code 9260), 218.74 ha, - Oak and turkey oak woods of (habitat code 9250),
225.11 ha, - Mesophilous mixed woods with alder, hornbeam, oak, maple and chestnut (habitat code 9180 *), 401.48 ha, - Mixed woods of oak, turkey oak, hornbeam and flowering ash (habitat code 9250), 258.89 ha, - Pure beech forests and aquifoglio (habitat code 9210*),
1236.5 ha.
Sampling Method
The choice of the monitoring-census techniques for the wild boar species (Sus scrofa), was decided considering the morphological differences of the territory and the Habitats characteristics. Considering these two elements it was decided to apply the Pellet Count Groups
technique - Fecal Standing Crop (PCG-FSC). The chosen method was the FSC (Faecal Standing Crop). According to this method the UCs were inspected only once. The FSC was measured by quantifying the number of Pellet Groups (PG) present in the Sample Units (CU); subsequently it was converted into an estimate of the population size, using as parameters, the specific species defecation rate and the rate of PG decay. The sampling technique was the random-opportunistic-stratified, because the goal of the sampling design was to maximize the efficiency of the process, providing the best statistical estimates with the least variability at the lowest cost [11].
Moreover, the random-opportunist technique was turned out to be the most appropriate in relation to the considerable surface of the study area, its morphology and the number of operators. The distribution of the UC sampling units (transects), was chosen according to some territorial variables in order to analyze them separately (stratified sampling by Habitat). In fact, the stratification by type of Habitat is often useful to grasp the variability deriving from the different distribution of animals according to the habitats. With a GiS software [22], it was developed an overlay to a vector file of the study area. Several layers-layers (Habitat), were included into a grid with quadrants of 400 m x 500 m (20 ha), creating 155 possible Sample Units (UC) (Figure 1). In this way it was realized a first selection of the quadrants from the basal grid, eliminating those that do not overlap with the chosen Habitats and those falling into cultivated fields.
In fact, they represent just a feeding area for the species but they are not relevant for the survey if compared to those areas that provide shelter and food, eliminating the dials of population centers. Subsequently, with an inspection on the field other quadrants were eliminated because the application of the technique was not feasible (eg. rocky walls with steep slopes). The Sampling Units (UC) chosen was constituted by strips of ground, approximately 500 meters long; the width of 1 m to the right (DX) and 1 m to the left (SX) of the midline of the transept cover an area of 1000 m2 (2 m x 500 m) (Figure 2). The length of the transects was established by considering the environmental characteristics of the habitats and the season (winter), because the accessibility and visuality of PG on the ground are greater than in spring and summer.
The starting points (start point transect) were identified through GiS. The walking direction was determined by opportunistic manner, choosing previously the direction; the accessibility of the territory was chosen as linear as possible, along 500 mt. The same procedure was used for all the transects. The starting points were chosen close to the roads available or to treatable tracks, paths, etc. to reduce costs and efforts in applying the technique. The various data was noted on a special form modified by previous protocols suggested by the Italian Institute for Environmental Protection and Research [23]. Data included: survey card number, transept number, operator name, date, start and end times, transect length in meters, initial coordinates (Coord_SpT_E and Coord_SpT_N), weather conditions, habitat typology, number of find points pellet groups, number of fecal pellet (number of PT), distance from right and left of the midline (DX and SX), pellet status, coordinates of the find points (East and North), altitude in meters, slopes, other tracks, notes. The geographic coordinates of the starting points were inserted into the GPS. The transect was traversed by consulting the compass every 10-15 meters, to maintain the previously established direction as much as possible. The following precautions were followed in this phase [24]:
- Constant speed - Strong concentration - Moment of pause, if tired - Concentrate all the efforts on the central line with a procedure such as: to look in the middle, on the right, in the centre, on the left, in the centre, etc...
Fecal groups were observed only by the performer. Those casually seen by the compiler cannot be considered because the method is based on the decrease of the measurements and on the increase of the distance from the transept.
![Figure 2: Example of a transept, the arrows indicate the Fecal groups. Estimated density and values used in the decomposition rate and defecation rate. The formula applied to indicate density is [24]:](/fulltextimages/2954/fig_2.jpeg)
𝐷= 𝑁𝑝𝑔/𝐴𝑁𝑝𝑔/𝐴
𝑇∗𝐹
D = DENSITY Npg / A = n. Pellet Group/analysed area T = decomposition rate F = defecation rate
Results and discussion
Transects
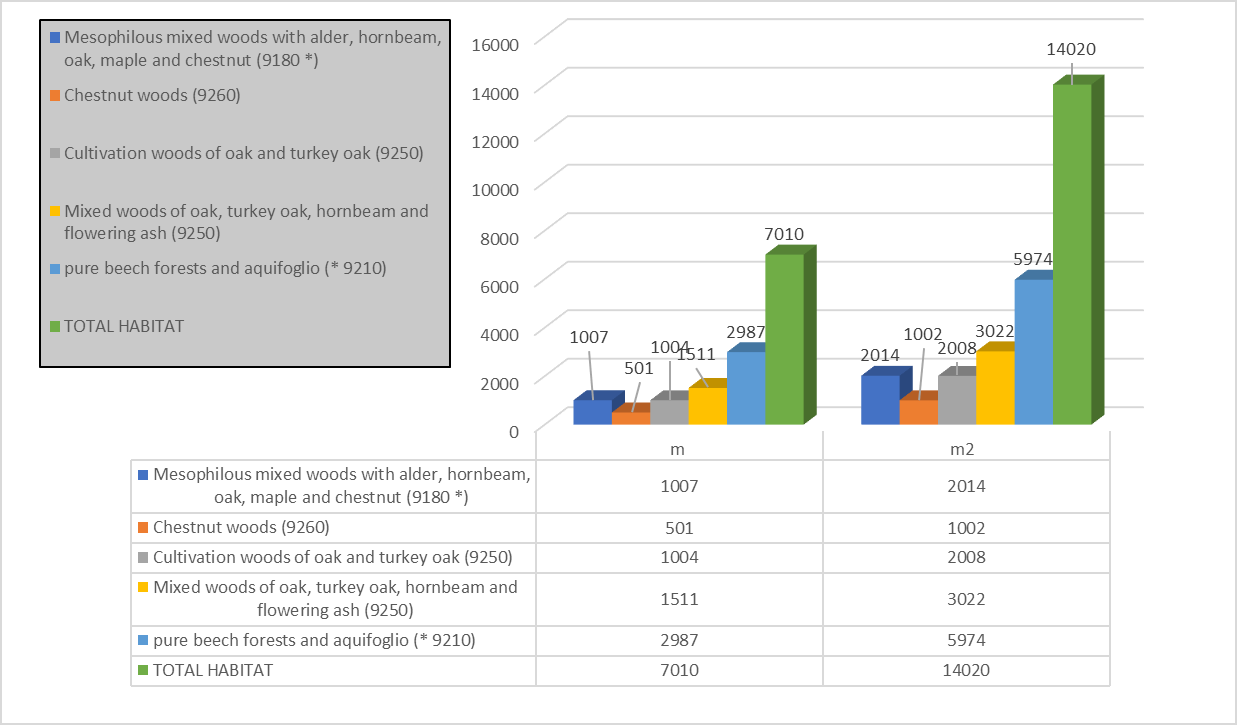
14 transects were determined in 8 days over a period of about three months (December 2016, February 2017, March 2017). 1 to 2 transect were determined every 200 ha for each habitat type, for a total length of 7010 mt and 14020 m2 (Figure 3): - 501 m in Chestnut woods (9260) - 1004 m in Cultivation woods of oak and turkey oak (9250) - 1007m in Mesophilous mixed woods with alder, hornbeam, oak, maple and chestnut (9180 *) - 1511 m in Mixed woods of oak, turkey oak, hornbeam and flowering ash (9250) - 2987 m Pure beech forests and aquifoglio (9210*)
Pellet Group and Rate Found
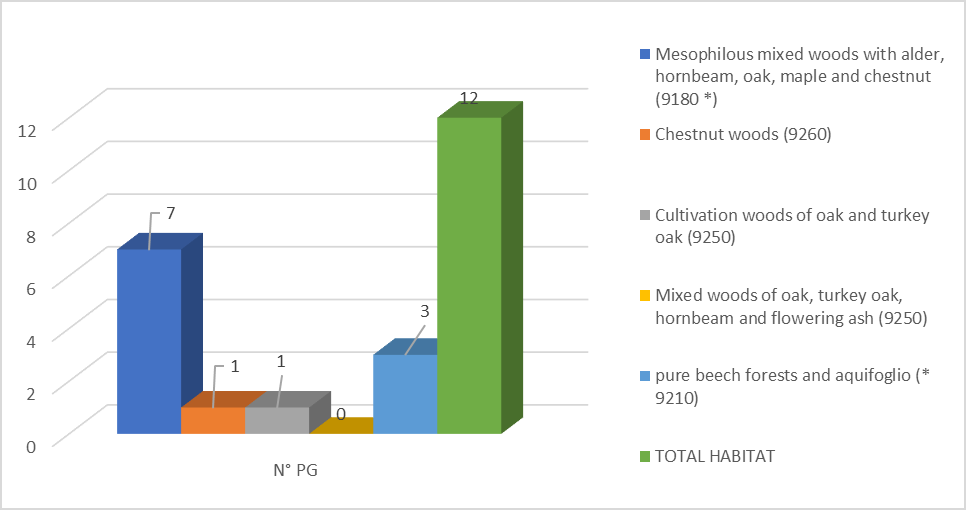
The Pellet Group (PG) of the wild boar has an elongated shape of dark colour, generally depending on the feeding. These pellet groups come out from many single pellets; they over time are in most part decomposed. 12 Pellets Groups were found; they were distributed in the different habitats (Figure 4): - 1 in Chestnut woods (9260) with a find rate of 9/ha, - 1 in Cultivation woods of oak and turkey oak (9250) with a find rate of 4, 98/ha, -7 in Mesophilous mixed woods with alder, hornbeam, oak, maple and chestnut (9180 *) with a find rate of 34, 76/ha, - 0 in mixed woods of oak, turkey oak, hornbeam and flowering ash (9250) - 3 in Pure beech forests and aquifoglio (9210*) with a find rate 5, 02/ha.
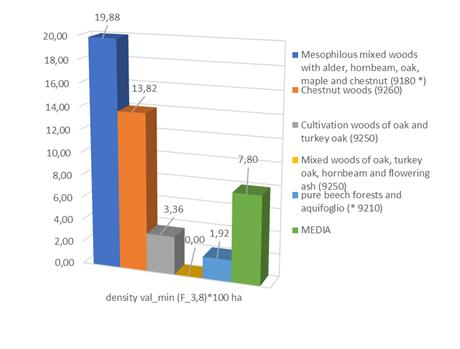
Since it was not possible to find fresh fecal groups in the sampling areas, the average deterioration time (fecal decomposition rate) was determined applying values found in the bibliography, referred to similar characteristics of the analysed habitats. The various decomposition rates (T) used for the different typologies are: chestnut woods, 19 days; cultivation woods of oak and turkey oak, 39 days; mesophilous mixed woods with alder, hornbeam, oak, maple and chestnut, 46 days; pure beech forests and aquifoglio, 69 days [25, 26]. Also, in the case of the defecation rate (F) we used two reference values [27, 28], which are: 3.8 and 4.5. The results obtained by applying two different defecation rates (3.8 and 4.5, Figures 5 & 6) show an average density of 7-8 garments per 100 ha. The values are very different from one to another depending on the wooded habitats examined.
![Figure 6: Defecation rate 4,5 [28].](/fulltextimages/2954/fig_6.jpeg)
These results lead to the following data concerning the abundance of wild boars/100 ha in the different habitats: - Chestnut woods (9260): 12/14 heads - Cultivation woods of oak and turkey oak (9250): about 3 heads - Mesophilous mixed woods with alder, hornbeam, oak, maple and chestnut (9180 *): 17-20 heads - Pure beech forests and aquifoglio (9210*): 2 heads.
In the case of mixed woods of oak, turkey oak, hornbeam and flowering ash no wild boars were detected. These results may have been conditioned by seasonality, environmental conditions and species behaviour. In fact, the wild boars move in the Park in the autumn-winter period, when hunting is authorized in the surrounding area. Consequently, it is in this period that they live in the Park and consider it as a shelter area. Considering all the areas together, there is an average value of 7/8 wild boars/100 ha. with considerable discrepancies between the different areas. Extrapolating the data obtained in relation to the surfaces and to the types of habitat it is possible to estimate the abundance values of the specie: the estimate of the population of wild boars ranges from 164 and 187 in the study area, applying the two indexes [27, 28]. These estimates show a density much higher of the sustainable-optimal density, which is of around 47 heads (considering 2 heads/100 ha). Our census data was subsequently confirmed by harvest of the hunting bag near the park. This density should be reduced considering the relationships with other animal and plant species, and the impact on human activities. In this way it is possible to plan a balance that meets the conservation needs and reduces the damage caused to agriculture, breeding and other components of the ecosystem. To determine if the damage is tolerable or not in territory, the need for intervention must be assessed.
Conclusion
The analysis of variation of wild boars distribution, abundance and population dynamics provides essential information for managing these populations. The knowledge of the number of animals is fundamental to plan correct systems to prevent the risk of damages to the agricultural and forest environment. To determine if the damage is tolerable or not in a territory, the need for intervention must be assessed. Indeed, the same presence of wild boar in protected areas has positive aspects because they play an important role in the food chain and in the trophic cascade (large carnivores), provided that it does not exceed certain thresholds and become an ecological problem. The optimal density depends on the socio-environmental characteristics of the territory, the damage recorded and the conservationist specific needs.
It is important to underline that the management of damages is not limited only to the quantitative aspects, but also to the different ways of perception of it. From a practical point of view, this problem has to be discussed and shared by all the social components involved in the management of the species, such as the comparison between the average "value" in terms of money paid for damage and prevention. So far, the sustainable planning and the objective-density parameters should not be considered as immutable values, because they refer to the principle of adaptive management and may vary over time [29, 30]. This is the principle of the adaptive management. Wild Boar is one of the most difficult species to be registered; the PCG can be adopted even in wooded environments.
This survey can be considered just a pilot study in the Park area and represents a good starting point to plan a more complete census of the wild boars. This kind of survey should be repeated for several consecutive years, crossing the various data, resulting from different types of census-monitoring and increasing the intensity-effort and data bases, to get a greater reliability. In this way it will be possible to limit the error and consider population dynamics. Therefore, in addition to the work of estimating quantitatively the park populations (limit of the application of the technique of counting faecal groups), it would be essential to know the population dynamics and its distribution by age and gender, in order to keep the wild boar population under control. This means to stabilize the populations if poorly managed, keeping under control the Annual Useful Increase index (IUA), based on processes related to the birth-immigration and mortality-emigration of the species. Nevertheless, the technical parameters could be considerably affected by the policies that the park assumes. This decision should be based on the basic choices, made at the time of drafting and adoption of the Park Plan (Italian Law 6 December 1991, n. 394, Art. 12, paragraph 1, letter e), but at the same time being adaptive to the evolution of the wild boar population.
References
-
Lombardini M, Meriggi A, Fozzi A (2017) Factors influencing wild boar damage to agricultural crops in Sardinia (Italy). Current Zoology 63(5): 507-514.
-
Cuevas MF, Vovillo A, Campos C, Dacar MA, Ojeda RA (2010) Food habits and impacts of rooting behavior of the invasive wild boar, Sus scrofa, in a protected area of the Monte Desert, Argentina. J Arid Environ 74(11): 1582-1585.
-
Baskin L, Danell K (2003) Ecology of ungulates: A handbook of species in eastern Europe and northern and central Asia. Springer-Verlag, Berlin Ed., pp: 15- 37.
-
Lemel J, Truvé J, Soderberg B (2003) Variation in ranging and activity behavior of European wild boar Sus scrofa in Sweden. Wildlife Biology 9(1): 29-36.
-
Bleier N, Lehoczki R, Újváry D, Szemethy L, Csányi S (2012) Relationships between wild ungulates density and crop damage in Hungary. Acta Theriologica 57(4): 351-359.
-
Schley L, Dufrêne M, Krier A, Frantz AC (2008) Patterns of crop damage by wild boar (Sus scrofa) in Luxembourg over a 10-year period. European J Wildlife Res 54: 589-599.
-
Barrios-Garcia MN, Ballari AS (2012) Impact of wild boar (Sus scrofa) in its introduced and native range: A review. Biol Invasions 14(11): 2283-2300.
-
Bengsen AJ, Gentle MN, Mitchell JL, Pearson HE, Saunders GR (2014) Impacts and management of wild pigs Sus scrofa in Australia. Mamm Rev 44(2): 135- 147.
-
Apollonio M, Anderson R, Putman R (2010) European ungulates and their management in the 21st Century. Cambridge University Press: Cambridge, UK, pp: 618.
-
Massei G, Kindberg J, Licoppe A, Gačić D, Šprem N, et al. (2015) Wild boar populations up, numbers of hunters down? A review of trends and implications for Europe. Pest Manag Sci 71(4): 492-500.
-
Krebs CJ (1989) Ecological Methodology. Harper and Row Publishers, New York, pp: 654.
-
Thurfjell H, Ball JP, Åhlén PA, Kornacher P, Dettki H, et al. (2009) Habitat use and spatial patterns of wild boar Sus scrofa (L.): agricultural fields and edges. European J Wildlife Res 55(5): 517-523.
-
Geisser H, Reyer HU (2004) Efficiency of hunting, feeding and fencing to reduce crop damage by wild boars. J Wildlife Management 68(4): 939-946.
-
Sutherland WJ (2006) Ecological census techniques, a handbook. 2nd (Edn.), Cambridge University Press, pp: 450.
-
Bennett LJ, English PF, McCain R (1940) A study of deer populations by use of pellet- group counts. J Wildlife Management 4(4): 398-403.
-
Marques FC, Buckland ST, Goffin D, Dixon CE, Borchers DL, et al. (2001) Estimating deer abundance from line transect surveys of dung: sika deer in southern Scotland. J Applied Ecol 38(2): 349-363.
-
Buckland ST, Anderson DR, Burnham KP, Laake JL, Borchers DL, et al. (2001) Introduction to Distance sampling. Oxford University Press, Oxford, pp: 448.
-
Mayle B, Pease AJ, Gill RMA (1999) How many deer?. Forestry Commission Edinburgh UK, n.18.
-
Campbell D, Swanson GM, Sales J (2004) Comparing the precision and cost-effectiveness of faecal pellet group count methods. J Applied Ecol 41(6): 1185- 1196.
-
Smart JCR, Ward AI, White PCL (2004) Monitoring woodland deer populations in the UK: an imprecise science. Mammal Review 34(1-2): 99-114.
-
Neff DJ (1968) The pellet-group count technique for big game trend, census and distribution: a review. J Wildlife Manag 32(3): 597-614.
-
Geographic Information System, Quantum Gis, QGIS
-
Monaco A, Carnevali L, Toso S (2010) Linee guida per la gestione del Cinghiale (Sus scrofa) nelle aree protette. 2nd (Edn.), ISPRA booklet (Italian Ministry of the Environment), pp: 34.
-
Raganella PE, Riga F, Toso S, Pedrotti L (2013) Linee Guida per la gestione degli Ungulati. Cervidi e Bovidi. ISPRA booklet (Italian Ministry of the Environment), pp: 220.
-
Maiorano G (2012) Attività di studio e monitoraggio sulla consistenza e distribuzione delle popolazioni di cinghiale all’interno e in prossimità dell’Oasi di Protezione Monte Vairano. Edited by Province of Campobasso (Italy) and Molise University (Italy).
-
Riga F, Carnevali L, Genghini M, Toso S (2009) Il problema dei danni da ungulati alle colture agroforestali. In: Danni causati dalla fauna selvatica all’agricoltura, «I Georgofili. Quaderni», I: 121-146.
-
Ferretti F, Storer K, Coats J, Massei G (2015) Temporal and Spatial Patterns of defecation rate in wild boar. Wildlife Society Bulletin 39(1): 65-69.
-
Briedermann L (1986) Schwarzwild (Wild boar). VEB Deutscher, Land wirtschaftsverlag Berlin. pp: 209.
-
Monaco AB, Franzetti L, Pedrotti E, Toso S (2003) Linee guida per la gestione del Cinghiale. Min. Politiche Agricole e Forestali- Ist. Naz. Fauna Selvatica, pp: 116.
-
Monaco A, Carnevali L, Toso S (2010) Linee guida per la gestione del Cinghiale (Sus scrofa) nelle aree protette. 2nd (Edn.), ISPRA booklet (Italian Ministry of the Environment), pp: 34.
-
Santilli F, Varuzza P (2013) Factors affecting wild boar (Sus scrofa) abundance in southern Tuscany. Hystrix 24(2): 169-173.
- Lessons to Learn: Trees are More than the Lungs of the World
- Community Forestry Enterprises as a Model for Sustainable Forest Development: The Case Of The "Baja Tarahumara" in Chihuahua, Mexico
- Ecological and Socio-Economic Impacts of Chromolaena odorata and Mesosphaerum suaveolens, Two Invasive Alien Species in Central and Southern Benin, West Africa
- Epigenetic Sustainability: Modeling the Human Factor as a Natural Resource through Science 4.0 and the NR3C1 Biological Pilot
- Growth-at-Risk: A Framework for Assessing Economic Vulnerability
- The Rural Territory as a Socioecological System for the Management of Public Policy for Sustainable Rural Development