Prioritization of Watershed using Morphometric Analysis in Kulfo Watershed in Ethiopia
Prioritization of watersheds based on water plot capacity of Kulfo watershed has been evaluated by linear, aerial and relief aspects. Morphometric analysis has been attempted for prioritization for nine sub-watersheds of Kulfo watershed in Chamo lake basin, which is a tributary of the CHAMO LAKE. The Sub-watersheds are delineated by Arc Map 10.2 software as per digital elevation model (DEM). Assessment of drainages and their relative parameters such as stream length, drainage density, texture ratio, form factor, circulatory ratio, elongation ratio and bifurcation ratio has been calculated separately for each sub-watershed using the Remote Sensing (RS) and Geospatial techniques. Finally, the prioritized score on the basis of Morphometric behavior of each sub-watershed is assigned and thereafter consolidated scores have been estimated to identify the most sensitive parameters. The analysis reveals that stream order varies from 1 to 5; however, the first-order stream covers maximum area of about 87.7 %. Total number of stream segment of all order is 1,165 in the watershed. The study emphasizes the prioritization of the sub-watersheds on the basis of Morphometric analysis. The final score of entire nine sub-watersheds is assigned as per erosion threat. The sub-watershed with the least compound parameter value was assigned as highest priority. However, the sub-watersheds has been categorized into three classes as very high (5–7.9), high (8–10.9), moderate (11-13.9) and low priority (14-16.9) on the basis of their maximum (14.43) and minimum (5.71) prioritized score.
Introduction
A watershed is the surface area drained by a part or the totality of one or several given water courses. It is an ideal unit for management of natural resources like land and water and conservation for mitigation of the impact of natural disasters for achieving sustainable development of water resource. The watershed management concept recognizes the interrelationships among the linkages between uplands, low lands, land use, geomorphology, slope and soil. Watershed prioritization is the main issue in watershed management and development while demarcating watersheds. Watershed prioritization is the ranking of different sub watersheds of a watershed according to the order in which they have to be taken for treatment and soil conservation measures. Integrated use of remote sensing and geographic information system techniques can be used for detailed Morphometric analysis and land use/land cover analysis for watershed prioritization studies. Remote sensing and GIS techniques are know a day used for assessment of various terrain condition and Morphometric parameters of the drainage basins of the watershed and watersheds, as they provide a flexible environment and a powerful tool for the manipulation and analysis of spatial information. Currently, Morphometric
analysis has been carried out in Kulfo watershed, using remote sensing and GIS. This study attempt to prioritize sub- watersheds on the basis of Morphometric characteristics of the watershed.
Materials and Methods
Description of the Study Area
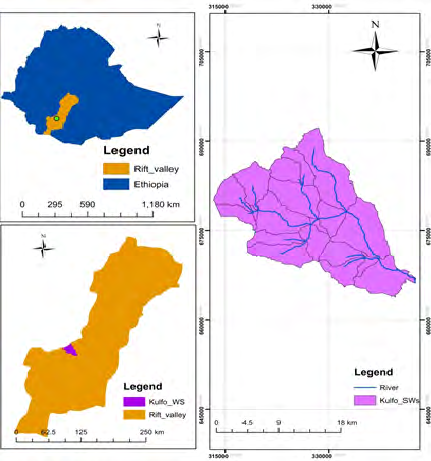
The Kulfo watershed is geographically located between 37028’00.94”and 37034’03.34” East longitude and 6003’49.19” and 6003’11.71” North latitude. Kulfo watershed is one of the watersheds in Abaya Chamo Lakes basin in Rift Valley Lakes basin. The watershed drains to Chamo Lake in the basin. The maximum and minimum elevation of the watershed is3557 and 1192 m a.m.s.l. respectively.
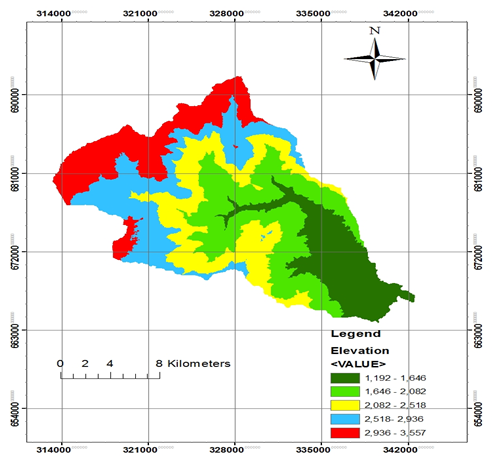
Topography and Slope
The slope and topography describe the shape and relief of the land surface. Topography is the measurement of elevation and slope is the percentage change in that elevation (topography) over a certain distance. Topography may be measured with lines that connect points representing the same elevation (contour). Whereas slope measured by calculating the difference in the elevation from one point to another dividing by the lateral distance between those points. The Watershed has marked topographic variation. As shown in the figure below the maximum elevation is 3557 m.a.s.l and the minimum elevation is 1192 m.a.s.l at the outlet of the watershed. These topographical variations have important consideration in the rainfall distribution and other climatic factor variation.
Potential with arrange between 0to1 because of farming practices or soil and water conservation measures. With no erosion control practice. P is equal to one. The farming practices increasing erosion instead of reducing are ploughing in the direction of up and down slope with equivalent P value of one which is the worst case scenario.
The data related to management or support practice situations of the study watershed were collected during the field work through different techniques. The techniques employed includes interview of the local community site observation by transect walk and secondary information collected from woreda and local agricultural offices. Therefore values for this factor were assigned considering local management practices and based on values. Management factors were obtained by assessing the different supporting practices in the study watershed and it was taken the weighted value for similar land use types.
Generation of Parameter Values of Catchment Morphology
Satellite remote sensing was used to generate morphological characterization of the catchment. Remote sensing technology is also important to generate the mapping and monitoring of the shifting of catchment stream line river bank and erosion/ deposition.
Remote Sensing and GIS for Catchment Morphology Study
There are direct and indirect methods for monitoring the stream erosion process. The direct method is taking measurement from the field in terms of linear rate of erosion volume of erosion and channel cross section. The indirect method is analyzing the archival sources that exist at various timescales with sediment records. The archival sources can be conventional survey maps or satellite image. In this study satellite remote sensing and GIS technology has been used to provide valuable information for carrying out catchment morphology characterization and produce geospatial databases for analysis. The application of remote sensing and GIS for this study was for the identification of the change in stream in the catchment.
Quantitative Analysis of Catchment Morphology
Important morphological characteristics of a watershed include drainage density, form factor, elongation ratio and circulatory ratio, over land flow, bifurcation ratio, form factor and drainage texture. The relationship between the morphology of streams and the effect of erosion has been considered important for the assessment of erosion vulnerability in the watershed.
In the analysis of the sub watershed morphology characterization the highest rank value given to the sub watershed which have highest drainage density among the all comparison. The higher the drainage density the higher will be the vulnerability to erosion and hence, the greater the weight Circulatory ratio and elongation ratio were calculated similarly for each sub watershed and highest rank value given to the sub watershed which has lowest value of these factors among all comparison. Higher value of the circulatory ratio and elongation ratio induces lesser erosion and higher values in these cases was assigned less weight.
The assign weights for each morphological characteristic were averaged out and again divided into different classes. Thus a single weight was assigned for all the morphological parameters taken together. Weights were assigned to each range of average weight. Assuming that higher morphological weight induces higher erosion.
Drainage Density
Drainage density represents a relative higher number of streams per unit area and thus in this study, it was computed as the ratio of the total length of streams within a watershed to the area of the watershed. The drainage density of the watershed was determined by using the formula given below Horton [1] whereas the total length of the stream and watershed area was determined by using ArcGIS 10.2.
$$D = \frac{L_u}{A}$$
Where: $A =$ area of the basin in $(km^2)$. $L_u =$ total stream length of order $u$
Circulatory Ratio
The circulatory ratio is the factor to facilitate soil erosion. The circulatory ratio of the watershed was estimated by taking the ratio of the area of the watershed to the area of the circle having the same perimeter as that of the watershed area. The circulatory ratio of the catchment was determined using the equation below. The area of the circle having the same perimeter was determined using the following equation manually
$$R_c = \frac{4APi}{P^2}$$
Where; $A =$ area of the basin in $(km^2)$. Pi value i.e. 3.14.
$P =$ Perimeter of the basin in $(km)$
Elongation Ratio (E)
The elongation ratio shows how much the watershed is elongated. The elongation ratio of the watershed was calculated as the ratio of the area of the basin to the maximum length of the watershed (equation 10). The maximum length of the watershed was determined by ArcGIS 10.2 and the area of the basin determined in GIS environment during watershed delineation.
$$R_e = \frac{2}{L_b} \cdot \left( \frac{A}{Pi} \right)^2$$
Where; $A =$ Area of the basin. Pi value i.e. 3.14. $L_b =$ basin length.
Form Factor
The form factor of the watershed was determined using the area of the watershed and the square of the basin length of the area of the watershed which was in turn determined in ArcGIS 10.2 environments. The basin length of the watershed was determined using the following formula [1].
$$R_f = \frac{A}{L_b^2}$$
Where; $A =$ Area of the basin, $L_b =$ basin length.
Bifurcation Ratio Bifurcation ratio expresses the ratio of primary stream order to that of secondary stream order or secondary stream to that of tertiary stream order and so on. These catchment morphology parameter were determined by the equation given below where as the steam orders were determined in the ArcGIS environment.
Nu R N
$$ R _ {\mathrm {b}} = \frac {\mathrm {N u}}{\mathrm {N} _ {\mathrm {u} + 1}} $$
(5) Where; Nu = total number of stream segments of order u. Nu+1= number of segment of the next higher order
Length of Overland Flow
It is the length of water flow over the ground before it concentrated in to definite stream channel. This factor relates inversely to the average slope of the channel and quite similar with the length of sheet flow to large degree. This parameter was determined by the equation given below [2].
$$ \mathbf {L} = \frac {1}{\mathbf {D} ^ {2}} $$
(6)
Drainage Texture
The drainage texture of the watershed is the ratio of the total number of stream to the perimeter of the watershed.
The drainage texture was determined using the equation given below [2]. Whereas the total number of the stream and the perimeter of the watershed were determined in arcGIS 10.2 environment.
$$ \mathrm {R} _ {\mathrm {t}} = \frac {\mathrm {N} _ {\mathrm {u}}}{\mathrm {P}} \tag {7} $$ Where; P = Perimeter of the basin in (km). Nu = total number of stream segments of order u.
Results and Discussion
Characterization of the Catchment Morphology
The physical properties of the basin significantly affect the characteristics of the runoff and sediment yield. In this study morph metric analysis of the parameter stream order, stream length, bifurcation ratio, form factor, drainage density, drainage texture, stream density, elongation ratio and circulatory ratio were characterized for the watershed (Table 2). The result of the morphologic parameters indicated that high value of linear parameters such as drainage density, bifurcation ratio and overland flow cause high flood response and soil erosion/sediment yield. The shape factor parameters (form factor circulatory and elongation ratio) affect the erosion process indirectly. The value of linear and shape parameters of Morphometric properties of the basin are shown in the (Table 1).
| Morphologic parameter | Unit | Value |
|---|---|---|
| Area | km2 | 398.93 |
| Perimeter | Km | 425.3 |
| Stream order | Count | 4 |
| Total number of stream | No | 237 |
| Total stream length | Km | 290.83 |
| Stream density | no/km | 0.59 |
| Drainage density | 1/km | 1.48* |
| Circulatory ratio | Unit less | 0.22 |
| Elongation ratio | Unit less | 0.67 |
| Over land flow | 1/km | 0.49 |
| Bifurcation ratio | Unit less | 3.4 |
| Drainage texture | Unit less | 3.9 |
| Form factor | Unit less | 0.004 |
Table 1: The circulatory ratio value of the watershed ranged in between 0.04 to 0.41 as shown in the Table 2. A high ercirculator
Table1: Morphological properties of the watershed.
| Sub Water shed | Re | Rc | D | Lg | Rt | Rf | Rb |
|---|---|---|---|---|---|---|---|
| SWS1 | 0.72 | 0.41 | 1.42 | 0.99 | 3.44 | 0.013 | 3.7 |
| SWS2 | 0.73 | 0.22 | 2.17 | 0.96 | 4.33 | 0.019 | 2.55 |
| SWS3 | 0.69 | 0.31 | 1.31 | 1.11 | 5.55 | 0.033 | 2.9 |
| SWS4 | 0.71 | 0.3 | 1.55 | 1.41 | 3.28 | 0.025 | 2.33 |
| SWS5 | 0.84 | 0.21 | 6.36 | 0.99 | 3.21 | 0.036 | 3.44 |
| SWS6 | 0.65 | 0.28 | 0.89 | 0.78 | 4.72 | 0.027 | 5.8 |
| SWS7 | 0.73 | 0.19 | 2.25 | 0.75 | 5.67 | 0.044 | 2.74 |
| SWS8 | 0.68 | 0.38 | 1.01 | 0.66 | 1.55 | 0.021 | 4.6 |
| SWS9 | 0.71 | 0.39 | 1.49 | 0.79 | 3 | 0.031 | 5.6 |
| SWS10 | 0.8 | 0.23 | 4.53 | 0.69 | 1.6 | 0.052 | 2.21 |
| SWS11 | 0.68 | 0.32 | 1.07 | 0.74 | 2.44 | 0.063 | 3.33 |
| SWS12 | 0.72 | 0.22 | 1.67 | 0.55 | 6.4 | 0.035 | 3.16 |
| SWS13 | 0.71 | 0.36 | 1.78 | 0.88 | 3.2 | 0.03 | 5.55 |
| SWS14 | 0.69 | 0.28 | 1.36 | 0.95 | 5.5 | 0.023 | 4.37 |
| SWS15 | 0.71 | 0.37 | 1.4 | 0.88 | 4.6 | 0.059 | 3.66 |
| SWS16 | 0.77 | 0.4 | 8.3 | 0.94 | 6.4 | 0.044 | 5.42 |
| SWS17 | 0.77 | 0.21 | 3.48 | 1.33 | 2.3 | 0.049 | 4.22 |
| SWS18 | 0.71 | 0.26 | 1.74 | 1.01 | 1.66 | 0.02 | 2.33 |
| SWS19 | 0.68 | 0.3 | 1.11 | 2.04 | 1.1 | 0.023 | 2.4 |
Table 2: The circulatory ratio value of the watershed ranged in between 0.04 to 0.41 as shown in the Table 2. A high ercirculator
Table2: Each catchment morphology property.
Table 2 shown that the highest drainage density, which is responsible for higher erosion rate corresponds to sub watershed SW16.SWS5.SWS10.SWS17.
The elongation ratio value of kulfo sub watershed ranged in between 0.65 to 0.84. It is under the range reported by Sunil, et al. [3]. The elongation ratio value generally exhibit variation from 0.6 to 1 over a wide variety of climatic and geologic type. The elongation ratio greater than 1 indicates lower relief. Whereas, the elongation ration value of mini watershed range in between 0.61 to 0.99 indicates high relief and steep slope landscape. In the study area the elongation ratio value is less than 0.99 in all sub watersheds. Therefore, it is characterized by high relief and steep slope and vulnerable to erosion process as shown in the Table 2.
The circulatory ratio value of the watershed ranged in between 0.04 to 0.41 as shown in the Table 2. A high ercirculatory ratio induces lesser erosion. Circulatory ratio is helpful for both assessment of erosion prone areas and flood hazard. The higher circulatory ratio values the higher flood hazard at pick time at the outlet point. Circulatory ratio under watershed study ranges in between 0.17 to 0.64. The circulatory ratio is greater than 0.64 are categorized under flood hazard. Therefore, the circulatory ratio value of all sub watersheds in the study area is blow 0.64.Hence, not under flood hazard but affected by erosion severity.
Smaller value of the form factor more elongated will be the basin. The basin with high form factor has lower peak flow [3]. Whereas, the elongated watershed with low form factors have been lower peak flow and longer duration. In the present case form factor values ranged from 0.02 to 0.51 indicating them to be elongated in shape and suggesting flatter peak flow for longer duration. Flood flows of such elongated sub- watersheds are easier to manage than those with the circular basin. It is the total number of stream segment of all orders per perimeter of the area [2]. Horton recognized the infiltration capacity as the single important factor which influences drainage texture. Drainage texture are very coarse <2, coarse 2-4, moderate 4-6, fine 6-8 and very fine > 8. The lower value of drainage texture indicates the basin is plain with lower degree of the slope. The sub watershed SWS12 and SWS16 are found to have fine drainage texture. The SWS8, SWS10, SWS18and SWS19 are found to have very coarse texture and the SWS1, SWS4,SWS9, SWS11,SWS13 and SWS14are found to have coarse drainage texture whereas the remaining sub- watersheds have moderate drainage texture. Therefore, the SWS8, SWS10, SWS18 and SWS19 are plain or almost plain and have less severe erosion risk.
Smaller bifurcation ratio value indicates that the low structural disturbance and drainage patterns have not been distorted. Whereas high bifurcation ratio value indicate the high structural complexity and low permeability the terrain [3]. The bifurcation ratio of the study area is found to range from 2.21 to 5.8.The length of over land flow of Kulfo watershed has ranged from 0.55 in SWS13 to 2.04 in SWS19. Therefore, these indicate that the watershed includes both plain area and steep slopes.
Now a day; catchment morphology analysis was used for prioritization of watersheds for soil and water conservation at different scales: sub watersheds. Mini-watersheds and micro-watersheds. Erosion risk parameters pertinent to linear and shape morphologic variables were employed for prioritizing watersheds. The linear parameters are: Bifurcation ratio (Rb), drainage density (Dd), length of overland flow (Lo).and drainage texture ratio (T). Similarly, the shape factors include: form factor (Rf), elongation ratio (Re) and circularity ratio (Rc). It has been stated earlier that linear parameters have a direct relationship with erodibility. Therefore, the highest value of the linear parameters was ranked 1, second highest value ranked 2 and soon. On the other hand, the shape parameters have been an inverse relation with linear parameters. Hence, the lower their value were the greater the erodibility. As a result, the lowest value of shape parameter was rated as rank 1 and second lowest as rank 2 and so on. Then cumulative priority was computed by adding up all the ranks of linear parameters and shape parameters and then dividing by the number of all parameters included in the analysis. From the group of sub- watersheds, the highest prioritized rank (score) was affirmed to sub-watersheds having the lowest compound factor and viceversa. Finally, all sub-watersheds were grouped into four priority categories based on the range of cumulative factor (Cf) values. 1) Very high priority (5.0 - 7.9); 2) High priority (8.0 – 10.9); 3) Moderate priority (11.0 – 13.9); 4) Low priority (14-16.9)
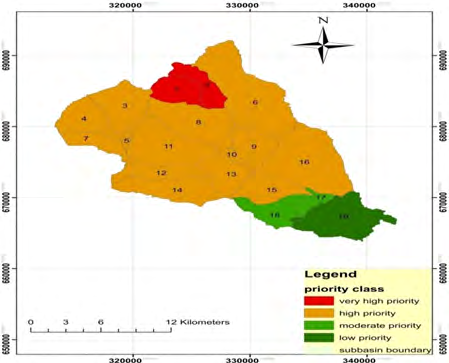
As shown on the (Figure 4) the SWS1 and SWS2 have been very high priority for soil and water conservation based on their cumulative factors of catchment morphology parameters whereas the SWS19 have been low priority classes. The remaining sub watersheds which are SWS17 and SWS18 and other has been moderate and high priority classes respectively. Based on the morphological result of the catchment priority classes most of the sub watersheds have been under high priority classes. Therefore, most area of the study area was affected by soil loss.
| Sub water shed | Re | Rc. | D | Lg | Rt | Rf | Rb | CP | Priority |
|---|---|---|---|---|---|---|---|---|---|
| SWS1 | 1 | 1 | 8 | 6 | 9 | 1 | 8 | 5.71 | 1 |
| SWS2 | 5 | 13 | 14 | 8 | 8 | 2 | 15 | 9.29 | 8 |
| SWS3 | 14 | 1 | 5 | 1 | 4 | 11 | 13 | 8.29 | 3 |
| SWS4 | 9 | 8 | 10 | 2 | 10 | 7 | 17 | 9 | 7 |
| SWS5 | 1 | 15 | 18 | 6 | 11 | 13 | 10 | 10.57 | 14 |
| SWS6 | 19 | 10 | 1 | 14 | 6 | 8 | 1 | 8.43 | 5 |
| SWS7 | 5 | 17 | 15 | 15 | 3 | 14 | 14 | 11.86 | 17 |
| S WS8 | 16 | 3 | 2 | 18 | 18 | 4 | 5 | 9.43 | 10 |
| SWS9 | 9 | 2 | 9 | 13 | 13 | 10 | 2 | 8.29 | 3 |
| SWS1O | 2 | 12 | 17 | 17 | 17 | 17 | 19 | 14.43 | 19 |
| SWS11 | 16 | 6 | 3 | 16 | 14 | 19 | 11 | 12.14 | 18 |
| SWS12 | 1 | 13 | 11 | 19 | 1 | 12 | 12 | 10.17 | 15 |
| SWS13 | 9 | 5 | 13 | 11 | 12 | 9 | 3 | S.86 | 6 |
| SWS14 | 14 | 10 | 6 | 9 | 5 | 5 | 6 | 7.86 | 2 |
| SWS15 | 9 | 4 | 7 | 11 | 7 | 18 | 9 | 9.29 | 8 |
| SWS16 | 3 | 19 | 19 | 10 | 1 | 14 | 4 | 10 | 12 |
| SWS17 | 3 | 15 | 16 | 3 | 15 | 16 | 7 | 10.71 | 15 |
| SWS18 | 9 | 11 | 12 | 5 | 16 | 2 | 17 | 10.43 | 13 |
| SWS19 | 16 | 8 | 4 | 1 | 19 | 5 | 16 | 9.86 | 11 |
Table 3: Morphological prioritization of sub watershed.
Table 3 shown that assign weights for each morphological characteristic were averaged out and again divided into different classes. Thus a single weight was assigned for all the morphological parameters taken together. Weights were assigned to each range of average weight. Assuming, the higher morphological weight induces higher erosion. The prioritization based on severity of morphogical characteristics. The linear parameters of catchment morphology are drainage density, bifurcation ratio, Drainage texture and over land has direct relationship with erodibility. Hence, ranking of each sub watershed. The highest value of linear parameter was assigned as rank 1.The second highest value was assigned as rank 2 and the least value were last in rank (Table 3). The shape parameters of catchment morphology are like circulatory ratio, elongation ratio and form factor have not direct relation with soil loss effect. The lower value of shape factor is the high erodibility. Thus the lowest values of shape factor parameter were assigned as rank 1.The second lowest value assigned as rank as 2 and the highest value were assigned as least in rank. Therefore, the ranking of each sub watershed has been determined by assigning the highest priority based on highest value in case of linear parameter and lowest value in case of shape parameter.
Conclusion
The SWS1 and SWS2 were found to be under very high priority for soil and water conservation based on their cumulative factors of catchment morphology parameters whereas the SWS19 have been low priority classes. The remaining sub watersheds were found to fell under moderate and high priority classes. Based on the morphological result of the catchment priority classes most of the sub watersheds have been under high priority classes. Therefore, most area of the study watershed was affected by soil loss.
References
-
Horton RE (1932) Drainage basin characteristics. Eos Trans-America Geophysics Union 13(1): 350-361.
-
Horton RE (1945) Erosional development of streams and their drainage basins. hydro-physical approach to quantitative morphology. J Geological Society of America 56(3): 275-370.
-
Shinde V, Tiwari KN, Singh M (2010) Prioritization of micro watersheds on the basis of soil erosion hazard using remote sensing and geographic information system. International Journal of Water Resources and Environmental Engineering 4(3): 160-166.
- Lessons to Learn: Trees are More than the Lungs of the World
- Community Forestry Enterprises as a Model for Sustainable Forest Development: The Case Of The "Baja Tarahumara" in Chihuahua, Mexico
- Ecological and Socio-Economic Impacts of Chromolaena odorata and Mesosphaerum suaveolens, Two Invasive Alien Species in Central and Southern Benin, West Africa
- Epigenetic Sustainability: Modeling the Human Factor as a Natural Resource through Science 4.0 and the NR3C1 Biological Pilot
- Growth-at-Risk: A Framework for Assessing Economic Vulnerability
- The Rural Territory as a Socioecological System for the Management of Public Policy for Sustainable Rural Development