First Evidence of Spatial Relationships between Ecosystem Functioning and Services in the marine environment
The complexity of the marine system and the rate of anthropogenic impacts on ecosystem functioning demand a synthetic conceptual framework to organize the scientific knowledge needed to better conserve Nature and maintain ecosystem services supply. Currently, the most used conceptual framework is the cascade model that describe a tight positive link among biodiversity, ecosystem functioning and services. The present study explores the spatial relationship between ecosystem functioning and services discussing its heterogeneity. It warns the next generation of researchers on ecosystem services to quantify even ecosystem functioning in their spatial efforts, to better set real sustainable management strategies. The unified framework of ecosystem services and ecosystem functioning assessment will further the goal for protecting nature while humans use it.
Introduction
Since the pioneer paper of Costanza, et al. [1] ecosystem services (ESs), defined as the benefits that ecological systems provide to humans, are a widely used metric to measure Nature and its conservation status [2, 3, 4, 5, 6, 7]. Questioning the correctness of this metric as proxy of natural systems, several studies have focused on the spatial relationship between biodiversity and ESs [8, 9, 10, 11, 12, 13]. Scattered and poor are the consideration about the spatial relationship between ecosystem functioning (EF) and services [14]. In ESs assessments EF measurement is often shaded using indirect metrics of it such as ecosystem structural components (i.e., habitats and their characteristics) [15, 16]. Still, works that empirically demonstrated whether and how ESs spatially relates with EF indicators are lacking. Theoretically, biodiversity and EF underpins ESs supply as explained by one of the most known theoretical frameworks: the cascade model [17, 18, 19]. Notwithstanding the wealth of studies using the concept of the ES cascade and, its usefulness for making the ES concept more accessible to the non-science community [20] some authors Balvanera P, Mumby PJ, Peterson MJ, Cardinale BJ [21, 22, 23, 24] have already pointed out the importance of explicitly presenting ESs as discreet and incomplete aspects of ecosystem functions to ensure the complementary valuation of EF indicator and biodiversity. Empirically, Naidoo, et al. [25] proved globally that regions selected to maximize biodiversity provide no more ecosystem services than regions chosen randomly. Furthermore, Costanza, et al. [26] highlighted that the conceptualization of ES through the cascade model is for some aspects an oversimplification, as it does not capture the complex and dynamic connections occurring between the ecosystem structures (i.e., biodiversity), EF, and ESs.
The main misconception of the ES cascade framework lies in the anthropocentric-defined concept of EF. In the cascade model, the functioning is described as the capacity or capability of the ecosystem to do something potentially useful to people [1, 19, 20, 27, 28, 29]. However, as Jax [30] stated, the term ‘function’ can mean several other things in ecology. It can mean capability, but it is often used more generally to refer to processes that operate within an ecosystem (e.g., nutrient cycling, the flow of energy and matter through predation, top-down control), and especially exists even when a human beneficiary is absent. Accordingly, Wallace [31] and many other ecologists describe EF as functions serving Nature per se, without being necessarily useful to people. Hence, these functional aspects may even not be positively directly related to human benefits, as the ES cascade instead describes.
Overall, to understand any system, empirical knowledge is needed [32] as even the ‘scientific method’ simple states, in particular when the system described is complex such as the natural ecosystems. Unless we went back in time when for evaluating marine ecosystem status studying focal species or one indicator alone was acceptable, system-level phenomena should be the way forward in Ecosystem-based Management (EbM) [33, 34, 35, 36, 37].
The present article seeks a better understanding of the spatial relationships between marine EF and ES indicators using the Adriatic Sea as the study case. To accomplish it I have searched for an evidence-based direct and positive spatial relationship among different EF and ESs indicators as the cascade model theoretically supports. Given that both EF and ESs quantifications are highly dependent on the indicator chosen [30, 38, 39, 40] to reduce this possible biased the present article considers different ES assessments and EF indicators.
Materials and Methods
The quantification of spatial overlaps or correlations between five EF indicators (i.e., bottom-up forces, top- down forces, biodiversity, and trophy-dynamics) and 11 ES indicators (i.e., supporting, provisioning, cultural, regulating) for the same area of study (i.e., the Adriatic Sea) and, where possible for the same year (2018/2019) have been gathered (Table 1). First, these indicators have been extracted on a common grid of 20km horizontal resolution (i.e., OSMOSE- MED model grid as the lowest resolution of the gathered data) to make them comparable. Second, all the indicators considered in the present analysis have been normalized through min-max normalization because of the different units of measurement. Eventually, pairwise relationships between all ES and EF indicators have been unrevealed by the average correlation between Kendal, Spearman and Pearson methods (alpha=0.05). Normality is not an assumption and transformation (square root or log) did not improve skew- ness values therefore untransformed data were used.
| EF or ES | Indicator | Description | Unit of measurement | Source | Reference |
|---|---|---|---|---|---|
| Primary productivity | Total chlorophyll-A | Chlorophyll-A is the as proxy of primary production | Kg/m3 | POLCOM-ERSEM model (~ 12Km of horizontal resolution) | [41] |
| Top Down Control | Biomass of 100 High Trophic Level species | Biomass of species exerting a top-down control on the community | Tons/pixel | OSMOSE-MED (~ 20Km horizontal resolution) | [42] |
| Trophodynamics | Efficiency Cumulated Indicator (ECI) | The process linked with the flow of matter and energy across trophic levels in an ecosystem. In particular ECI measures how efficient is the trophic transfer | Unitless | Calculated with biological variables of the species present by climate suitability in the Adriatic Sea (~ 7Km horizontal resolution) | Basconi, under review |
| Biodiversity | Species richness | Presence/Absence over the grid was calculated with climate suitability models for 579 fish species | Species richness | Modeled with Temperature and Salinity (BIOMOD2) (~ 7Km horizontal resolution) | Basconi, under review |
| Trophodynamics | Biomass Residency Time (BRT) | The process linked with the flow of matter and energy across trophic levels in an ecosystem. In particular BRT measures how efficient is the transfer of matter and energy. | Unitless | Calculated with biological variables of the species present by climate suitability in the Adriatic Sea (~ 7Km horizontal resolution) | Basconi, under review |
| Carbon sequestration capacity & flow | Carbon sequestered by the marine habitats | Important habitats for the sequestration of carbon in the Northern-Central Adriatic Sea have been mapped. The rate of sequestration per each habitat was retrieved from the literature. The habitat areas were multiplied by their carbon sequestration and estimate per each habitat have been summed together | Kg CO2/Km2/ Year | Calculated for Basconi et al., 2023 | Basconi et al., 2023 |
| Tourism capacity | Attractiveness potential | Questionnaires directed to seaside tourists have been used to give weight to different features of the coastal-marine environment included in the composite indicator of attractiveness potential | Unitless | Calculated for Basconi et al., 2023 | Basconi et al., 2023 |
| Recreational boating capacity | Attractiveness potential | Questionnaires directed to recreational boaters have been used to give weight to different features of the coastal-marine environment included in the composite indicator of attractiveness potential | Unitless | Calculated for Basconi et al., 2023 | Basconi et al., 2023 |
| Recreational boating flow | Usage of the marine space by recreational boaters | The number of leisure boats by maritime compartment was retrieved from the Coast Guard registry (‘Capitaneria di Porto’) and the Croatian Bureau of Statistics then divided in the marinas along both coastal sides. Questionnaires were used to set the number of both trips. | N° of boat trip/ Km2/Year | Calculated for Basconi et al., 2023 | Basconi et al., 2023 |
| Mussel aquaculture capacity | Tons of mussel producible/Km2/ Year | Assessed through the eco- physiological model (R package RAC, Baldan et al. 2018) calibrated for Mytilus galloprovincialis | Tons of mussel producible/Km2/ Year | Calculated for Basconi et al., 2023 | Basconi et al., 2023 |
| Industrial fishery flow | Measurement of fishing efforts | Spatial explicit fishing effort was estimated by using the Automatic Identification System (AIS) | Trawls fishing effort/km2/year | Extracted from Russo, et al. 2020 | Basconi et al., 2023 |
| Ess total capacity | The capacity of marine habitats to provide marine ecosystem services | ESs have been measured from EUNIS seabed habitats (EmodNet website) | Unitless | Modeled by a matrix approach | [16] |
| Supporting ESs sea bottom | Quantification of the supporting ESs at the sea bottom | ESs delivery was mapped starting from spatial explicit marine components specific to the sea bottom | Unitless | Modeled by richness and hot spot analysis | [5] |
| Supporting ESs water column | Quantification of the supporting ESs in the water column | ESs delivery was mapped starting from spatial explicit marine components specific in the water column | Unitless | Modeled by richness and hot spot analysis | [5] |
| Supporting ESs sea surface | Quantification of the supporting ESs at the surface | ESs delivery was mapped starting from spatial explicit marine components specific to the surface | Unitless | Modeled by richness and hot spot analysis | [5] |
| Eutrophication | TRIX | Trophic index (considering dissolved oxygen, ChlA, total Phosphorous and Nitrogen) | Unitless | TRIX modeled for the Adriatic (~ 2Km) | [43] |
Table 1: Indicators of Ecosystem Functioning (EF) and Ecosystem Services (ESs) measured or modeled in the Adriatic Sea, and gathe
Ecosystem Functioning Indicators
Spatial explicit EF indicators have been gathered from different sources (Table 4). Pelagic bottom-up control has been extracted from the POLCOM-ERSEM model as the concentration of Chlorophyll-A (mg/cm3), using it as a proxy of primary productivity. Top-down control has been measured by the biomass of the 100 high trophic-level species modeled by OSMOSE-MED [42]. Transfer of energy and matter across trophic levels namely trophodynamics has been measured by Efficiency Cumulated Indicator (ECI) and, Biomass Residency Time (BRT) [44]. Biodiversity even if more measure of structure is complementary to EF; therefore, it has been included here. Biodiversity has been calculated after a climate suitability approach based on the 579 fish species endemic or if aliens established in the Mediterranean Sea, Basconi et al.
Ecosystem Services Indicators
Spatial explicit ES indicators have been extracted from three different assessments carried out in the Adriatic Sea [5, 16] Basconi et al., 2023 . The whole set of assessments approached with snapshot representations of Adriatic marine ESs, using among them different approaches, data sources, and analysis (reported briefly in Table 1). Used ESs have been, three maps of supporting ESs specifically related to the marine domains (i.e., surface, water column, bottom) [5], a general ability of the Adriatic marine area to deliver ESs [16], and two provisioning services (i.e, mussel aquaculture, fishery), two cultural services (i.e., tourism and recreational boating), and one regulating services (i.e., carbon sequestration). Furthermore, the disservice of eutrophication measured by the TRIX regional index was included [43].
Results
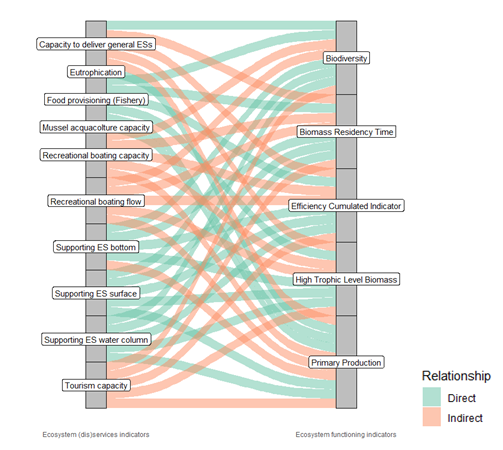
Many are the direct or indirect theoretical connections found by the author through expert opinion (Figure 1) among EF and ESs indicators. However, they do not seem to subsist in the spatial analysis results (Figure 2). Correlation co-efficient of the pairwise comparisons for all the indicators considered can be found in Table 1, Supplementary materials.
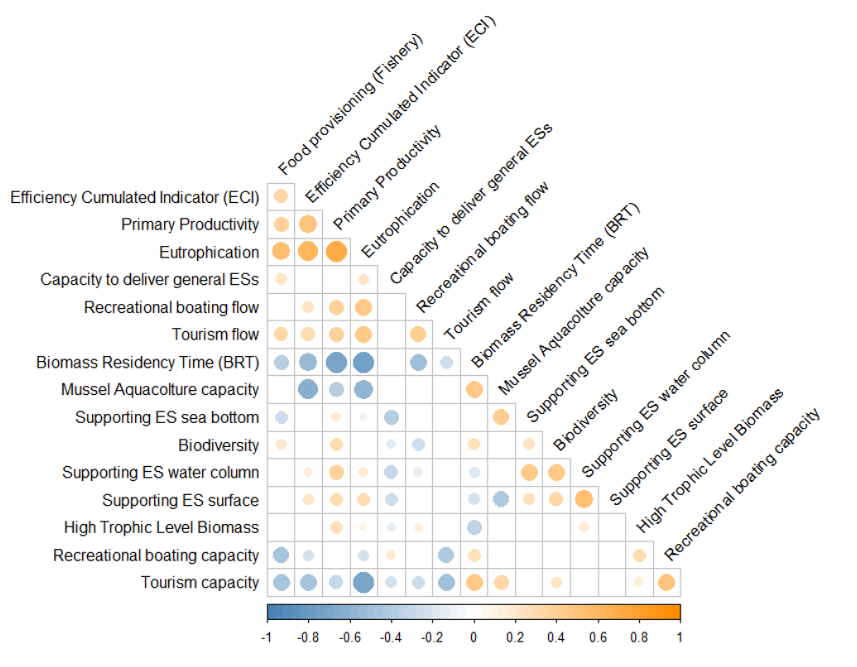
Overall, there is not a unique strictly positive or strictly negative trend describing the spatial dependency of ESs on EF indicators in the Adriatic Sea (Figure 2). To effectively find the bigger picture of the spatial relationship between ESs and EF indicators solely strong correlations (i.e., higher than 0.5 or lower than – 0.5) have been reported as results. Among them, BRT negatively links with primary productivity (corr= - 0.71) and accordingly with eutrophication (corr= - 0.74). On the contrary, ECI positively correlates with primary production (corr= 0.51) and eutrophication (corr= 0.63). ECI negatively correlates with the capacity of mussel aquaculture (corr= - 0.73). The disservice of eutrophicated water is negatively correlated with both capacities of tourism (corr= - 0.70) and mussel aquaculture (corr= - 0.57) while possibly positively correlated (corr= 0.55) with the provisioning service of the fishery. There is even a correlation among services with positive correlations between supporting ESs in the water column and supporting ESs at the surface (corr= 0.53).
Discussion
Rarely have the ecosystem processes and functions been empirically linked to human well-being and activities. According to the cascade framework [17, 20] high values of ecosystem functioning correspond to high values of ecosystem services. Theoretically, without ecosystems that function well, ESs is not delivered but still, the spatial relationship can be highly non-linear or even disappear in certain contexts. Notwithstanding the static linkages made for crafting Figure 1, the correlations between ESs and EF are highly dynamic and context-dependent as the marine system is. There are examples in which these two facets of ecology could exist even in opposite trends in the same spatial unit. For instance, in the study area considered for the present work (i.e., the Adriatic Sea) together with other authors a survey was prepared for users of the Adriatic marine space. 250 questionnaires were answered by recreational boaters and around half of them were showing a low interest in the health of the marine ecosystem. In fact, to the question “How many boat trips will you do in detrimental water quality?” (Explaining what ecologically is meant for it) 50% of respondents replied with an “unchanged number of trips”.
A second instance, include the present and future condition of Ocean warming. In fact, the Mediterranean has been projected to tropicalize over time [45, 46]. The opening of the Suez Canal is and will further allow species to migrate to the Mediterranean Sea. Whether the Mediterranean Sea assumes tropical abiotic conditions, tropical species will settle in the empty ecological niches (e.g., see species reported by CIESM Atlas, Moschella, et al. [47]). Besides invasive species that could disrupt native ecosystems, the species adaptable to new climate change-driven conditions are the one that functions in those peculiar environmental conditions. In other words, ecological communities always adapt to physicochemical conditions as the “red queen hypothesis” states [48]. The real caveat is how much the market will be adaptable to these new species. It has been already proven that alien or invasive species could be a problem for the Blue Economy in the Mediterranean Sea [49].
Moreover, straightforward examples deal with the ‘anthropization’ of ESs which are linked to nature (as described by ES definition itself, Costanza [1] but for which socio-economic drivers are strong enough to maintain the services even when ecosystems are detrimental conditions. Examples in the coastal and marine ecosystem are coastal erosion prevention by artificial protections as well as tourism by the creation of nature surrogates to maintain the delivery of ESs, Basconi et al., 2023 [50, 51]. These are examples of ESs that might be largely independent of the level of functioning of ecosystems and therefore remain high (at least in the short term) even when EF is low. These instances are important examples of spatial detachment between ecosystem functioning and certain services (i.e., cultural service – recreational boating and tourism, provisioning service – fishery supply, regulating service – coastal erosion prevention) which should be always kept in mind by ES assessment practitioners.
Accordingly, the results of the present paper do not show any evident (i.e., correlation coefficent>0.5 or < - 0.5) spatial correlation between the used ESs and EF indicators. Whether they could maintain the relationship will be non-linear and therefore not detected by the coefficients of correlation used. The only presented evident correlation between EF and ESs indicators is the Efficiency Cumulated Indicator and the capacity of the ecosystem to produce mussels in aquaculture farming but it is negative. All the other relevant correlations are among EF indicators (e.g., between primary productivity and Efficiency Cumulated Indicator). From an ecosystem functioning point of view, Biomass Residency Time shows the opposite correlation of the Efficiency Cumulated Indicator. The former represents the inverse of trophic transfer speed and it is stated in the literature [44] that ecosystem functions well when both trophic transfer efficiency and speed are high. In other words, this is the reason behind the opposite correlations between the two in a snapshot analysis such as the one reported in the present paper.
Some correlations shown in Figure 2 serve to possibly prove that the analysis is sensitive in representing ecologically known spatial patterns in the marine realm. For instance, the positive relationship between primary productivity (extracted from a biogeochemical model) and eutrophication (coastally measured through the TRIX indicators by ARPAs and modeled at the whole basin scale). It could prove that the present analysis can show spatial relationships whether present.
The reported results challenge the assumption that a high level of biodiversity and a high rate of ecosystem functioning will always promote high ESs or that these high values will enhance ES supply in the same space. Other research carried out globally [52] and in the terrestrial realm [14] has proven EF and ESs indicators to be spatially uncorrelated. The present paper’s results support the explicit use of ESs as discreet and incomplete aspects of EF enables the social and political changes required to ensure the use ESs metric in an ecologically meaningful manner [23]. A critical step in sustainable strategies is to not only agree on indicators that are compelling, intuitive, understandable, and defensible to all stakeholders but also capture the whole complexity of the system. Measuring critical states and processes that underlie the complexity of the ecosystem dynamics (i.e., Functioning-energy flows, Resilience-ability to recover from perturbation, Structure-species organization) is essential to understand the status of conservation or management. An agreement exists about the need to move towards more holistic but not simplistic indicators that recognize the full array of interactions within an ecosystem while measuring ecosystem services [53, 54, 55, 56]. This is particularly true in a fast-changing benchmark as in the climate change era, in an already multiple stressors scenarios impacting the marine biodiversity and EF [57, 58, 59, 60]. Whilst the spatial relationships between EF and ESs should be further confirmed with studies in other marine areas as well as in long-term studies, a precautionary approach to ecosystem conservation would seem prudent in the meanwhile including EF metrics in multiple ESs assessments.
Conclusion
Empirical knowledge demonstrating the spatial relationships among ecosystem functioning and services is rare. The current study presents for the first time in the marine realm a lack of spatial coherence between ecosystem functioning and services paving the road for a new coming branch of research seeking a better understanding between EF and ESs spatial relationships.
The present results suggest an urgent need to fuel interdisciplinary science bridging together the different metrics of (i) ecosystem structure (e.g., species richness, abundance, biomass), (ii) ecosystem functioning (e.g., primary productivity, tropho-dynamics, high trophic level top-down control and, (iii) ecosystem services (e.g., biophysical measurements, quantitative measurements, stakeholder preferences). De-structuring complex system into complicated ones, avoiding the pitfall of oversimplification, is the way forward for both natural resource management and conservation.
References
-
Costanza R, D’Arge R, de Groot R, Farber S, Grasso M, et al. (1997) The Value of the World’s Ecosystem Services and Natural Capital. Nature 387(6630): 253-260.
-
Abunge C, Coulthard S, Daw TM (2013) Connecting Marine Ecosystem Services to Human Well-Being: Insights from Participatory Well-Being Assessment in Kenya. Ambio 42(8): 1010-1021.
-
Veidemane K, Ruskule A, Strake S, Purina I, Aigars J, et al. (2017) Application of the Marine Ecosystem Services Approach in the Development of the Maritime Spatial Plan of Latvia. International Journal of Biodiversity Science, Ecosystem Services and Management 13(1): 398-411.
-
Nahuelhual L, Vergara X, Kusch A, Campos G, Droguett D (2017) Mapping Ecosystem Services for Marine Spatial Planning: Recreation Opportunities in Sub-Antarctic Chile. Marine Policy 81: 211-218.
-
Manea E, di Carlo D, Depellegrin D, Agardy T, Gissi E (2019) Multidimensional Assessment of Supporting Ecosystem Services for Marine Spatial Planning of the Adriatic Sea. Ecological Indicators 101: 821-837.
-
Friedrich LA, Glegg G, Fletcher S, Dodds W, Philippe M, et al. (2020) Using Ecosystem Service Assessments to Support Participatory Marine Spatial Planning. Ocean and Coastal Management 188: 105121.
-
Hattam C, Broszeit S, Langmead O, Praptiwi RA, Lim VC, et al. (2021) A Matrix Approach to Tropical Marine Ecosystem Service Assessments in South East Asia. Ecosystem Services 51(June): 101346.
-
Worm B, Barbier EB, Beaumont N, Duffy JE, Folke C, et al. (2006) Impacts of Biodiversity Loss on Ocean Ecosystem Services. Science 314(5800): 787-790.
-
Quijas S, Schmid B, Balvanera P (2010) Plant Diversity Enhances Provision of Ecosystem Services: A New Synthesis. Basic and Applied Ecology 11(7): 582-593.
-
Mace GM, Norris K, Fitter AH (2012) Biodiversity and Ecosystem Services: A Multilayered Relationship. Trends in Ecology & Evolution 27(1): 19-26.
-
Schneiders A, van Daele T, van Landuyt W, van Reeth W (2012) Biodiversity and Ecosystem Services: Complementary Approaches for Ecosystem Management? Ecological Indicators 21: 123-133.
-
Eastwood A, Brooker R, Irvine RJ, Artz RRE, Norton LR, et al. (2016) Does Nature Conservation Enhance Ecosystem Services Delivery? Ecosystem Services 17(2016): 152- 162.
-
Winter S, Bauer T, Strauss P, Kratschmer S, Paredes D, et al. (2018) Effects of Vegetation Management Intensity on Biodiversity and Ecosystem Services in Vineyards: A Meta-Analysis. Journal of Applied Ecology 55(5): 2484- 2495.
-
Birkhofer K, Andersson GK, Bengtsson J, Bommarco R, Dänhardt J, et al. (2018) Relationships between Multiple Biodiversity Components and Ecosystem Services along a Landscape Complexity Gradient. Biological Conservation 218: 247-253.
-
Pellegrin D, Menegon S, Farella G, Ghezzo M, Gissi E, et al. (2017) Multi-Objective Spatial Tools to Inform Maritime Spatial Planning in the Adriatic Sea. Science of the Total Environment 609: 1627-1639.
-
Elise S, Urbina-Barreto I, Pinel R, Mahamadaly V, Bureau S, et al. (2019) Assessing Key Ecosystem Functions Through Soundscapes: A New Perspective from Coral Reefs. Ecological Indicators 107: 105623.
-
Haines-Young R, Potschin M (2010) The Links between Biodiversity, Ecosystem Services and Human Well-Being. In: David GR (Eds.), Ecosystem Ecology: A New Synthesis. Cambridge University Press.
-
de Groot RS, Alkemade R, Braat L, Hein L, Willemen L (2010) Challenges in Integrating the Concept of Ecosystem Services and Values in Landscape Planning, Management and Decision Making. Ecological Complexity 7(3): 260-272.
-
Potschin MB, Haines-Young RH (2011) Ecosystem Services: Exploring a Geographical Perspective. Progress in Physical Geography: Earth and Environment 35(5): 575-594.
-
Potschin-Young M, Haines-Young R, Görg C, Heink U, Jax K, et al. (2018) Understanding the Role of Conceptual Frameworks: Reading the Ecosystem Service Cascade. Ecosystem Services 29C: 428-440.
-
Balvanera P, Pfisterer AB, Buchmann N, He JS, Nakashizuka T, et al. (2006) Quantifying the Evidence for Biodiversity Effects on Ecosystem Functioning and Services. Ecology Letters 9(10): 1146-1156.
-
Mumby PJ, Broad K, Brumbaugh DR, Dahlgren CP, Harborne AR, et al. (2008) Coral Reef Habitats as Surrogates of Species, Ecological Functions, and Ecosystem Services. Conservation Biology 22(4): 941- 951.
-
Peterson MJ, Hall DM, Feldpausch-Parker AM, Peterson TR (2010) Obscuring Ecosystem Function with Application of the Ecosystem Services Concept. Conservation Biology 24(1): 113-119.
-
Cardinale BJ, Duffy JE, Gonzalez A, Hooper DU, Perrings C, et al. (2012) Biodiversity Loss and Its Impact on Humanity. Nature 486(7401): 59-67.
-
Naidoo R, Balmford A, Costanza R, Fisher B, Green RE, et al. (2008) Global Mapping of Ecosystem Services and Conservation Priorities. Proceedings of the National Academy of Sciences of the United States of America 105(28): 9495-9500.
-
Costanza R, de Groot R, Braat L, Kubiszewski I, Fioramonti L, et al. (2017) Twenty Years of Ecosystem Services: How Far Have We Come and How Far Do We Still Need To Go? Ecosystem Services 28: 1-16.
-
Costanza R, D’arge R, de Groot R, Farber S, Grasso M, et al. (1998) The Value of Ecosystem Services: Putting the Issues in Perspective. Ecological Economics 25(1): 67- 72.
-
Daily G (1997) Chapter 1: What are Ecosystem Services. Scientist January: 7-8.
-
de Groot RS, Wilson MA, Boumans RMJ (2002) A Typology for the Classification, Description and Valuation of Ecosystem Functions, Goods and Services. Ecological Economics 41(3): 393-408.
-
Jax K (2005) Function and “Functioning” in Ecology: What does it mean? Oikos 111(3): 641-648.
-
Wallace KJ (2007) Classification of Ecosystem Services: Problems and Solutions. Biological Conservation 139(3- 4): 235-246.
-
Bertness MD, Bruno JF, Silliman BR, Stachowicz JJ (2014) Marine Community Ecology and Conservation. Sunderland, MA: Sinauer Associates Inc.
-
Cohen-Kiener A (2009) Claiming Earth as Common Ground: The Ecological Crisis Through the Lens of Faith. SkyLight Paths Publishing.
-
Rombouts I, Beaugrand G, Fizzala X, Gaill F, Greenstreet SPR, et al. (2013) Food Web Indicators Under the Marine Strategy Framework Directive: From Complexity to Simplicity? Ecological Indicators 29: 246-254.
-
Klain SC, Satterfield TA, Chan KMA (2014) What Matters and Why? Ecosystem Services and their Bundled Qualities. Ecological Economics 107: 310-320.
-
Tam JC, Link JS, Large SI, Andrews K, Friedland KD, et al. (2017) Comparing Apples to Oranges: Common Trends and Thresholds in Anthropogenic and Environmental Pressures Across Multiple Marine Ecosystems. Frontiers in Marine Science 4: 1-17.
-
Brown C, Reyers B, Ingwall-King L, Mapendembe A, Nel J, et al. (2014) Measuring Ecosystem Services: Guidance on Developing Ecosystem Service Indicators. UNEP- WCMC, Cambridge, UK.
-
Heink U, Hauck J, Jax K, Sukopp U (2016) Requirements for the Selection of Ecosystem Service Indicators-The Case of MAES Indicators. Ecological Indicators 61(1): 18-26.
-
Jax K, Furman E, Saarikoski H, Barton DN, Delbaere B, et al. (2018) Handling A Messy World: Lessons Learned When Trying to Make the Ecosystem Services Concept Operational. Ecosystem Services 29: 415-427.
-
Van Oudenhoven AP, Petz K, Alkemade R, Hein L, de Groot RS (2012) Framework for Systematic Indicator Selection to Assess Effects of Land Management on Ecosystem Services. Ecological Indicators 21: 110-122.
-
CMEMS (Copernicus marine services).
-
Moullec F, Velez L, Verley P, Barrier N, Ulses C, et al. (2019) Capturing the Big Picture of Mediterranean Marine Biodiversity with an End-To-End Model of Climate and Fishing Impacts. Progress in Oceanography 178: 102179.
-
Fiori E, Zavatarelli M, Pinardi N, Mazziotti C, Ferrari CR (2016) Observed and Simulated Trophic Index (TRIX) Values for the Adriatic Sea Basin. Natural Hazards and Earth System Sciences 16(9): 2043-2054.
-
Maureaud A, Gascuel D, Colléter M, Palomares MLD, du Pontavice H, et al. (2017) Global Change in the Trophic Functioning of Marine Food Webs. PLoS ONE 12(8): 1-21.
-
Bianchi CN, Morri C (2003) Global Sea Warming and “Tropicalization” of the Mediterranean Sea: Biogeographic and Ecological Aspects. Biogeographia. The Journal of Integrative Biogeography pp: 319-330.
-
Bianchi CN (2007) Biodiversity Issues for the Forthcoming Tropical Mediterranean Sea. Hydrobiologia 580(1): 7-21.
-
Moschella P (2008) The New CIESM Tropicalization Programme- Effects of Climate Warming on Mediterranean Key Taxa. In CIESM Workshop Monographs 35: 47-50.
-
Van Valen L (1973) A New Evolutionary Law. Evol Theory 1: 1-30.
-
Yildirim S, Kaplan M (2022) Seafood Security and Sustainability through Sustainable Development: A Review of Turkish Seafood Market. Research Anthology on Strategies for Achieving Agricultural Sustainability pp: 951-970.
-
Fisher B, Turner K, Zylstra M, Brouwer R, De Groot R, et al. (2008) Ecosystem Services and Economic Theory: Integration for Policy‐Relevant Research. Ecological Applications 18(8): 2050-2067.
-
Gómez-Baggethun E, De Groot R, Lomas PL, Montes C (2010) The History of Ecosystem Services in Economic Theory and Practice: From Early Notions to Markets and Payment Schemes. Ecological Economics 69(6): 1209- 1218.
-
Lindegren M, Holt BG, MacKenzie BR, Rahbek C (2018) A Global Mismatch in the Protection of Multiple Marine Biodiversity Components and Ecosystem Services. Scientific Reports 8(1): 1-8.
-
Link JS (2005) Translating Ecosystem Indicators into Decision Criteria. ICES Journal of Marine Science 62(3): 569-576.
-
Devictor V, Mouillot D, Meynard C, Jiguet F, Thuiller W, et al. (2010) Spatial Mismatch and Congruence between Taxonomic, Phylogenetic and Functional Diversity: The Need for Integrative Conservation Strategies in a Changing world. Ecology Letters 13(8): 1030-1040.
-
Schulp CJE, Alkemade R, Klein Goldewijk K, Petz K (2012) Mapping Ecosystem Functions and Services in Eastern Europe using Global-Scale Data Sets. International Journal of Biodiversity Science, Ecosystem Services and Management 8(1-2): 156-168.
-
Mayer A, Kaufmann L, Kalt G, Matej S, Theurl MC, et al. (2021) Applying the Human Appropriation of Net Primary Production Framework to Map Provisioning Ecosystem Services and their Relation to Ecosystem Functioning across the European Union. Ecosystem Services 51: 101344.
-
Bellwood DR, Meyer CP (2009) Searching for Heat in a Marine Biodiversity Hotspot. Journal of Biogeography 36(4): 569-576.
-
ben Rais Lasram F, Guilhaumon F, Albouy C, Somot S, Thuiller W, et al. (2010) The Mediterranean Sea as a “cul-de-sac” for Endemic Fishes Facing Climate Change. Global Change Biology 16(12): 3233-3245.
-
Rossi T, Connell SD, Nagelkerken I (2017) The Sounds of Silence: Regime Shifts Impoverish Marine Soundscapes. Landscape Ecology 32(2): 239-248.
-
Newbold T, Tittensor DP, Harfoot MB, Scharlemann JP, Purves DW (2020) Non-Linear Changes in Modelled Terrestrial Ecosystems Subjected to Perturbations. Scientific reports 10(1): 1-10.
-
Basconi L, Stocco A, Rova S, Pranovi F (2023) Ecosystem services for supporting coastal and marine resources management, and example from the Adriatic Sea (Central Mediterranean Sea) - B. in press. in “Ocean and Coastal Management”.
- Lessons to Learn: Trees are More than the Lungs of the World
- Community Forestry Enterprises as a Model for Sustainable Forest Development: The Case Of The "Baja Tarahumara" in Chihuahua, Mexico
- Ecological and Socio-Economic Impacts of Chromolaena odorata and Mesosphaerum suaveolens, Two Invasive Alien Species in Central and Southern Benin, West Africa
- Epigenetic Sustainability: Modeling the Human Factor as a Natural Resource through Science 4.0 and the NR3C1 Biological Pilot
- Growth-at-Risk: A Framework for Assessing Economic Vulnerability
- The Rural Territory as a Socioecological System for the Management of Public Policy for Sustainable Rural Development