An Investigation on Subsurface Water Quality of Dungargarh (Rajasthan)
The availability of hygienic drinking water has become vital in the era of changing climate especially of ground water. This paper aims to investigate the ground water quality of Dungargarh (Rajasthan). Ground water samples were collected from different villages of Dungargarh. After sample collection, water analysis of selected physico-chemical parameters was done. These parameters were turbidity, pH, electrical conductivity, total dissolved solids, salinity, chloride, fluoride, and nitrate. Data were analyzed statistically. The results depicted the ground water quality of Dungargarh almost appropriate for drinking and irrigation purposes. However, regular evaluation of groundwater quality is recommended in Dungargarh block to develop strategies for reduction of the excess dissolved chemicals.
Introduction
Groundwater is the water present beneath Earth’s surface in rocks, soil pore spaces and in the fractures of rock formations. It is widely acknowledged as an important drinking water source globally. It is often considered more reliable than surface water. Currently, groundwater resources are under threat from overexploitation and pollution. Due to overexploitation, groundwater is shifting from a reserve resource into a systematically abstracted in an uncontrolled or unregulated manner. At the same time, groundwater quality is under threat from an ever-increasing list of anthropogenic pollutants. However, groundwater remains poorly understood and inadequately protected while management and regulation steps are going on. Which resulted in widespread stress on groundwater resources.
Developing countries are facing lack of basic water access and its safe management. Groundwater development is considered a key strategy for addressing gaps in service delivery and for building resilience to the impacts of climate change. The present paper aims to investigate subsurface water quality of Dungargarh (Rajasthan).
Materials and Methods
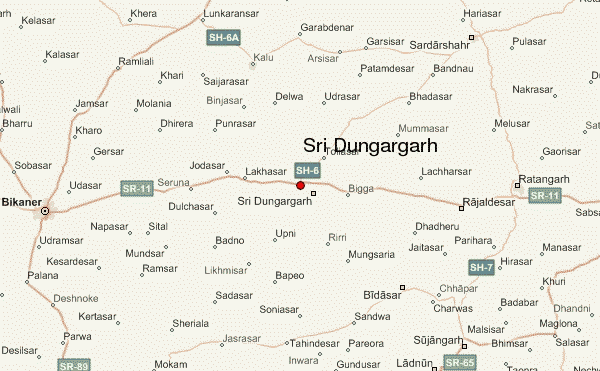
The study area was Dungargarh which is a town and a tehsil in Bikaner district of Rajasthan (India). It is located at the Bikaner-Jaipur Road (National Highway 11) with 70 km distance from Bikaner city. It is surrounded by sandy tilos. Dungargarh is 267 m above sea level and located at 28.08° N and 74.02° E. It has a population of 294319 as per Census 2011 [1]. Map of Dungargarh and its villages (sampling sites) is shown in Figure 1. The details of the study site are depicted in Table 1.
| Sampling Number | Sampling site (village) | Latitude | Longitude | Population (Census 2011) |
|---|---|---|---|---|
| S1 | Bana | 73.311944 | 28.016667 | 5693 |
| S2 | Bhojas | 73.9242251 | 28.0520998 | 1279 |
| S3 | Hemasar | 73.94508 | 28.0716939 | 1110 |
| S4 | Bainisar | 73.3 | 28.01 | 2,718 |
| S5 | Momasar | 73.311944 | 28.016667 | 13,337 |
| S6 | Soniasar | 73.311944 | 28.016667 | 1922 |
| S7 | Toliyasar | 73.3139703 | 28.0173739 | 3194 |
| S8 | Riri | 73.3119 | 28.0167 | 10,869 |
| S9 | Punrasar | 73.7833 | 28.216667 | 6,169 |
| S10 | Jetasar | 74.0667287 | 28.0882262 | 3205 |
| S11 | Dholia | 74.0476 | 28.209176 | 972 |
| S12 | Bigga | 73.311944 | 28.016667 | 6638 |
| S13 | Dulchasar | 74.0946 | 28.7037065 | 4633 |
| S14 | Gusainsar | 73.6389 | 28.066033 | 4924 |
| S15 | Salasar | 73.1467619 | 27.9795722 | 764 |
| S16 | Satleran | 73.311944 | 28.016667 | 1371 |
| S17 | Adsar | 74.2120 | 28.2400421 | 4328 |
| S18 | Thukariyasar | 74.1122 | 28.2111598 | 5589 |
| S19 | Dungargarh | 73.977727 | 28.1562195 | 53294 |
| S20 | Gopalsar | 73.8477874 | 28.060017 | 2167 |
Table 1: Details of study area.
Sampling and analysis: Total 20 groundwater samples were collected from hand pumps, tube wells, open wells of villages of Dungargarh (Bikaner, Rajasthan). The samples were collected in clean bottles of 200 ml. Samples were analyzed for the estimation of physical and chemical properties. The studied parameters were pH, EC, TDS, salinity, turbidity, nitrate, fluoride, and chloride by following standard methods of APHA [2] as mentioned in Table 2. Turbidity was measured by the turbidity meter or nephelometer. pH and EC were measured by using portable digital pH meter and conductivity meter respectively. The concentrations of fluoride and nitrate were estimated by spectrophotometric method. After sample analysis, data were utilized for result interpretation.
| Parameters | Methods |
|---|---|
| pH | pH meter |
| Electrical Conductivity (E.C.) | Conductivity meter |
| Total dissolved solids (T.D.S.) | Gravimetric titration |
| Salinity | Salinometer |
| Turbidity | Nephelometer |
| Fluoride | SPADNS |
| Nitrate | AgNO3 titration |
| Chloride | EDTA titration |
Table 2: Methods for determining physio-chemical parameters of ground water samples.
Results and Discussion
Statistical analysis of selected physical-chemical
parameters of ground water samples of Dungargarh are shown in Tables 3 and 4.
| S. N. | Sampling site | pH | EC (µS) | TDS (mg/l) | Salinity (mg/l) | Turbidity (NTU) | Chloride (mg/l) | Fluoride (mg/l) | Nitrate (mg/l) |
|---|---|---|---|---|---|---|---|---|---|
| S1 | Bana | 7.02 | 660 | 422 | 0.74 | 0.20 | 477 | Trace | 2.11 |
| S2 | Bhojas | 6.83 | 429 | 275 | 1.07 | 0.24 | 615 | 0.02 | 1.24 |
| S3 | Hemasar | 7.23 | 262 | 460 | 0.92 | 0.22 | 189 | Trace | 6.09 |
| S4 | Benisar | 6.70 | 862 | 550 | 0.84 | 0.24 | 112 | Trace | 0.9 |
| S5 | Momasar | 8.23 | 1940 | 440 | 1.24 | 0.19 | 587 | 0.13 | 2.09 |
| S6 | Soniasar | 8.19 | 2880 | 1430 | 1.44 | 0.17 | 1092 | 0.04 | 15.23 |
| S7 | Toliyasar | 6.70 | 845 | 400 | 0.44 | 0.20 | 678 | 0.21 | 5.79 |
| S8 | Riri | 7.12 | 1116 | 250 | 0.73 | 0.25 | 786 | 0.15 | 13.9 |
| S9 | Punrasar | 7.45 | 609 | 288 | 0.80 | 0.16 | 982 | 0.08 | 18.67 |
| S10 | Jetasar | 6.70 | 4100 | 1480 | 0.64 | 0.18 | 985 | Trace | 2.98 |
| S11 | Dholia | 6.77 | 2780 | 850 | 1.10 | 0.22 | 453 | Trace | 7.77 |
| S12 | Bigga | 7.80 | 287 | 710 | 0.71 | 0.28 | 762 | 0.02 | 9.3 |
| S13 | Dulchasar | 6.93 | 430 | 339 | 0.98 | 0.26 | 673 | 0.04 | 22 |
| S14 | Gusaisar | 7.90 | 1890 | 1200 | 1.32 | 0.18 | 566 | 0.05 | 21.67 |
| S15 | Salasar | 6.97 | 1590 | 900 | 1.19 | 0.20 | 912 | 0.08 | 9.97 |
| S16 | Satleran | 5.93 | 2630 | 2090 | 1.24 | 0.24 | 879 | Trace | 8.56 |
| S17 | Aadsar | 6.25 | 560 | 250 | 1.59 | 0.25 | 776 | 0.13 | 12.51 |
| S18 | Thukariasar | 6.63 | 953 | 870 | 0.48 | 0.19 | 457 | 0.06 | 16.71 |
| S19 | Dungargarh | 6.92 | 1040 | 950 | 0.72 | 0.29 | 836 | Trace | 18.6 |
| S20 | Gopalsar | 7.07 | 5560 | 2520 | 1.15 | 0.27 | 225 | 0.02 | 8.91 |
| pH | EC (µS) | TDS (mg/l) | Salinity (mg/l) | Turbidity (NTU) | Chloride (mg/l) | Fluoride (mg/l) | Nitrate (mg/l) | ||
| Mean | 7.067 | 1571.15 | 833.7 | 0.967 | 0.2215 | 652.1 | 0.0792 | 10.25 | |
| Maximum | 8.23 | 5560 | 2520 | 1.59 | 0.29 | 1092 | 0.21 | 22 | |
| Minimum | 5.93 | 262 | 250 | 0.44 | 0.16 | 112 | 0.02 | 0.9 | |
| Mode | 6.7 | NA | 250 | 1.24 | 0.2 | NA | 0.02 | NA | |
| Median | 6.95 | 996.5 | 630 | 0.95 | 0.22 | 675.5 | 0.06 | 9.105 | |
| Range | 5.93-8.23 | 262-5560 | 250-2520 | 0.44-1.59 | 0.16-0.29 | 112-1092 | 0.02-0.21 | 0.9-22 | |
| Standard Deviation (SD) | 0.60 | 1404.68 | 633.83 | 0.32 | 0.04 | 273.62 | 0.06 | 6.87 | |
| Coefficient of Variance (CV) | 0.08 | 0.89 | 0.76 | 0.33 | 0.17 | 0.42 | 0.75 | 0.67 | |
| Skewness | 0.47 | 1.55 | 1.42 | 0.17 | 0.16 | -0.45 | 0.98 | 0.28 | |
| Variance | 0.34 | 1874461 | 381648 | 0.10 | 0.00 | 71123 | 0.00 | 45 |
Table 3: Physical-chemical parameters of ground water samples of the study area.
Turbidity
Turbidity should ideally be kept below 1 NTU because of the recorded impacts of disinfection. This is achievable in large well-run municipal supplies, which should be able to achieve less than 0.5 NTU before disinfection and an average of 0.2 NTU or less, irrespective of source water type and quality. All ground water samples are in the average turbidity range i.e., 0.15 to 0.30 NTU.
pH
The pH value ranged from 5.9 to 8.2. The minimum pH was observed in Satleran (S16) and maximum pH was detected in Momasar (S5). According to the BIS standard [3], least and ideal pH value for human consumption is 7.0, but it may vary in between 6.5 to 8.5. The pH of all samples was within the standard limit. The entire tested samples were slightly alkaline. Thus, pH above 7.0 shows the alkaline nature of the water may be due to the excess of carbonate and bicarbonate ions.
Electrical Conductivity (EC)
The most desirable limit of EC in drinking water is prescribed as 1,500 μmhos/cm [4]. The EC of the groundwater is varying from 262 to 5560 μmhos/cm with an average value of 1571.5 μmhos/cm. The higher EC in the study area indicates the enrichment of salts in the groundwater. It depends upon temperature, concentrations, and types of ions present.
Groundwater can be classified based on EC into three classes i.e., type I, if the enrichments of salts are low (EC<
1,500 μmhos/cm); type II, if the enrichment of salts are medium (EC 1,500 and 3,000 μmhos/cm); and type III, if the enrichments of salts are high (EC > 3,000 μmhos/cm). 60 % groundwater samples of the study area fall under low enrichment of salts. 30% and 10 % samples come under medium and high enrichment of salts respectively which may be due to dissolution of salts in water. pH also play role in increasing the dissolution process that eventually increases the EC.
Total Dissolved Solids (TDS)
The desirable limit for TDS is 500 mg/l and maximum limit is 2000 mg/l prescribed for drinking purpose by BIS. The water with a high TDS value indicates that the water is highly mineralized. The concentration of TDS in the samples are observed in the range of 250 mg/l to 2520 mg/l. The samples of (S16) and (S20) are not suitable for drinking and irrigation purpose as the TDS is more than 2000 mg/l in these samples. According to the Davis and De Wiest [5] classification of groundwater based on TDS, 45% of the total groundwater samples are desirable for drinking (TDS < 500 mg/l), 30% samples are permissible for drinking (500–1000 mg/l) and 25% samples are suitable for irrigation purposes. High concentration of TDS in the groundwater sample is due to leaching of salts from soil.
Salinity
The major problem of groundwater salinity in Rajasthan is of terrestrial origin. The range of salinity in samples were from 0.44 to 1.59 mg/l.
Chloride (Cl)
The concentration of chloride varies between 112 to 1092 mg/l. The minimum value was observed in (S4) and maximum concentration in (S6), (S9), (S10), and (S15). The permissible limit for chloride is 250-1000 mg/l as per BIS standards. This indicates that the concentration of chloride in drinking water is within permissible limit except for (S6) where the chloride concentration is higher than the limit. High concentration of Cl produces hypertension, affect metabolism of the body and increase the electrical conductivity of water. The origin of chloride in groundwater may be from weathering, leaching of sedimentary rocks and soils, intrusion of saltwater and windblown salt in precipitation.
Fluoride
Fluoride is a chemical element that is found most frequently in groundwater and has become one of the most important environmental health hazards globally. The occurrence of fluoride in groundwater is due to weathering and leaching of fluoride-bearing minerals from rocks and sediments. Fluoride when ingested in small quantities (<0.5 mg/L) is beneficial in promoting dental health by reducing dental caries, whereas higher concentrations (>1.5 mg/L) may cause fluorosis. It is estimated that about 200 million people, from among 25 nations the world over, may suffer from fluorosis and the causes have been ascribed to fluoride contamination in groundwater including India. High fluoride occurrence in groundwaters is expected from sodium bicarbonate-type water, which is calcium deficient.
The limit set by BIS for fluoride is 1.0 to 1.5 mg/l. The
fluoride content in the water samples is ranged from 0.0 (trace) to 0.21 mg/l. The trace areas are S1, S3, S4, S10, S11, S16, S19 and maximum value is found in S7 (0.21). Therefore, all the water samples are suitable for drinking purpose.
Nitrate
The presence of high nitrate concentrations in water can cause a serious risk to human health as nitrate has been linked to stomach cancer, gastrointestinal cancers, hypertension, and methemoglobinemia in newborn infants. In an aquatic environment, high nitrate concentrations may lead to nutrient enrichment that affect the ecosystems and general deterioration of water quality. As a result of these health and environmental concerns, the World Health Organization (WHO) has recommended that the maximum nitrate concentration level in drinking water be 50 mg/l. The nitrate content in the samples ranged from 0.9 to 22 mg/l. The permissible limit of nitrate in water is 45 to 100 mg/l as per BIS standards. The minimum value was observed in S4 and maximum concentration in S13. All the water samples come under the limit of nitrates [4].
Table 4 is a correlation matrix of these parameters. Strong correlation was found between EC and TDS (0.85). Positive correlation can also be seen between nitrate and chloride (0.32), EC and salinity (0.24), salinity and TDS (0.22), chloride and fluoride (0.22), pH and nitrate (0.17), pH and salinity (0.16), pH and chloride (0.09), pH and fluoride (0.09), salinity and chloride (0.09), salinity and nitrate (0.06), nitrate and fluoride (0.06), turbidity and TDS (0.04), pH and EC (0.02), and, chloride and TDS (0.01).
| pH | EC | TDS | Salinity | Turbidity | Chloride | Fluoride | Nitrate | |
|---|---|---|---|---|---|---|---|---|
| pH | 1.00 | |||||||
| EC | 0.02 | 1.00 | ||||||
| TDS | -0.09 | 0.85 | 1.00 | |||||
| Salinity | 0.16 | 0.24 | 0.22 | 1.00 | ||||
| Turbidity | -0.32 | -0.12 | 0.04 | -0.04 | 1.00 | |||
| Chloride | 0.09 | 0.00 | 0.01 | 0.09 | -0.26 | 1.00 | ||
| Fluoride | 0.09 | -0.26 | -0.45 | -0.08 | -0.24 | 0.22 | 1.00 | |
| Nitrate | 0.17 | -0.17 | 0.00 | 0.06 | -0.02 | 0.32 | 0.06 | 1.00 |
Conclusion
The quality of the ground water of Dungargarh area is almost according to the norms of BIS and WHO standards. pH, chloride, fluoride, and nitrate properties of the ground water in the study area shows good quality but the primary treatment of ground water is must before being used for drinking [5]. The study suggests that regular evaluation of groundwater quality is needed in Dungargarh so that strategies can be developed to reduce the excess dissolved chemicals and ground water can be made more suitable for drinking purposes and for agricultural uses.
References
-
Census of India (2011).
-
APHA (2012) Standard Methods for the Examination of Water and Waste Water. 22nd Edition, American Public Health Association, American Water Works Association, Water Environment Federation.
-
BIS (2012) Drinking Water-Specification (ICS 13.060.20). 2nd (Edn.), Bureau of Indian Standard, New Delhi.
-
WHO (2011) Guidelines for Drinking Water Quality. 4th Edition World Health Organization, Geneva, Switzerland.
-
Davis, S. and DeWiest, R.M.1966. Characteristics and Genesis of the Groundwater Resources Associated with Oil Shale Deposits in the Azraq and Harrana Basins, Jordan. Hydrogeology Wiley: 463.
- Lessons to Learn: Trees are More than the Lungs of the World
- Community Forestry Enterprises as a Model for Sustainable Forest Development: The Case Of The "Baja Tarahumara" in Chihuahua, Mexico
- Ecological and Socio-Economic Impacts of Chromolaena odorata and Mesosphaerum suaveolens, Two Invasive Alien Species in Central and Southern Benin, West Africa
- Epigenetic Sustainability: Modeling the Human Factor as a Natural Resource through Science 4.0 and the NR3C1 Biological Pilot
- Growth-at-Risk: A Framework for Assessing Economic Vulnerability
- The Rural Territory as a Socioecological System for the Management of Public Policy for Sustainable Rural Development