Metric Variation on Neurocranium among Some Ancient and Contemporary Human Populations (Adult Males) of Indian Sub- Continent
Background: It is always difficult to assess the inter-group relationships by utilizing data based on sample univariate populations. One usually faces the problem of biological taxonomy in this case. To understand such problem multivariate statistical analysis is necessary. This study deals with neurocranium characteristics of four population groups from Indian Sub-Continent. Methods: Skulls of the four populations (Harappa, Kumhar Tekri, Contai, 24 parganas) were studied. Altogether 60 adult male skulls (Harappa=10, Kumhar Tekri=10, Contai=20, 24 Parganas=20) were measured. Four length and four breadth measurements were taken. Cranial index was calculated. From the data obtained, size and shape factors were calculated. D2P values were calculated and dendrogram was computed on the basis on D2P values. Results: Highest value of maximum cranial length, glabella inion length, nasion inion length, glabella lambda length and minimum frontal breadth were recorded in Harappa and its lowest values were recorded in Contai skull. While Harappa, Kumhar Tekri and 24 Parganas skull were mainly orthocranial, Contai skull was mainly hypsicranial. Mean values for size and shape distance between 6 pairs were 1.14 and 1.92 respectively. This implies that the four population groups show a tendency to differ more in shape distance than size distance. Dendrogram depicts that Contai and 24 Parganas populations form a cluster. But other two are distantly placed with this cluster. However, the Harappa maintains a far distance with other three population groups. Conclusion: Higher means of shape values than the size is recoded. This implies that the four population groups show a tendency to differ more in shape distance than size distance. Finding of this study is indicative of interesting corroboration between neurocranium characteristics and inter-group relationships.
Introduction
Form and shape of human as well as primate skulls are studied by various cut off measurements. A species can be determined by its smaller and larger shape of skull by the craniometric measurements. Skull is the upper most part of our skeleton containing of head and face. The lower part of the facial skeleton is constituted by a single loose bone, the mandible. The skeleton of a skull without mandible is called cranium. The brain box, i.e., the neurocranium, is also designated as calvarium; and the topmost part of the skull i.e., the skull cap is designated as calotte [1]. The neurocranium is the part of the skull that bounds the cranial cavity, which contains the brain, and is made up of the ethmoid, frontal, parietal, occipital, sphenoid, and temporal bones [2].
The neurocranium is the portion of the skull that houses and protects the brain. It consists of several bones, including the frontal, parietal, temporal, occipital, and sphenoid bones. The features of the neurocranium in ancient populations can provide insights into their anatomy, health, and lifestyle [3].
It is rather difficult to assess the inter-group relationships by utilizing data based on sample univariate populations. We face the problem of biological taxonomy in this case. To understand such problem multivariate statistical analysis is necessary. To classify the populations and to find out their relationship we have to see the morphological affinities and differences between and among groups.
Hollo, et al. [4] are of the opinion that linear measurements of the neurocranium are better indicators of population differences than those of the facial skeleton. They analyzed six neurocranial and seven facial measurements. The neurocranium showed significant differences in seven cases between non subsequent periods and in one case, between two subsequent populations. They found no significant result for the facial skeleton. According to them neurocranium is a more conservative region and that population differences can be pointed out better in the neurocranium than in the facial skeleton.
Anthropological Survey of India, Kolkata has had diverse skeletal remains in possession. The skeletal remains are of ancient as well as contemporary period. These are one of the important subject matters of the present bio-anthropological investigation. This study deals with the metric variation on neurocranium amongst human populations of Indian Sub- Continent.
Material and Methods
This work was done at the paleoanthropology laboratory of Anthropological Survey of India, Kolkata on dry skulls. Four length measurements (maximum cranial length, glabella inion length, nasion inion length and glabella lambda length) and four breadth measurements (maximum cranial breadth, maximum frontal breadth, minimum frontal breadth and bi- auricular breadth) on neurocranium were recorded among the adult males of the respective population groups. The craniometric measurements were recorded placing the skull on a craniophore. An index (cranial index) was calculated involving maximum cranial length and maximum cranial breadth. The measurements were taken with the help of sliding and spreading caliper following Mukherje, et al. [1].
Dry skulls of four populations were studied. These are: Harappa, Kumhar Tekri, Contai and 24 Parganas.
Harappa
The Harappa civilization arose towards the end of the 3rd millennium BC in the Indian Basin. The ancient city-site of the Harappa (30038’ N latitude and 72052’ E longitude) near present day Lahore in Pakistan was located next to the river Ravi – a tributary of the Indus. During 1928-1946 the Harappa skulls were discovered by the Archaeological Survey of India from Montgomery district, Sind, Punjab, Pakistan. Harappa skulls were belonged to Bronze Age. A time span of 2300 to 1750 BC for this culture was obtained from radiocarbon dating found from several Harappan sites in this region [5].
Kumhar Tekri
Kumhar Tekri or Potter’s Hill is situated at the outskirts of the city of Ujjain, Madhya Pradesh, India. Its cultural affiliation is Early Historic. In the year 1939 Archaeology Department of the former State of Gwalior, India discovered skeletal remains from this site. Dating of this specimen was 2nd to 3rd century BC [5].
Contai
A good number of Contai skull is preserved in Skeletal Repository of Anthropological Survey of India, Kolkata. Contai is a place located in Purba Medinipur district, West Bengal, India. It is to be noted that the Contai skulls are contemporary in nature, which were collected during 1960’s.
24 Parganas
Like Contai, 24 Parganas skulls are also contemporary in nature, which were collected from undivided 24 Parganas district of West Bengal during 1950’s and 1960’s.
Skulls of four studied populations were shown in Figure
Skulls of four studied populations were shown in Figure 1. Sample size of the present study was as follows: • Harappa - 10 adult skulls (male) • Kumhar Tekri - 10 adult skulls (male) • Contai - 20 adult skulls (male) • 24 Parganas - 20 adult skulls (male) The ‘size’ and ‘shape’ distances were calculated following the measure of Penrose [6, 7]. Common standard deviations for each character were used to estimate the distance. The
combined means are expressed in terms of pooled standard deviation unit. To see the intra- and inter-cluster average among the four groups the values of D2P were analyzed following the method of Rao [8].
![Figure 1: Sample size of the present study was as follows: • Harappa - 10 adult skulls (male) • Kumhar Tekri - 10 adult skulls (male) • Contai - 20 adult skulls (male) • 24 Parganas - 20 adult skulls (male) The ‘size’ and ‘shape’ distances were calculated following the measure of Penrose [6,7]. Common standard deviations for each character were used to estimate the distance. The](/fulltextimages/11516/fig_1.png)
Results
Means and standard deviation values of 9 neurocranium measurements (four length measurements, four breadth measurements and one index) among four groups of adult males were set out in Table 1. Highest value of maximum cranial length, glabella inion length, nasion inion length, glabella lambda length and minimum frontal breadth were recorded in Harappa and its lowest values were recorded in Contai skull. In case of other measurements, a different trend is noticed. In Table 2 means in terms of pooled standard deviation unit were furnished.
| Measurements | Harappa (n=10) | Kumhar Tekri (n=10) | Contai (n=20) | 24 Parganas (n=20) | |||||
|---|---|---|---|---|---|---|---|---|---|
| Mean | SD | Mean | SD | Mean | SD | Mean | SD | ||
| Maximum cranial length | 18.38 | 0.81 | 18.09 | 0.75 | 17.38 | 0.71 | 17.9 | 0.83 | |
| Glabella inion length | 18.23 | 0.63 | 17.39 | 0.075 | 17.06 | 0.61 | 17.46 | 1.03 | |
| Nasion inion length | 17.71 | 0.69 | 16.89 | 0.75 | 16.46 | 0.75 | 16.88 | 0.99 | |
| Glabella lambda length | 17.69 | 0.78 | 17.34 | 0.87 | 17.04 | 0.66 | 17.4 | 0.72 | |
| Maximum cranial breadth | 13.04 | 0.49 | 12.75 | 0.48 | 13.11 | 0.56 | 12.99 | 0.41 | |
| Maximum frontal breadth | 11.22 | 0.53 | 11.35 | 0.97 | 11.2 | 0.65 | 11.16 | 0.38 | |
| Minimum frontal breadth | 10.36 | 0.41 | 10.3 | 0.73 | 10.14 | 0.57 | 10.21 | 0.47 | |
| Bi-auricular breadth | 11.17 | 0.7 | 11.29 | 0.38 | 11.15 | 0.54 | 11.01 | 0.41 | |
| Cranial index | 71.01 | 2.57 | 70.59 | 3.96 | 75.57 | 4.33 | 72.66 | 3.37 | |
| Population group | Maximum cranial length | Glabella inion length | Nasion inion length | Glabella lambda length | Maximum cranial breadth | Maximum frontal breadth | Minimum frontal breadth | Bi- auricular breadth | Cranial index |
| Harappa | 23.87 | 22.79 | 21.34 | 24.23 | 26.61 | 18.1 | 18.84 | 21.9 | 42.94 |
| Kumhar Tekri | 23.49 | 21.74 | 20.35 | 23.75 | 26.02 | 18.31 | 18.73 | 22.14 | 43.41 |
| Contai | 22.57 | 21.32 | 19.38 | 23.34 | 26.76 | 18.06 | 18.44 | 21.86 | 42.87 |
| 24 Parganas | 23.25 | 21.82 | 20.34 | 23.84 | 26.51 | 18 | 18.56 | 21.59 | 42.33 |
| Pooled SD | 0.77 | 0.8 | 0.83 | 0.73 | 0.49 | 0.62 | 0.55 | 0.51 | 3.71 |
Table 1: Means and standard deviations of neurocranium measurements of adult males.
Size and shape distance values between any two groups were shown in Tables 3 and 4 respectively. This has been done for an overview on the size and shape factors used to find out the divergence among groups. Computed mean values for size and shape distance between 6 pairs were 1.14 and 1.92 respectively. This implies that the four population groups show a tendency to differ more in shape distance than size distance. Thus, here, the shape distance played a more important role than the size distance because of the morphological dissimilarity and differences.
| Population | Harappa | Kumhar Tekri | Contai | 24 Parganas |
|---|---|---|---|---|
| Harappa | - | 0.81 | 3.42 | 1.26 |
| Kumhar Tekri | - | - | 0.9 | 0.27 |
| Contai | - | - | - | 0.18 |
| 24 Parganas | - | - | - | - |
Table 3: Values of size distance (mC2Q) between any two groups.
| Population | Harappa | Kumhar Tekri | Contai | 24 Parganas |
|---|---|---|---|---|
| Harappa | - | 2.34 | 3.69 | 0.81 |
| Kumhar Tekri | - | - | 1.62 | 1.62 |
| Contai | - | - | - | 1.44 |
| 24 Parganas | - | - | - | - |
Table 4: Values of size distance (m-1) C2Z between any two groups.
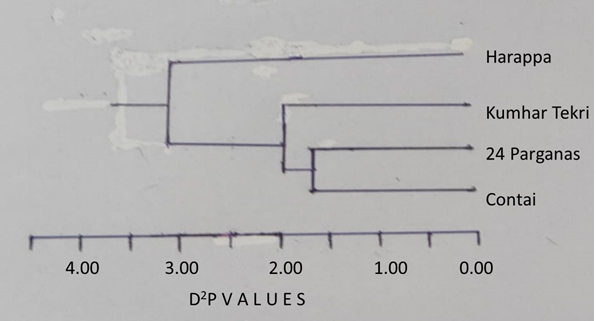
On the basis of size and shape factors D2P values were calculated among 4 population groups. This was done to see the position of intra and inter-cluster average among the groups. The D2P values were furnished in Table 5. Following the methodology of Mardia, et al. [9] a dendrogram was computed (Figure 2) on the basis of the data given in Table 5. It appears that there is one distinct cluster formed by the Contai and 24 Parganas population group. The Kumhar Tekri maintains a higher distance with this cluster but the Harappa was found to be maintaining far distance with this cluster.
| Population | Harappa | Kumhar Tekri | Contai | 24 Parganas |
|---|---|---|---|---|
| Harappa | - | 3.15 | 7.11 | 2.07 |
| Kumhar Tekri | - | - | 2.52 | 1.89 |
| Contai | - | - | - | 1.62 |
| 24 Parganas | - | - | - | - |
Table 2: Values of D2P (based on 9 characters) between any two groups.
Discussion
This study deals with length and breadth measurements of neurocranium characteristics of four population groups. Cranial index was calculated. While Harappa, Kumhar Tekri and 24 Parganas skull were mainly orthocranial, Contai skull was mainly hypsicranial. On the basis of eight measurements and one index, size and shape distance values were calculated between any two groups. This has been done for an overview on the size and shape factors used to find out the divergence among groups. Computed mean values for size and shape distance between 6 pairs were 1.14 and 1.92 respectively.
This implies that the four population groups show a tendency to differ more in shape distance than size distance. Thus, here, the shape distance played a more important role than the size distance because of the morphological dissimilarity and differences.
It is interesting to note that among these four population groups two are of ancient origin (the Harappa and Kumhar Tekri) and rest two (Contai, 24 Parganas) are of contemporary origin. It can be noted further that Harappa skulls are belonged to Bronze Age. A time span of 2300 to 1750 BC for this culture was obtained from radiocarbon dating. Whereas, origin of the Kumhar Tekri is less ancient than the Harappa. Its cultural affiliation is Early Historic. Dating of this specimen was 2nd to 3rd century BC.
To see the position of intra and inter-cluster average among 4 groups D2P values were calculated and Dendrogram was computed on the basis of D2P values. It appears from the analysis of dendrogram that there is one distinct cluster formed by the Contai and 24 Parganas population group. Though the Kumhar Tekri maintains a higher distance with this cluster but the Harappa was found to be maintaining far distance with this cluster. Thus, this study is indicative of interesting corroboration between neurocranium characteristics and inter-group relationships.
Conclusion
In the process of evolution ancient and contemporary skeleton show marked variation in different measurements. It is difficult to assess the inter-group relationships by utilizing data based on sample univariate populations. Problem of biological taxonomy generally appears in this case. To overcome such problem multivariate statistical analysis is useful. In this study neurocranium characteristics of four population groups from Indian Sub-Continent were dealt with the help of multivariate distance. As expected among four populations two contemporary populations form a cluster on the basis of D2P values, while other two ancient populations maintain distant relation with the contemporary population. As Harappa is more ancient than the Kumhar Tekri they maintain a far distant relation with Kumhar Tekri as well as other two contemporary populations.
References
-
Mukherji D, Mukherjee DP, Bharati P, Mukhopadhyay A (2018) Laboratory Manual for Biological Anthropology. Human Biology Review, Scholar, Kolkata 7(4): 342-343.
-
Meij BP (2014) Neurocranium. In: Langley-Hobbs SJ, et al. (Eds.), Feline Soft Tissue and General Surgery. Saunders Ltd.
-
Hollo G, Szathmary L, Maresik A, Barta Z (2010) Linear measurements of the Neurocranium are better Indicators of Population differences than those of the facial skeleton: Comparative study of 1961 Skulls. Human Biology 82(1): 29-46.
-
Sarkar BN Ancient Human Populations of the Indian Sub-Continent. Anthropological Survey of India, Kolkata (Unpublished).
-
Penrose LS (1947) Some notes on discrimination. Ann Eugen 13(4): 228-237.
-
Penrose LS (1954) Distance, size and shape. Ann Eugen 18(4): 337-343.
-
Rao CR (1952) Advanced Statistical Methods in Biometric Research. John Wiley, New York, USA.
-
Mardia KV, Kent JT, Bibby JM (1979) Multivariate Analysis. 1st(Edn.), Academia Press, London.
- Pattern of Breast Lesions in Ovu Inland, Delta State, South Southern Nigeria
- Morphometric Analysis of the Human Femur: Exploring Platymetric and Robusticity Indices Among the Nigerian Population
- Anatomical Variation of Arteria Lusoria: Clinical Implications for Dysphagia Lusoria and Surgical Risk
- Morphometric Study of the Vertebral Body and Pedicle of Typical Cervical Vertebrae Using Radiological Image
- Epigenetic Mechanisms Driving Human Evolutionary Changes
- Neuroprotective Effects of Ginkgo Biloba Extract on Bilateral Common Carotid Artery Ischaemic Stroke Induced in Wistar Rat