Response of Organic and Inorganic Fertilizers on Growth and Yield of Wheat at Kulumsa in Arsi Highlands of Ethiopia
A field experiment was conducted at Kulumsa Agricultural Research Center during 2014 to 2015 cropping season to evaluate the responses of bread wheat (Triticum aestivum) to integrated use of organic fertilizers (vermicompost and conventional compost) and/or inorganic NP fertilizers. The treatments consisted of recommended nitrogen and phosphorous rates from inorganic fertilizer, vermicompost, and conventional compost. They also consisted of combinations of two or three sources at a ratio of 50:50% and 33:33:33%. The experiment was laid out in randomized complete block design with three replications. Higher yield of bread wheat was obtained from the application of full dose of nitrogen and phosphorous from inorganic fertilizer sources. Application of organic fertilizers (vermicompost and compost) with inorganic fertilizers gave statistically similar yield and yield components to NP fertilizer alone in both years. Lower yield and yield components of bread wheat were achieved from application of organic fertilizer sources alone indicating gradual release of nutrient. In conclusion, organic fertilizers (vermicompost and conventional compost) alone cannot provide a viable substitute for inorganic fertilizer without causing a significant yield. Therefore, integrated use of organic and inorganic fertilizers was recommended for bread wheat production at Kulumsa in Arsi highlands and other similar agroecology.
Introduction
Wheat has been and continues to be one of the most important cereal crops in Ethiopia in terms of both area under cultivation and production [1]. The area under wheat cultivation was estimated at 1.67 million ha with an average production of 2543 kg ha-1 [2]. With the rapid increase in population and urbanization, the demand for wheat as a staple grain food is increasing. Though Ethiopia is among the largest wheat producer in sub- Saharan Africa, consumer demand far exceeds domestic production and wheat imports are costing the country millions of dollars in foreign exchange.
Depletion of soil fertility and poor crop management practices are among the major constraints responsible for the low productivity of wheat in Ethiopia [3]. The use of mineral fertilizers to avert soil fertility depletion in wheat production is still at suboptimal level [4]. Currently, 190,631 ton of organic and inorganic fertilizers have been used for the production of wheat in 2014 cropping season [2]. The mean fertilizer use for wheat of the country, 115 kg ha-1, was far below compared to the research recommendation of 250 kg ha-1 [5]. One of the major reasons behind the suboptimal use of inorganic fertilizers for grain crops is the costly price. Continuous production of crops against a backdrop of little fertilizer use over decades has aggravated the decline in soil fertility and crop yield [3, 6, 7].
The integration of organic fertilizers like vermicompost and conventional compost with inorganic sources may improve and sustain crop yields without degrading soil fertility status. Integration of organic and inorganic fertilizers improved the crop yield compared to fertilizers applied separately [7]. Integrated soil fertility management based crop production systems plays important roles in restoring soil fertility and availability of plant nutrients, enhancing crop growth and productivity [3, 8]. Therefore, the objective of this study was to determine the effect of integrated use of vermicompost, conventional compost and inorganic fertilizers on the yield and yield components of bread wheat.
Materials and Methods
Description of the Study Area
The experiment was conducted at Kulumsa Agricultural Research Center for two consecutive cropping seasons from 2014 to 2015. The dominant soil type of Kulumsa is vertic-luvisol [9]. It lies at 8.08°N latitude and 39.08°E longitude, at altitude of 2300m.a.s.l. It receives mean annual rainfall of 811 mm, which starts in June and continues to September. The mean minimum and maximum annual temperatures are10.5 and 24.5°C, respectively.
Preparation of Conventional Compost and Vermicompost
Wheat and maize crop residues, chopped green alfalfa leaves, animal manure, wood ash, forest soil and water were used for the preparation of conventional compost. Indigenous earth worms were used for the preparation of vermicompost. Mixtures of vegetables and food wastes, and bedding materials were used as feeding stocks for the vermi worms. The vermicasts were collected and used for the experiment. Prior to application, the total nitrogen and moisture contents of the conventional and vermicomposts were determined. The total amount of conventional compost used to maintain recommended amount of nitrogen for bread wheat at Kulumsa, 73 kg ha-
1, were, 11 and 12 t ha-1in 2014 and 2015, respectively. The corresponding values for vermicompost were 4 and 7 t ha-1, respectively (Table 1).
| Total nitrogen (%) | Moisture (%) | Fresh matter (t ha-1) | Dry matter (t ha-1) | |||||||||||||||||||||||
| Sample Type | ||||||||||||||||||||||||||
| 2014 | 2015 | 2014 | 2015 | 2014 | 2015 | 2014 | 2015 | |||||||||||||||||||
| Compost | 0.67 | 0.6 | 65 | 44 | 18 | 17.5 | 11 | 12 | ||||||||||||||||||
| Vermi compost | 1.79 | 1.05 | 29 | 66 | 5.3 | 11.5 | 4 | 7 |
Table 1: Total amount of conventional and vermicomposts used to maintain recommended amount of nitrogen for bread what at Kulumsa
Experimental Set-Up and Procedure
The experiment consisted of eight treatments of sole and various combinations of inorganic fertilizers (DAP and urea) and organic amendments (conventional and vermicomposts). Details of the treatments have been shown in Table 2. While N being the most limiting nutrient, applications were adjusted to a homogeneous N rate of 73 kg ha-1. The treatments were arranged in randomized complete block design with three replications.
| Treatment | Description of treatments | ||||
|---|---|---|---|---|---|
| 1 | No input | ||||
| 2 | Recommended nitrogen and phosphorous (RNP) from inorganic fertilizers (IF) (73-30 kg N-P ha-1) | ||||
| 3 | Recommended vermicompost (RVC) based on nitrogen equivalence (4 and 7 t ha-1 for 2014 and 2015, respectively) | ||||
| 4 | Recommended compost (RC) based on N equivalence (11 and 12 t ha-1 for 2014 and 2015, respectively) | ||||
| 5 | 50: 50% RVC: RNP from IF | ||||
| 6 | 50: 50%RC: RNP from IF | ||||
| 7 | 50:50% RVC:RC | ||||
| 8 | 33: 33: 33%RVC:RC: RNP from IF |
The seedbed was plowed and harrowed four times using tractor mounted mould board plough and disk harrow before planting. The gross plot size was 2.6 m by 4 m; and the spacings between blocks and plots were 1m and 0.5m, respectively. Bread wheat (cv_Kakaba_) was seeded by hand at a seed rate of 125 kg ha-1 during the first week of July each year. Conventional and vermi compost treatments were applied to plots two weeks ahead of planting. Phosphorus fertilizer was applied to respective plots as basal dose at planting from di- ammonium phosphate (DAP) while nitrogen fertilizer was applied in splits, half at planting and the remaining half at tillering from urea. Weeds were controlled using palas OD-45 supplemented with hand weeding.
Data Collection and Analysis
Number of spike were determined from each plot with a length of 0.5m and then converted to m2. Plant height was measured from ten plant samples per plot from the ground surface to tip of the spike excluding the owns. The length of spikes was determined from ten spike samples per plot; and number of seeds from ten spike samples per plot. Grain samples were collected from 2m by 3m net plot harvest and air dried at normal temperature of 18- 22oC. The dried samples were threshed manually and the grain and biomass weights determined. Analysis of variance was carried out for each of the measured parameters. All yield and yield component data were subjected to analysis of variance using PROC ANOVA of SAS version 9.0 statistical software [10]. The significance of differences among treatment means was compared using least significant difference (LSD test).
Results and Discussion
The analysis of variance for yield and yield components of bread wheat are indicated in Table 3. Application of organic and inorganic fertilizers significantly affected most of the bread wheat parameters measured except for spike length, hectoliter weight and thousand seed weight (Table 3). Significant variations were observed on yield and yield components of bread wheat due year effect indicating temporal variations across cropping seasons.
| Yield and yield component parameters | |||||||||||||||||||||||||||||
|---|---|---|---|---|---|---|---|---|---|---|---|---|---|---|---|---|---|---|---|---|---|---|---|---|---|---|---|---|---|
| No of | Thousand | ||||||||||||||||||||||||||||
| Sources of | Spike | Harvest | ( | Grain | ) | Biomass | Hectoliter | ||||||||||||||||||||||
| m | Spike | ) | Plant | ) | seeds / | seed | |||||||||||||||||||||||
| variation | length | index | Yield | yield | weight | ||||||||||||||||||||||||
| 2 (No | height (cm | spike | weight | ||||||||||||||||||||||||||
| (cm) | (%) | kg ha-1 | (kg ha-1) | (kg hl-1) | |||||||||||||||||||||||||
| (No) | (gm) | ||||||||||||||||||||||||||||
| Treatment (Trt) | *** | *** | Ns | *** | *** | * | *** | ns | ns | ||||||||||||||||||||
| Year (Y) | *** | *** | *** | *** | *** | *** | *** | * | *** | ||||||||||||||||||||
| Y*Trt | * | ** | Ns | ** | *** | ns | ** | ns | ns | ||||||||||||||||||||
| Mean | 354.67 | 87.02 | 6.76 | 43.77 | 41.51 | 4423.58 | 10758.3 | 75.57 | 35.3 | ||||||||||||||||||||
| CV (%) | 5.78 | 1.75 | 5.51 | 5.2 | 6.24 | 7.97 | 12.09 | 1.6 | 5.79 | ||||||||||||||||||||
| LSD (5%) | 24.17 | 1.8 | 0.44 | 2.68 | 3.06 | 415.9 | 1533.5 | 1.42 | 2.41 |
The application of organic and inorganic fertilizers significantly (P<0.05) increased the mean grain yield of bread wheat (Table 3). The highest grain yield of bread wheat (4695 kg ha-1) was recorded from the application of half dose of the recommended rate of nitrogen and phosphorous from vermicompost and the remaining half dose from inorganic fertilizer (DAP and urea) (Table 4). This treatment gave grain yield advantage of 504 kg ha-1 compared to application of the whole dose of recommended rate of N and P from vermicompost alone (4191 kg ha-1). Application of the recommended dose of N and P from inorganic fertilizers produced 4677 kg ha-1 of bread wheat (Table 4). Application of half dose of the recommended rate of N and P from conventional compost and the remaining half dose from inorganic fertilizer gave 4640 kg ha-1 of bread wheat (Table 4). Application of half- half of the recommended rate of N and P from conventional compost and inorganic fertilizers gave grain yield advantage of 440 kg ha-1 as compared to application of N and P from compost alone (Table 4). Therefore, application of N and P from vermicompost or conventional compost alone did not bring significant increase of mean grain yield of bread wheat (Table 4) indicating the slow release of nutrients from organic fertilizer sources.
Integrated use of organic and inorganic fertilizers showed highly significant (P<0.001) increase in the biomass yield of bread wheat (Table 4). The highest biomass yield of bread wheat (13430 kg ha-1) was obtained from the application of the recommended dose of N and P from inorganic fertilizers followed by application of half-half dose of the recommended rate of nitrogen N and P from vermicompost and inorganic fertilizers (12509 kg ha-1), which were statistically similar (Table 4). Application of recommended rate of N and P from inorganic fertilizer gave biomass yield advantages of 3561 and 3464 kg ha-1 as compared to application of no input and N and P from vermicompost alone.
Integrated application of organic and inorganic fertilizers showed highly significant (P<0.001) difference on number of spikes m-2, plant height and number of seeds spike-1 of bread wheat (Table 3). The highest number of spikes (387) and plant height (89.8 cm) were obtained from the application of half-half dose of the recommended rate of N and P from conventional compost and inorganic fertilizer (Table 4). Application of full dose of N and P from either vermicompost or conventional compost or in combination to each other resulted in inferior plant heights. The slow release and unavailability of important nutrients from organic sources might be attributed to the shortest plant height. Higher number of seed spike-1 of bread wheat was obtained from application of recommended rate of N and P from inorganic fertilizer, and 33: 33: 33 % RR VC: RR C: RR IF (Table 2 and Table 4). The lowest number of seeds spike-
1was obtained from the application of no nutrients applied at all.
| Yield and Yield Components Parameters | ||||||||||||||||||||
|---|---|---|---|---|---|---|---|---|---|---|---|---|---|---|---|---|---|---|---|---|
| Factor | P | lant heigh | t | Number of | Harvest | Grain yield | B | iomass yiel | d | |||||||||||
| Spike m-2 (No | ) | |||||||||||||||||||
| (cm) | seeds spike-1 | index (%) | (kg ha-1) | (kg ha-1) | ||||||||||||||||
| Year | ||||||||||||||||||||
| 2014 | 381a | 89.5a | 46a | 38.89b | 3680.8b | 9509.5b | ||||||||||||||
| 2015 | 328b | 84.5b | 42b | 44.14a | 5166.3a | 12007.1a | ||||||||||||||
| Integrated nutrient | ||||||||||||||||||||
| No input | 331cd | 85.4d | 41bc | 42.37ab | 4217.6c | 9869.6b | ||||||||||||||
| Recommended NP from inorganic fertilizers (DAP and Urea) (RR IF) | 382a | 88.5ab | 46a | 35.61c | 4677.4a | 13430.4a | ||||||||||||||
| Recommended vermicompost based on N equivalency (RR VC) | 324d | 85.8cd | 43abc | 41.98b | 4191.0c | 9966.2b | ||||||||||||||
| Recommended compost based on N equivalency (RR C) | 330cd | 86.1cd | 44ab | 43.36ab | 4200.2c | 9600.6b | ||||||||||||||
| 50: 50 % RR VC: RR IF | 363ab | 87.3bc | 45a | 38.22c | 4695.0a | 12508.9a | ||||||||||||||
| 50: 50 % RR C: RR IF | 387a | 89.8a | 45a | 42.15ab | 4640.1ab | 10944.0b | ||||||||||||||
| 50: 50 % RR VC: RR C | 351bc | 86.2cd | 41c | 43.22ab | 4241.0bc | 9817.8b | ||||||||||||||
| 33:33: 33 % RR VC: RR C: RR IF | 371ab | 87.3bc | 46a | 45.19a | 4526.2abc | 9928.8b |
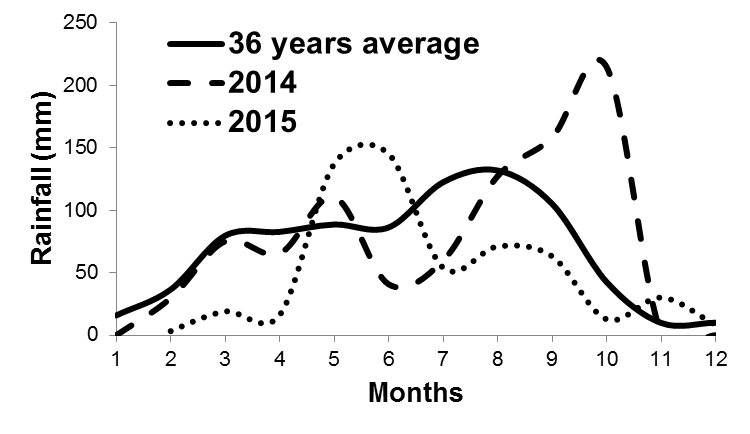
The mean grain and biomass yields of bread wheat in 2015 were statistically superior over 2014 cropping season (Table 4). This was mainly attributed to the rainfall condition, which was very high and low in 2014 and 2015, respectively (Figure 1). The very high rainfall condition in the cropping season (July to October) in 2014 might be resulted in excess moisture storage in the soil profile and affected the normal growth of bread wheat. Since the soil of Kulumsa is vertic-luvisol, the excess rainfall induced a sort of water logging problem; hence, resulted in underperformance of bread wheat roots and consequently reduced yield compared to 2015 copping season [9, 11]. Even though the rainfall condition in most of the main cropping season in 2015 was relatively lower than the long term average, the soil could conserve and efficiently utilize the available moisture; hence, it resulted in better yield.
Conclusion
Integrated application of organic and inorganic fertilizers significantly increased the yield and yield components of bread wheat. The highest yield and yield components of bread wheat was recorded from the application of full dose of N and P from inorganic fertilizers alone (73/30 kg N/ P ha-1); half dose of the recommended rate of N and P from vermicompost (3.5 t ha-1; in dry weight basis) and inorganic fertilizer (37/15 kg N/P ha-1); and half dose of the recommended rate of N and P from conventional compost (6 t ha-1; in dry weight basis) and inorganic fertilizers (37/15 kg N/P ha-1). Application of the whole dose of N and P from vermicompost alone or conventional compost alone or in combination to each other did not bring significant yield and yield components increase of bread wheat.
In order to maintain soil fertility, reduce cost of inorganic fertilizers and sustain bread wheat production, farmers of the study area and similar agro ecologies are advised to make integrated use of organic (vermicompost or conventional compost) and inorganic fertilizers. Application of half dose of the recommended rate of N and P from vermicompost/ conventional compost and the remaining half from inorganic fertilizers has been advised as the top priority management option even though other alternatives are still available.
References
-
Tesfaye T (1991) Improvement of indigenous durum wheat land races in Ethiopia. Plant Genetic Resources of Ethiopia.
-
CSA (2015) Agricultural sample survey 2014/2015. Volume III report on farm management practices. Addis Ababa, Ethiopia.
-
Gete Z, Getachew A, Dejene A, Shahidur R (2010) Fertilizer and soil fertility potential in Ethiopia: Constraints and opportunities for enhancing the system. IFPRI pp: 42.
-
Nyamangara J, Gotosa J, Mpofu SE (2001) Cattle manure effects on structural stability and water retention capacity of granitic sandy soil in Zimbabwe. Soil and Tillage Research 64(3-4): 157-162.
-
KARC (2014) Progress report of Land and Water Research Process of KARC for the year 2014. Kulumsa, Ethiopia.
-
Sanchez PA, Shepherd KD, Soule MJ, Place FM, Buresh RJ, et al. (1997) Soil fertility replenishment in Africa: an investment in natural resource capital. Replenishing soil fertility in Africa: Soil Science Society of America 51: 1-46.
-
Getachew A, Berhane L, Paul NN (2014) Cropping sequence and nitrogen fertilizer effects on the productivity and quality of malting barley and soil fertility in the Ethiopian highlands. Archives of Agronomy and Soil Science 60(9): 1261-1275.
-
Vanlauwe B, Bationo A, Chianu J, Giller KE, Merckx R, et al. (2010) Integrated soil fertility management operational definition and consequences for implementation and dissemination. Outlook Agriculture 39: 17-24.
-
Sahlemedhin S, Abayneh E, Demeke T (2003) Soils of Kulumsa Agricultural Research Center. National Soil Research Center.
-
SAS Institute (2004) SAS/STAT Software Version 9.2. SAS Institute, Cary, NC, USA.
-
FAO (2013) FAOSTAT. Food and Agriculture Organization of the United Nations. Rome, Italy.
- Enhancement of Vegetative Growth and Fruit Yield in Cucumber (Cucumis sativus L.) via Spiritual Blessing (Biofield) Energy Intervention
- Production of Açaí (Euterpe oleracea Mart.) under Different Agroforestry System Management Intensities in Amazonian Floodplain (Varzea) Forests
- Coffee and the Production Region: What is the Secret to the Expression "Quality"?
- Experiential Agripreneurship Training in Sub-Saharan Africa: Integrating a Business Incubator into Postgraduate Livestock Education at the University of Buea
- Advances in Agricultural High-Quality Development
- Linking Compost Residue to ABAGE in Plants - a Short Note