Evaluation of Management Practices in Layer Chickens and their Influence on Welfare Status in Kabete Sub-County, Kenya
Reduced land sizes, increased demand for food and employment creation are drivers for increased intensive poultry production in Kenya. Intensification of production is likely to compromise the welfare of birds raised for egg production (layers). There is therefore need to determine the welfare status of layers in smallholder farms in Kenya. This study was conducted in Kabete Sub-county of Kiambu County in Kenya, covering Muguga, Nyathuna and Kabete wards. Data was collected from 135 randomly selected farms comprising of 54, 55, and 26 from Muguga, Nyathuna and Kabete, respectively. One laying flock in each household was studied. A semi-structured questionnaire was used to collect data on feeding, housing, health and behaviour of layers. Measurements were taken to determine stocking densities, feeding, watering, perching and nesting spaces, house temperature and litter depth. Observations were made to assess house ammonia levels, litter quality and foot pad dermatitis. In each ward a focus group discussion with farmers was held. Focus group discussion was also held with extension agents. Hen-day egg production was the same (p>0.05) in the three wards, with a mean of 80±12%. Water and feed were provided throughout the day by 100 and 80% of the farmers, respectively. The mean feed consumption was 115.2±15.7 g/bird/day, which was the same (p>0.05) in the three wards. The mean feeding space was 10.4±3.0 cm/bird while the linear watering space was 2.5±0.7 cm/bird. Similar stocking densities (p > 0.05) of 10±3, 10±3 and 11±3 birds/m2 were found in Muguga, Nyathuna and Kabete, respectively. Similar poultry house temperatures (p>0.05) of 24.6±2.3, 24.4±2.2 and 22.9±2.9oC were recorded in Muguga, Nyathuna and Kabete, respectively. Ammonia level was not a problem in 64% of the houses studied. In 70% of the layer houses the litter moisture content was acceptable (dry). A small proportion of farmers (24%) provided perches for the layers. Similar perching space (p>0.05) of 7.1±5.8, 12±11, 12±8.7 cm/bird was recorded in Muguga, Nyathuna and Kabete, respectively. About 37% of the farmers reported occurrence of diseases such as New Castle, gumboro, fowl pox and fowl typhoid. All farmers provided laying nests, but none of them provided sand bathing facilities. For control of cannibalism, 63% of the farmers provided fresh green vegetables to the birds for pecking. In conclusion, welfare needs in terms of good feeding, house temperature, and litter quality were met. However the stocking density was high and there was minimum attemptto provide facilities for normal behaviour (perches and sand bathing boxes). The overall assessment was that the welfare of the birds was compromised because some of their requirements were not met.
Introduction
The types of poultry raised in Kenya include chickens, ducks, geese, turkeys, guinea fowls, quails and ostriches. According to Omiti JM, et al. there were 37.3 million birds, 84% of which were indigenous birds, while 8.4%, 5.7% and 1.8 were layers, broilers and other species, respectively [1]. Chicken is the most important estimated at 43.7 million birds [2]. The poultry is important in providing nutritionally rich food in the smallholder farms in Kenya and contributes 6.1, 2.3 and 0.7% to livestock GDP, agriculture GDP and national GDP [3]. It also provides employment for two to three million people [4]. Increase in human population, rising levels of income, and urbanization are factors that cause increased demand for poultry food products and consequently the desire for increased productivity of the layers. Therefore, small scale egg producers are using more intensive production systems such as the deep litter and the battery cages with high stocking densities. With such high stocking densities, the welfare of layers is compromised leading to stress and increased cases of feather pecking and fear among others [5].
Broilers are kept for meat production and are bred for fast growth to reach market weight at 42 to 45 days depending on sex and strain of the broiler [6]. As broilers grow older and bigger they take up more space, causing less space per bird. The health and welfare of broilers are The study was carried out in Kabete Sub-county of Kiambu County in Kenya covering Muguga, Nyathuna and Kabete wards (Figure 1). Kabete sub-county was created by the Independent Electoral and Boundaries Commission (IEBC) in 2012 by splitting Kikuyu constituency into Kabete and Kikuyu [13].
compromised at stocking densities above 34 - 38 kg per square metre [7].
An animal’s welfare is an indication of how it is fairing in a given situation [8]. Animal welfare is based on terms that were formulated by the Brambell Committee in 1965 [9]. An animal is in a good state of welfare if it experiences five freedoms namely: (i) Freedom from hunger and thirst, (ii) Freedom from discomfort, (iii) Freedom from pain, injury and disease, (iv) Freedom to express normal behavior and (v) Freedom from fear and distress [10]. Animal welfare is of importance to veterinarians, scientists as well as consumers. Nicol CJ, et al. reported that consumers were concerned about animal welfare and how animals for human food are raised [11]. The perception of consumers on animal welfare can affect the type and brand of poultry product to purchase [12]. There is therefore need to assess the welfare status of layers in smallholder production systems in Kenya.
Materials and Methods
Study Area
In 2009 Kenya National Bureau of Statistics (KNBS) reported that Kiambu County had 25.6% of the national commercial poultry flock [14]. Most of these birds were found in Kikuyu (6.4%) and Gatundu (5.9%). The choice of the study area was based on the poultry population.
Data Collection
Data was collected from primary sources, and methods employed were: A field Survey, covering 135 farmers, was carried out using semi-structured questionnaire to collect information on production characteristics of the farm. Measurement on floor area, nesting area, feeding, drinking and perching space, litter depth and house temperature were taken. To estimate litter moisture content, a handful of litter was squeezed and if it adhered tightly and made a ball, it was too wet but if it adhered slightly, it had the proper moisture content. When the litter did not adhere at all, it was deemed to be too dry [15]. Ammonia level in the layer houses was estimated based on irritation it caused to the eyes of enumerators as descried by North MO, et al. [16]. If there was no irritation to the eyes, it was less than 25 ppm; if there was slight irritation to the eyes, then it was 25-50 ppm; and if it was very uncomfortable to work in layer house, it was more than 50 ppm.
Data Analysis
Data obtained was entered into the Excel and coded. Descriptive statistics showing mean, standard deviation, frequency and percentages were computed using the Statistical Package for Social Sciences (SPSS), version 21.0. Duncan Multiple Range Test was used to compare means.
Results and Discussion
Production Characteristics of the Farm
The average flock size per household was 410 ±256 birds. About 50% of the farmers kept between 201- 400 layers. The age at point of lay was 18.5±1.6, 19.6±2.3 and 20.0±2.3 weeks in Muguga, Nyathuna and Kabete, respectively, which was expected [17]. Length of lay of hens at the time of data collection was 32±15, 26±14 and 20±12 weeks in Muguga, Nyathuna and Kabete, respectively, which was the same (p>0.05). Similar hen- day egg production (p>0.05) of 83.1±11.9, 79.0±11.5 and 77.0±9.5 (%) was recorded in Muguga, Nyathuna and Kabete, respectively. The overall egg production at 80.0±12% was lower than expected [18].
| Parameter | Muguga1 | Nyathuna1 | Kabete1 | Mean | ||||||||||
|---|---|---|---|---|---|---|---|---|---|---|---|---|---|---|
| Age at point of lay (weeks)1 | 19.4±1.9a | 19.5±1.8a | 20.0±2.3a | 19.6±2.0 | ||||||||||
| Number of weeks hens had been laying at time of data collection1 | 32±15a | 26±14a | 20±12a | 27.6±14.8 | ||||||||||
| Percent hen-day production 2 | 83.1±11.9a | 79.0±11.5a | 77.0±9.5a | 80.0±12 |
Table 1: Production characteristics of the laying flocks studied.
1 = Farmers in Muguga, Nyathuna and Kabete were 54, 55 and 26, respectively for the first two parameters. 2= Muguga (n=40), Nyathuna (n=44) and Kabete (n=19.). aMeans with similar superscript within a row are not significantly different (p>0.05). Table 1: Production characteristics of the laying flocks studied.
Feeding Above 80% of farmers in the three wards provided feed to chickens throughout the day while all the farmers provided water to the hens throughout the day.
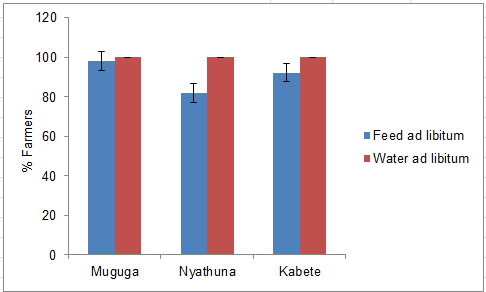
The daily feed intake between the wards was the same (p>0.05) at 115.2±15.7 g/bird/day. This was within the expected level of feed consumption [17, 19, 20]. The feeding space was 10.4±3.0 cm/bird while the watering space was 2.5±0.7 cm/bird both of which were within the expectation [17, 21]. Similar feeding and drinking spaces were noted between the three wards (p>0.05). Data on feed consumption, feeding space, and watering space show that the layer flocks studied were free from hunger and thirsty.
| Item | Muguga (n=54) | Nyathuna (n=55) | Kabete (n=26) | Mean/SD | ||||||||||
|---|---|---|---|---|---|---|---|---|---|---|---|---|---|---|
| Feed consumption (g/bird/day) | 114±18a | 116±14a | 118±12a | 115.2±15.7 | ||||||||||
| Feeding space (cm/bird) | 10.1±3.0a | 10.2±2.9a | 11.6±3.1a | 10.4±3.0 | ||||||||||
| Drinking space (cm/bird) | 2.3±0.4a | 2.6±0.8a | 2.4±0.6a | 2.5±0.7 |
Table 2: Feed consumption, feeding and watering spaces.
aMeans with similar superscript within a row are not significantly different (p>0.05). Table 2: Feed consumption, feeding and watering spaces.
Similar stocking density (p>0.05) of 10±3, 10±3 and 11±3 birds/m2 was found in Muguga, Nyathuna and Kabete, respectively (Table 3). However, the stocking density was higher than the recommended one of five to eight birds/m [17, 21]. High stocking density, above nine birds/m2, is undesirable as it affects egg production due to reduced feed intake and causes increased number of broken eggs
| Parameter | Muguga | Nyathuna | Kabete | Mean | ||||||||||
|---|---|---|---|---|---|---|---|---|---|---|---|---|---|---|
| Stocking density (birds/m2) | 10±3a | 10±3a | 11±3a | 10±3 | ||||||||||
| House temperature (0C.) | 24.6±2.3a | 24.4±2.2a | 22.9±2.9a | 24.2±2.5 |
Table 3: Stocking density of layers and house temperature.
aMeans with similar superscript within a row are not significantly different (p>0.05). Table 3: Stocking density of layers and house temperature.
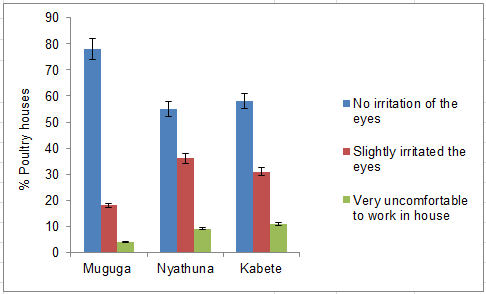
Ammonia problems in the house can arise due to overcrowding of the birds, water spillage, poor ventilation and inadequate amount of litter. Ammonia level was not a problem in 64% of the houses studied. However, in 28% of them ammonia level was high (slightly irritating to the eyes of enumerator). It was only in 7% of the houses that ammonia level was very high (Figure 3). Such levels of ammonia may lead to respiratory diseases and predispose birds to secondary infections, which may compromise their welfare [24].
In about 20% of the houses, the litter depth was 5 to 10 cm while in 67% of them it was 11 to 15 cm and in the rest of the houses (14%) it was more than 15 cm. The litter was dry in 70% of the houses, which is important as it decreases the chances of burnt hock problem and foot pad dermatitis, which positively influence the welfare of the birds [25]. Only 3.7% of birds in Muguga ward were found with foot pad dermatitis. This was expected since the management practices (feeding space, watering space, litter quality and litter depth) were within the acceptable norms.
| Parameters | Muguga * | Nyathuna * | Kabete * | Mean | ||||||||||
|---|---|---|---|---|---|---|---|---|---|---|---|---|---|---|
| Depth of litter (cm) | ||||||||||||||
| 10-May | 24 | 27.3 | 7.7 | 19.7 | ||||||||||
| 15-Nov | 50 | 61.8 | 88.5 | 66.8 | ||||||||||
| >15 | 26 | 10.9 | 3.8 | 13.6 | ||||||||||
| Quality of litter | ||||||||||||||
| Too dry | 22.2 | 7.3 | 7.7 | 12.4 | ||||||||||
| Dry | 72.2 | 76.4 | 88.5 | 79 | ||||||||||
| Too wet | 5.6 | 16.4 | 3.8 | 7.6 | ||||||||||
| Health of feet of birds | ||||||||||||||
| Healthy | 96.3 | 100 | 100 | 98.8 | ||||||||||
| Few wounds (2-3 wounds) | 3.7 | 0 | 0 | 1.2 |
Table 4: Proportion of farmers reporting various characteristics of the litter and health of birds’ feet (%).
*Respondents in Muguga, Nyathuna and Kabete were 54, 55 and 26, respectively for all parameters. Table 4: Proportion of farmers reporting various characteristics of the litter and health of birds’ feet (%).
Health
About 37% of the farmers reported occurrence of diseases while 38% of them reported bird mortality one month prior to this study. The proportion of farmers who reported New Castle disease, infectious bursal disease (Gumboro), cannibalism and coccidiosis as causes of mortalities were 33, 23, 16 and 1%, respectively. These were the same diseases that were reported to be important in the study area during focus group discussions. Improving biosecurity and health management practices on the farm can reduce transmission of diseases and mortality [26].
| Diseases and other conditions | ||||||||||||||
|---|---|---|---|---|---|---|---|---|---|---|---|---|---|---|
| Muguga (n=46) | Nyathuna(n=37) | Kabete(n=19) | Mean | |||||||||||
| reported and cause of mortality | ||||||||||||||
| Diseases | 42.6 | 34.5 | 34.6 | 37.2 | ||||||||||
| Moralities | 42.6 | 32.7 | 38.5 | 38 | ||||||||||
| Cannibalism | 33.3 | 25.5 | 23.1 | 27.3 | ||||||||||
| Causes of mortality | ||||||||||||||
| New Castle Disease | 27.8 | 36.4 | 35.5 | 33.2 | ||||||||||
| Gumboro | 22.2 | 23.6 | 23 | 23 | ||||||||||
| Cannibalism | 15.8 | 16.7 | 15.4 | 16 | ||||||||||
| Coccidiosis | 2.6 | 0 | 0 | 0.9 |
Table 5: Proportion of farmers reporting diseases, mortality, cannibalism and causes of mortality (%).
Few farmers in Muguga (14.8%), Nyathuna (23.6%) and Kabete (34.6%) provided perches. The same perching spaces (p>0.05) of 7.1±5.8, 12±11 and 12±8.7 cm per bird was provided in Muguga, Nyathuna and Kabete, respectively. Provision of perching space was below the recommended length of 15-25 cm/bird [27]. This shows that farmers may not have knowledge on the importance provided sand bathing facilities, which compromises the welfare of the birds. This could be due to lack knowledge on the importance of expressing natural behaviour on the welfare of laying hens. Dust bathing is important for chickens as it keeps their feathers clean, helps them stay free of mites and lice [29, 30]. About 63% of the farmers provided fresh green vegetables with the aim of controlling cannibalism and ensuring natural behaviour of pecking.
| Facilities | Muguga (n=54) | Nyathuna(n=55) | Kabete(n=26) | Mean | ||||||||||
|---|---|---|---|---|---|---|---|---|---|---|---|---|---|---|
| Provision of perches | 14.8 | 23.6 | 34.6 | 24 | ||||||||||
| Provision of laying nests | 100 | 100 | 100 | 100 | ||||||||||
| Dust bathing facilities | 0 | 0 | 0 | 0 | ||||||||||
| Green leaves for pecking | 63 | 52.7 | 73.1 | 63 | ||||||||||
| Perching space provided (cm/bird) | 7.1±5.8a | 12±11a | 12±8.7a | 10±9 | ||||||||||
| Area of laying nests (cm3 / every 5 birds) | 25±3a | 25±3a | 24±3a | 25±3 |
Table 6: Proportion of farmers providing facilities to improve welfare of the birds (%).
aMeans with no/similar superscript within a row are not significantly different (p>0.05). Table 6: Proportion of farmers providing facilities to improve welfare of the birds (%).
Conclusions
- Welfare needs for layers were met in terms of good feeding, suitable house temperature, good litter quality and depth and acceptable ammonia level.
- However, the stocking density (10 birds/m2) was higher than the recommended density of five to eight birds/m2. In addition, the perching space provided was 10 cm/bird, while the recommended length is 15-25 cm/bird. The total nesting space provided (25 cm3 per bird) was also below the recommended one of 30 cm3 for every 3-5 bird. Hence, welfare issues for layers were not met in regards to the latter parameters.
Acknowledgement
This study was funded by Intergovernmental Authority on Development (IGAD). The authors thank Kabete sub-county extension personnel who provided logistic support during the study and farmers who participated in the study.
References
-
Omiti JM, Okuthe SO (2008) An overview of the poultry sector and status of highly pathongenic avian influenza (HPAI) in Kenya. Background paper, IFPRI pp: 106.
-
FAOSTAT (2017) Data on Live animals, chicken.
-
Omiti J (2007) Overview of the Kenyan Poultry Sector & Its HPAI Status.
-
United States Agency for International Development (2010) Partnership for Safe Poultry in Kenya (Pspk) Program Regional Poultry Value Chain Analysis.
-
Alm M, Tauson R, Holm L, Wichman A, Kalliokoski O, et al. (2016) Welfare indicators in laying hens in relation to nest exclusion. Poulty Science 95(6): 1238- 1247.
-
Saleh EA, Watkins SE, Waldrou PW (1997) Changing time of feeding starter, grower and finisher diets for broilers 2. birds grown to 2.2 kg. Journal of Applied Poultry Research 6(1): 64-73.
-
Serpell JA (2008) On measuring progress in animal welfare. Assessment of Animal Welfare. 7. School of Veterinary Medicine, University of Pennsylvania.
-
Conklin T (2014) An animal welfare history lesson on the Five Freedoms.
-
OIE-the Office International des Epizooties (2018) Animal welfare at a glance.
-
Lake Research Partiners (2016) Labeling of meat, eggs, and dairy products and the treatment of animals raised for food. Washington DC.
-
Nicol CJ, Davies A (2013) Poultry welfare in developing countries. Poultry Development Review, Bristol.
-
Independent Electoral and Boundaries Commission (2012) Proposed Constituency & County Assembly Wards On the First Review Relating to the Delimitation of Boundaries of Constituencies and Wards 3.
-
Kenya National Bureau of Statistics (2009) Livestock population by type and district, Kenya.
-
Ritz CW, Fairchild BD, Lacy MP (2009) Litter quality and broiler performance. Cooperative Extension Service.
-
Aziz T, Barnes HJ (2010) Harmful effects of ammonia on birds.
-
North MO, Bell DD (1990) Commercial chicken production manual.
-
Hy-line-International (2016) Management Guide. Brown, Hy-line.
-
Jacobs J (2018) Feeding Chickens for Egg Production. University of Kentucky.
-
Thiele H, Pottgüter R, Gmbh LT (2008) Management Recommendations for Laying Hens in Deep Litter, Perchery and Free Range Systems. Lohmann Information 43(1): 53-63.
-
Food and Agriculture Organization (2011) Poultry housing. In: Geoffrey CM, Chepete HJ, Agullo JO (Ed.), Rural structures in the tropics. Design and development. Rome. pp: 269-284.
-
Kang HK, Park SB, Kim SH, Kim CH (2016) Effects of stock density on the laying performance, blood parameter, corticosterone, litter quality, gas emission and bone mineral density of laying hens in floor pens. Poultry Science 95(12): 2764-2770.
-
Talukder S, Islam T, Sarker S, Islam MM (2010) Effects of environment on layer performance. Journal of the Bangladesh Agricultural University 8(2): 253- 258.
-
David B, Mejdell C, Michel V, Lund V, Moe RO (2015) Air Quality in Alternative Housing Systems may have an Impact on Laying Hen Welfare. Part II-Ammonia. Animals 5(3): 886-896.
-
Meluzzi A, Fabbri C, Folegatti E, Sirri F (2008) Survey of chicken rearing conditions in Italy: effects of litter quality and stocking density on productivity, foot dermatitis and carcase injuries. British Poultry Science 49(3): 257-264.
-
Royal Society for the Prevention of Cruelty to Animals (2017) Can layer hen mortality, pests, parasites, disease and predation be managed in non-cage systems?.
-
Clauer PJ (2010) Small-Scale Poultry Production Management Requirements for Laying Flocks. Extension, Penn State.
-
ordon ordan ( ) Poultr diseases. ( nd d.) ondon aillier e indall.
-
Olsson IAS, Keeling LJ (2005) Why in earth? Dustbathing behaviour in jungle and domestic fowl reviewed from a Tinbergian and animal welfare perspective. Applied Animal Behaviour Science 93(3- 4): 259-282.
-
Fresh egg daily (2012) Bathing Beauties-Why Dust Baths are So Important for Chickens.
-
Clauer PJ (2009) Cannibalism: Prevention and Treatment. Virginia State University.
- Enhancement of Vegetative Growth and Fruit Yield in Cucumber (Cucumis sativus L.) via Spiritual Blessing (Biofield) Energy Intervention
- Production of Açaí (Euterpe oleracea Mart.) under Different Agroforestry System Management Intensities in Amazonian Floodplain (Varzea) Forests
- Coffee and the Production Region: What is the Secret to the Expression "Quality"?
- Experiential Agripreneurship Training in Sub-Saharan Africa: Integrating a Business Incubator into Postgraduate Livestock Education at the University of Buea
- Advances in Agricultural High-Quality Development
- Linking Compost Residue to ABAGE in Plants - a Short Note