Analysis of Tomato Market Diversity among Rural Smallholder Farmers in Kirinyaga County, Kenya
The present study was conducted to analyze tomato market diversity among rural smallholder farmers in Kirinyaga County, Kenya. Data was collected from rural smallholder farmers in Kirinyaga County, following a multi-stage sampling technique. Further the Simpson’s Diversity Index and Tobit regression model were applied for analysis. Results revealed that majority of the respondents sell the tomato produce in three channels. Higher prices were recorded for contract and wholesale markets while retail and direct markets reported the lowest produce prices. Tomato marketing experiences inefficiencies that lead to unprecedented inequalities. This is attributed to limited information on strategies to expand markets at farm level. Following the debate on market participation among farmers in sub-Saharan Africa, this study contributes to the existing literature through modelling proportional the available market channels and compute the magnitude of market expansion using Simpson’s Diversity Index. This articulates an opportunity to diversify further thus enabling farmers minimize risk of losses and explore existing markets.
Introduction
Vegetables contribute about 60% of the Kenyan agricultural exports [1]. This implies that a reduction in production and inefficient marketing of these crops would influence the performance of the economy negatively [2]. The crops form a vibrant enterprise with tomato being one such important vegetable mainly grown on small scale [3]. Globally, tomato ranks third in terms of production after potato and sweet potato [4]. In Sub Saharan Africa (SSA), Kenya is among top tomato producers with an average production of 410,033 tons annually [5]. Due to vertical and horizontal linkages, the tomato industry in Kenya underwrites about 7% of horticultural yield and 14% of vegetable output, respectively [6]. Improved efficacy in tomato marketing has potential to increase income of about 85% rural farmers who dominate the industry in small scale [7]. This is attainable since efficient marketing increases the producer’s share in the consumer price [8].
Tomato crop is regarded as a raw material for tomato processing industries and through value addition can be transformed into juice, paste, powder and soup [9]. Additionally, tomato is consumed across socioeconomic levels Baliyan SP, et al. [10] and intensive cultivation of the crop generates yields that sustain majority of rural households [11]. In Kenya, agriculture is dominated by smallholder farmers who produce 75% of total output and account for 70% of marketed output [7].
Marketing is a series of activities involved in moving a product from the initial point of production to the ultimate consumer [11]. In addition, it is characterized as a process of attracting potential consumers and favorably sustaining societal needs [12]. Further, marketing possesses an economic value which gives form, time and place utility to products [13]. Besides, agricultural marketing commences with a resolution to produce a commercial crop that will meet market demands and prospects [14]. Unlike other vegetables, tomato has a widespread demand and is extensively accepted in various forms [15]. The crop has an enormous potential to reduce poverty among smallholders who produce the crop either for exports or local markets [16].
Since tomato production is practical on small scale, its marketing remains essential among rural populations [17]. This denotes the importance of agricultural marketing in sustaining smallholder farmers and participants in the value chain [18]. Although tomato production has increased in various parts of the country, per capita supply has declined due to inadequate and inefficient marketing systems [19]. This can be improved by devising marketing approaches that offer potential for resourceful channels with better proceeds for farmers [20]. Efficient markets go beyond linking sellers and buyers to offering dynamic strategies that stimulate consumption of products which is essential for agricultural development [21]. In spite of this importance, efforts have been concentrated on production with little attention on marketing of high value vegetable crops like tomatoes [22]. This has resulted to market imperfections which affect product flow, hinder growth and expansion of the vegetable industry [17].
The production of fresh tomatoes is characterized by low shelf life and seasonality nature which leads to regular price fluctuations [23]. This hinders farmers from accessing emerging markets thus acquiring low and unfavorable prices [24]. Further, the distribution of tomatoes is poorly regulated, with rural markets controlled by intermediaries who charge high consumer prices but low producer prices [20]. Consequently, farmers do not fully benefit from the market system hence fail to make meaningful profit from tomato production and marketing [13]. This raises concerns about the efficiency of the tomato marketing system and its relation to farmers. Despite the substantial contribution of agriculture to economic development, the competitiveness of markets in rural areas is still low [25]. Similarly, smallholder tomato farmers continue to operate under poor market systems that are traditionally structured and inefficient in predicting trade linkages [26]. Besides, traditional markets are described by poorly developed information systems, high transaction costs and inadequate value adding activities [19]. This weakens the tomato value chain thus excluding smallholder farmers from accessing formal markets [27]. As a result, various market participants continue to exploit farmers by offering unreliable product prices at farm level [28]. This traps farmers within certain market constraints forcing them to continue operating in systems that offer unrewarding incomes [3].
The necessity to efficiently structure the tomato market is paramount since it promotes trade between rural and urban areas [29]. This in turn generates revenue and promotes economic development [7]. In addition, efficient marketing of tomatoes is crucial since the crop is highly perishable and significant in rural economies [29]. Besides, efficient marketing systems guarantee sustainable revenue to producers and marketers [30]. In developing countries, efficient marketing ensures enhanced incomes among rural populations [31]. To achieve sustainable development in agriculture, there is a need to establish a long term strategy through efficient and effective marketing systems. To attain this in tomato production, smallholders need to embrace market oriented production [32], since increased demand for tomatoes both locally and in regional markets is a substantive incentive for market production [1].
At farm level, avenues that have potential to promote market oriented production exist but available literature is deficient of addressing market diversity. In Kirinyaga County, this has resulted to poor linkage between producers and other market participants such as retailers, brokers and wholesalers. In addition, contract markets are limited thus impeding access to incentives and the possibility to maximize earnings among smallholder tomato farmers. This creates a need to reverse the trend by conducting studies that promote smallholder linkage to output markets through expansion of channels [21]. This implies that farmers need to choose approaches that strengthen product channels to mitigate effects of inefficiency [3].
Before a marketing system is said to be efficient its structure and conduct must be critically examined. The structure and performance of agricultural markets can be assessed to determine their efficiency in rural areas [33]. The rationale for efficient marketing is to bridge the gap between market and producer prices. Thus, it is important to understand market linkages that offer reasonable and stable product prices at farm level. However, this is not the case in Kirinyaga as a huge price discrepancy exists between markets and producers thus, depicting market inefficiencies. This paper narrows the knowledge gap on tomato marketing through an in depth analysis of market diversity. Besides, the study contributes to literature by analyzing the magnitude of diversity and examines levels of comparative advantage in markets.
**Methodologies**
**Study Area**
The study was conducted in Kirinyaga Central and Mwea west sub counties which are the major tomato producing areas in Kirinyaga County. The sub-counties are found in the mid land and low land agro-ecological zones, respectively. Additionally, the sub-counties lie between 1158 metres and 3400 metres above sea level [2]. The County is located along the slopes of Mt. Kenya with an area of 1478.1 kilometer squared of which 350.7 kilometer squared is under forest (Mt. Kenya) cover. The mountain area is in the highland agro-ecological zone with altitudes ranging from 3400 to 5380 metres above sea level [34].
Rainfall in the area is bimodal with long rains occurring from March to May and short rains occurring from October to December with quantities ranging from 1,212 to 2,146 mm [35]. Temperature ranges from a mean of 8.1o C in the upper zones to 30.3o C in the lower zones during the hot season. Agriculture is the main economic activity providing livelihood to about 87% of the population and accounting for 72% of household income. Additionally, total arable land in the County averages at 116,980 Ha which represent 79% of total area with only 50,864 Ha under food production [35]. Tomato is among the promising horticultural crops and mainly practiced in small scale with an average farm size of 1 Ha [36].
From the results, Rio Grande (27.1%) and Onyx (22.1%) were major open pollinated tomato varieties common among open field farmers. In addition, Anna F1 (19.8) and Ansal F1 (13.0%) were common hybrid varieties among greenhouse farmers. The varieties acclimatized with the climatic settings of Kirinyaga County but at farm level marketing, consumers of fresh products do not pay much attention to vegetable varieties.
**Sampling Design and Data Analysis**
The study applied a survey research design. A survey research provides efficiency in collecting large amounts of data with minimal cost and in a non-intrusive manner [7]. Multi stage sampling technique was used. First, purposive method was embraced in the selection of Kirinyaga Central and Mwea West sub-counties since these are the major tomato growing areas in Kirinyaga County. Proportionate to size method was then applied in determining the number of respondents from each of the following wards: Mutithi, Thiba, Kangai, Kandongu, Kerugoya and Kanyeki-ine. Systematic random sampling technique was used to select producers using the Cochran formula Lenné JM, et al. [37] which commonly considers the margin of error and the acceptable risks [38]. A total of 384 smallholder tomato farmers were selected for the study. Structured questionnaires were administered among respondents to solicit information on tomato prices, market channels and quantities sold.
From literature, diversity has been computed using various indices. These indices include the margalef index which has no value limits [39]. In addition, the margalef index compares components in a wide range of characters and shows variations depending with the number of characters [40]. However, this index considers only diversity components that show sensitivity to the sample size [41]. Unlike the margalef index, the fisher alpha index shows current and progressive distributions of a character and is less sensitive to the sample size. In addition, the fisher alpha index does not provide information regarding rare characters [40].
In most scenarios, indices used in analyzing expansion of market patterns are Shannon-wiener and Simpson’s indices. The Shannon-wiener index measures uniformity and abundance but like the fisher index it does not analyze the exceptional characters [42]. The Simpson’s Diversity Index (SDI) is used to quantify the magnitude of diversity using the shares of each character [43]. The SDI ranges from 0 to 1 and the level of diversity gradually increases as the index approaches 1. Further, the index considers rare markets, measures uniformity and abundance [39]. Based on these strengths, SDI was applied in computing the degree of market diversity among smallholder tomato farmers in Kirinyaga County. Two indicators namely number of marketing channels and the quantities sold in each outlet were considered while determining the diversity index of the respondents. The SDI was expressed as:
$$SDI = 1 - \frac{\sum_{n=1}^{m} n(n-1)}{N(N-1)} \tag{1}$$
Where; SDI is the Simpson’s Diversity Index, m is the number of market channels used by individual farmers, n is the quantity of tomato output sold in each market outlet by the $1^{th}$ farmer and N is the total tomato quantity sold in all markets channels by the $1^{th}$ farmer. The censored Tobit regression model was used to determine socio-economic characteristics that influence market diversity. The model was found appropriate since it is a limited dependent variable model and that diversity has lower and upper boundaries at zero (0) and one, respectively [44]. The selected factors were regressed against market diversity scores using the Tobit model which is empirically expressed as shown;
$$Y_i = \alpha_0 + \sum_{j=1}^{n} \alpha_j X_{ij} + e_i$$
Where, $Y_i$ represents scores of the $i^{th}$ smallholder tomato farmer, $\alpha_i$ is a constant, $\alpha_j$ are the parameters to be estimated, $e_i$ is an error term that is independently and normally distributed with mean zero and common variance of $\delta^2$, $X_{ij}$ are variables representing the socioeconomic factors. Censoring for the Tobit model on the left was done at 0 (zero) and at 1 (one) on the right [37].
A one-way Analysis of Variance (ANOVA) was applied to test whether farm prices differed significantly between marketing channels and whether differences in diversity scores significantly influenced fresh tomato prices. The ANOVA procedure examines and identifies sources of variation in a given data. One factor ANOVA is the procedure when applied to data that is classified into one criterion, for instance data classified into levels of diversity or market channels.
The ANOVA recognizes three sources of variation; first, is the total variation due to differences within the sample and which is referred to as total sum of squares (TSS). The second variation results from differences between categories or groups and is denoted as treatment sum of squares (SST). The third is the variation due to error and is denoted as error sum of squares (SSE). Total variation is the sum of treatment sum of squares and the error sum of squares [45]. The SST and SSE computed for the one-way ANOVA are used to form mean squares for the treatment and error, respectively [46]. These mean squares are denoted by MST (mean sum of treatment) and MSE (mean sum of error), respectively;
$$MST = \frac{SST}{K-1}$$
$$MSE = \frac{SSE}{n-k}$$
Where: $n$ is the number of observations and $k$ is the number of categories. The test statistic for ANOVA is the F-ratio Mutayoba V, et al. [46] and is computed as:
$$F - ratio = \frac{MST}{MSE}$$
Results and Discussion
Socio-Economic Characteristics of Respondents
Table 1 displays the results of socio-economic characteristics of smallholder tomato farmers. The results indicate that 62.0% of the respondents were in the category of 20 to 39 years, 35.9% within the age bracket of 40 to 59 years while only 2.1% attained 60 to 79 years. A possible explanation from this result is that tomato marketing in the study area was largely dominated by young people. This explains the growing interest in agricultural activities among the youth possibly due to high returns and increased problems of unemployment. These results coincided with Ibitoye SJ, et al. [27], but negated the findings of Matsane SH, et al. [40] who found that agricultural marketing in South Africa was dominated by the aging population. Further, the results revealed that 75.8 % of the respondents were males while only 24.2% were females. This implies that vegetable production and marketing was more preferred by male respondents possibly due to relatively higher returns compared to other crops and that men mostly assume the responsibility of ensuring household food security. This result was in line with Nguetti PR, et al. [48], but differed with Ceschi S, et al. [49] who found that female farmers dominated outlet markets in Italy.
The results Table 1 further showed that majority (76.3%) of the respondents were married thus provided family labor. This was in agreement with Sudarevic T, et al. [31] who argued that a large proportion of married smallholders help provide family labor. The results also show that only 19% and 20% of respondents had achieved secondary and tertiary education level, respectively, with majority (57%) attaining primary education. Additionally, 4% of the respondents had no formal education. A possible explanation is that literacy levels were relatively high, thus enabling farmers increase their returns through use of emerging innovations in tomato marketing.
The result coincided with Chepng’etich E, et al. [44] who explained that education enhances the skills of producers thus making literate farmers more receptive to innovations than uneducated farmers. From the results, majority (70%) of the smallholder farmers had between 1 and 10 years of experience. This implies that most of the respondents were new in tomato marketing thus had limited knowledge on existing market trends hence, affecting the choice of market expansion. Further, 20.8% of the farmers had experience ranging between 11 and 20 years with only 9.2% having experience of more than 20 years in tomato marketing. A reasonable justification is that a sizeable proportion of the respondents had a better understanding of tomato marketing which is key in achieving better returns as explained by Baliyan SP, et al. [50].
Maximum land under tomato cultivation was 2ha with majority (53.4%) of the farmers having apportioned less than 0.5ha for tomato production. Similar findings were reported by Gebrehiwot NT, et al. [51]. This confirms that respondents were smallholder farmers a result that agreed with Najjuma E, et al. [52]. Results further revealed that 74% of the respondents received farm income below KES 100,000.
per season. This shows that more than half of the farmers had low returns from tomato sales. This was attributed to poor producer prices, inefficient marketing systems, lack of reliable markets and support [16]. Majority (62.2%) of the households had about 5 members with 37.8% having more than 5 members. This indicates that family labour was adequately available for farm operations. This is explicated by that large households provide labour for allocation to farm activities hence, reduced production cost and better returns. This result agreed with the findings of Aliyu A, et al. [53] and Mukhtar U, et al. [36].
| Variable Description | Frequency | Percentage (%) | ||
|---|---|---|---|---|
| Age | 20-39 | 238 | 62 | |
| Age | 40-59 | 138 | 35.9 | |
| Age | 60-79 | 8 | 2.1 | |
| Gender | Male | 291 | 75.8 | |
| Gender | Female | 93 | 24.2 | |
| Marital status | Married | 293 | 76.3 | |
| Marital status | Single | 51 | 13.3 | |
| Marital status | Divorced | 23 | 6 | |
| Marital status | Widowed | 17 | 4.5 | |
| Education level | 15 | 3.9 | ||
| Education level | Primary | 219 | 57 | |
| Education level | Secondary | 73 | 19 | |
| Education level | Tertiary | 77 | 20 | |
| Experience in tomato marketing (Years) | 1 to 10 | 269 | 70 | |
| Experience in tomato marketing (Years) | 11 to 20 | 80 | 20.8 | |
| Experience in tomato marketing (Years) | Above 20 | 35 | 9.2 | |
| Land size (Ha) | ≤ 0.5 | 205 | 53.4 | |
| Land size (Ha) | 0.5> to ≤0.75 | 42 | 10.9 | |
| Land size (Ha) | > 0.75 | 137 | 35.7 | |
| Farm income (KES) | ≤100,000 | 284 | 74 | |
| Farm income (KES) | >100,000 | 100 | 26 | |
| Household size (Number) | 1 to 5 | 239 | 62.2 | |
| Household size (Number) | 6 to 10 | 145 | 37.8 |
Table 1: Socioeconomic Characteristics of Smallholder Tomato Farmers.
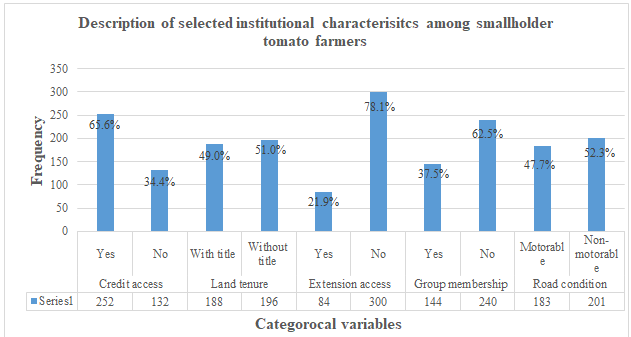
Figure 1 further shows that 65.6% of the respondents had access to financial credit. This implies that farmers were financially empowered to timely procure inputs and technologies necessary in tomato production. In addition, 51.0% of the smallholder farmers did not have guaranteed security for land ownership thus relied on leased land. This could have led to inadequate credit access to a sizeable proportion (34.4%) of smallholders since land may be used as collateral. In addition, this reduced interest of farmers to understand information about available lenders, types of credits offered and interest rates charged by borrowers. Baliyan SP, et al. [50] reasoned that responsiveness to available loan products among smallholder farmers is constrained by lack of adequate knowledge. Further, Aliyu A, et al. [53] noted that since agricultural enterprises are risky, commercial banks are usually reluctant to provide financial support for their operations.
Results in Figure 1 also show that 78.1% of the respondents had no contact with extension agents. This suggests that most farmers in the study area would be expected to increase agricultural production and productivity due to the knowledge and information received from experts which may define the balance between market success and failure [6]. Abate TM, et al. [54] argued that inadequate knowledge in agricultural practices among rural farmers is attributed to weak extension services thus leading to unproductive and inefficient marketing strategies. Results also revealed that 62.5% of the smallholder farmers were not members of organized groups. This means that smallholders lacked adequate bargaining power due to weak synergies hence not competitive in output market as explained by Mango N, et al. [15] and Abel OB, et al. [19].
Additionally, farmers operated in rural areas where 52.3% of the maintained road infrastructure was non-motorable. This led to reduced returns from tomato sales owing to increased transportation costs and spoilage of fresh tomatoes due to delayed delivery given their perishable nature. This result concurred with the findings of Abdelrazig HE, et al. [24].
Descriptive Analyses of Market Diversity
From the survey, fresh tomatoes were marketed mainly through six channels namely; sale to local assemblers, sale to retailers, sale to wholesalers, sale to middlemen and sale to contract markets. In addition, direct market channels, which is sale from the farmer to the ultimate consumer, existed but were more often obtruded by lack of affordable labour and capital in the smallholder farms. Further, Onianwa OO, et al. [55] explains that direct marketing can be limited by lack of incentives to smallholder farmers. McLaughlin JE et al. [43] reported that number of channels, number of participants, volume handled and price are important parameters considered while computing diversity of agricultural markets. Agricultural diversity enables farmers preserve their initial capital and explore various markets while generating returns [12].
The articulation of diversity by number of channels that farmers use to market their products demands that more channels express high diversity and few channels show low diversity [30]. Table 2 shows the distribution of smallholder farmers and the number of channels used in marketing fresh tomatoes in the study area.
| Number of channels | Number of farmers | Percentage | Cumulative percentage | |
|---|---|---|---|---|
| 1 | 16 | 4.2 | 4.2 | |
| 2 | 145 | 37.8 | 42 | |
| 3 | 160 | 41.7 | 83.7 | |
| 4 | 50 | 13 | 96.7 | |
| 5 | 2 | 0.5 | 97.2 | |
| 6 | 11 | 2.8 | 100 | |
| Total | 384 | 100 |
Table 2: Distribution of Smallholders and Channels used in Tomato Marketing.
From the results Table 2, most (41.7%) of the farmers used 3 marketing channels, with 83.7% of the sampled farmers using utmost three channels. In addition, 37.8% sold tomatoes in two channels while 13.0% of the respondents were connected to 4 channels. Further, only 0.5% of the respondents marketed tomatoes through five channels while 2.8% had an affiliation with other rare market channels in the study area. This indicates that the farmers had managed to highly expand their fresh tomato markets. However, 4.2% of the smallholder farmers managed to market fresh tomatoes in only one market outlet implying lack of market diversity, thus high risk of losses that result from the perishable nature of fresh tomatoes as explained by Baliyan SP, et al. [50].
The expression of market expansion in regard to number of participants in specific channels and mean prices has been illustrated in Table 3. Generally, farmer to contract markets and farmer to wholesale channels recorded the highest prices followed by broker outlet and local assemblers. The retailer channel and engagements in direct marketing recorded the lowest prices (Table 3). The lowest price achieved by the farmers per kilogram of fresh tomatoes during the study period was KES 15 while KES 75 was the highest.
| Marketing Channel | Frequency of Participants | Mean Price | Std.Dev | Min | Max | F-Test |
|---|---|---|---|---|---|---|
| Farmer→Local assemblers | 316 | 34.17 | 4.456 | 25 | 50 | 6.173*** |
| Farmer→Wholesalers | 97 | 38.07 | 4.552 | 30 | 50 | |
| Farmer→Contract markets | 51 | 44.4 | 2.792 | 40 | 50 | |
| Farmer→ Retailers | 233 | 33.45 | 5.618 | 15 | 65 | |
| Farmer→Brokers | 335 | 37.38 | 4.628 | 25 | 75 | |
| Farmer→Consumers | 40 | 30.45 | 5.852 | 15 | 45 |
Table 3: Average Price for a Kilogram of Tomatoes per Market Outlet.
Results in Table 3 denote that the average prices achieved in different channels differed significantly at 1 percent level of probability. Contract markets attracted a high average price compared to other markets but it had fewer farmers selling in this channel. This was attributed to inadequacy of information regarding contract markets and benefits attached. Local assemblers had a potential to attract more farmers despite having a low average price possibly due to reduced transaction costs. Higher prices reported by farmer broker channel were not attractive to producers most likely because participants failed to establish mutual trust in trade. Baliyan SP, et al. [50] ascribed this to brokers’ intention to exploit farmers owing to their price taking attribute.
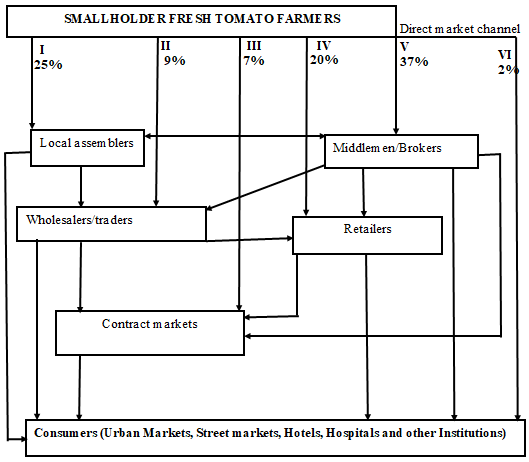
Figure 2 shows the flow of fresh tomatoes through various channels from farm to intermediaries, marketing agents and to the ultimate consumers. From the diagram, majority (37%) of the farm produce was sold through middlemen or brokers who transact between farmers and potential customers. Though trade is executed at farm level, farmers are deprived off their benefits since there is little or no transparency [50]. Some farmers sold their produce to local assemblers which account for 25% of the total marketed produce. Local assemblers sell the fresh tomatoes to rural markets with farmers incurring less costs since the produce is collected at the farm gate. This channel is more preferred by farmers since it has repeated transactions, reliable and stable prices [47].
There are retailers who are small scale traders selling fresh tomato produce in open air markets, stalls and to urban retailers. This channel accounts for 20% of the marketable produce and buyers are always available since it incorporates door to door hawking strategies [17]. The wholesale channel is characterized by existence of brokers and product exchange at rural markets. The channel collected 9% of the fresh tomatoes but was constrained by market unreliability. This was due to overreliance on traders for market information thus discerning farmers in price setting [12].
Contract markets existed in the study area but were least preferred among smallholder fresh tomato farmers. Kanburi BJ, et al. [56] explains that contract marketing is an agreement between farmers and marketing firms for the production and supply of agricultural products normally at predetermined prices. The agreement also involves the purchaser providing a degree of production support through supply of inputs and provision of technical advice [20]. The low preference in the study area was rather attributed to information asymmetry among participants due to limited availability of extension and training which plays a crucial role of educating farmers as described by Osebeyo SO, et al. [57]. In addition, the results also suggest that since contract markets handle small quantities, farmers were discontented with contract marketing due to the extra contractual obligations of quantity and quality of tomatoes as determined by buyers. In Kirinyaga County, fresh tomato contract markets are mainly offered by learning institutions, hospitals, supermarkets and hotels but the channel absorbed only 7% of the total produce. Therefore, majority of the farmers would not benefit from the advantage of guaranteed prices as shown by the ANOVA output (Table 3) that depicts a significant difference in prices across different market channels.
Farmers’ direct marketing of fresh tomatoes was widely neglected despite being a certain niche that plays a distinctive role for establishing high quality markets among agribusiness enterprises [55]. This approach entails farmers working as producers as well as retailers and has a growing importance in providing farmers with greater net returns [57]. However, only 2% of the total produce was marketed through this channel. This could be accredited to farmers having difficulties to define their place in competition, analyze their own strengths and weaknesses thus unable to realistically meet customer satisfactions.
To take into account the proportion of output sold through chosen market channels, SDI was computed. The SDI was preferred due to its strength in considering rare markets, large quantities and measuring consistency [42]. In addition, SDI considers quantities sold in each outlet while computing diversity [39]. The index ranges from 0 to 1 with diversity increasing as the index approaches 1. Diversity scores presented in Table 4 show that SDI ranged from 0 to 0.77. The wide range in diversity implies that smallholder tomato farmers were not reasonably distributed across all available marketing channels. This implies that farmers lacked adequate information on rare market channels and that some were exploitative in price determination. The result agreed with Faysse N, et al. [12] but negated the results of Abate T, et al. [54] who argued that diversity was not a prerequisite to sell in different channels.
| Level of SDI | Frequency | Percentage | Cum. Percentage | |
|---|---|---|---|---|
| Low | 0 to <0.25 | 44 | 11.5 | 11.5 |
| Moderately low | 0.25 to < 0.50 | 160 | 41.7 | 53.1 |
| Moderately high | 0.50 to < 0.75 | 179 | 46.7 | 99.7 |
| High | 0.75 to 1.00 | 1 | 0.3 | 100 |
| SDI | Mean = 0.4771 | Min = 0 | ||
| SDI | Std. Dev = 0.1825 | Max = 0.77 |
Table 4: Descriptive analysis of Simpson’s Diversity scores.
The mean diversity index was 0.4771. This shows that there is an opportunity to improve diversity among respondents by more than 50% if constraints that hinder farmers from exploring existing markets are minimized. However, the diversity index was lower compared to 0.54 that was reported by Bellon MR, et al. [58] among smallholder farmers in marginal areas of Ghana and 0.83 obtained by Sen B, et al. [59] in Bihar district of India. The results further elucidate that chances exists for the fresh tomato farmers to minimize the risks of losses through expansion of product markets as explained by Le [60]. This was comparable to results of Kissoly L, et al. [61]. More than half (53.1%) of the sampled farmers had diversity scores below 50%. This specifies that there is a chance to increase market diversity among majority smallholders by more than 50% if quantities sold in each market outlet are improved. The result was in line with Tura EG, et al. [62] who mentioned that farmers’ bargaining power would be improved through collective marketing which is achievable through market expansion. The results also agreed with Biggeri M, et al. [63] who found that diversity promotes strategies that increase access to high value markets.
Socio-Economic Factors Affecting Market Diversity
The evaluation of socio-economic factors affecting market diversity was conducted by application of censored Tobit regression model (Table 5) where socio-economic characteristics (independent variables) were regressed against market diversity (Dependent variable).
| Variable | Coefficient | Std. error | t | P>/t/ |
|---|---|---|---|---|
| Age (Years) | -0.01545 | 0.00937 | -1.7 | 0.122 |
| Gender (0=Female,1=Male) | -0.18495 | 0.10868 | -1.7 | 0.111 |
| Household size (Number) | -0.07155 | 0.03115 | -2.3 | 0.038** |
| Education (Years) | 0.00451 | 0.01109 | 0.41 | 0.69 |
| Road (1=Mortable,0=Otherwise) | 1.1783 | 0.32627 | 3.61 | 0.003*** |
| Farm income (KES) | 5.90E-06 | 1.85E-06 | 3.2 | 0.006*** |
| Off farm income (KES) | -0.000038 | 9.70E-06 | -3.9 | 0.002*** |
| Extension (Contacts) | 0.27269 | 0.09212 | -3 | 0.010*** |
| Experience (Years) | 0.23242 | 0.0684 | 3.4 | 0.004*** |
| Group membership (0=No, 1=Yes) | 0.42485 | 0.13649 | -3.1 | 0.008*** |
| Credit amount (KES) | 2.02E-06 | 5.79E-07 | 3.49 | 0.004*** |
| Distance to local markets (KMs) | -0.03597 | 0.01726 | -2.1 | 0.056* |
| Land size (Ha) | 0.14749 | 0.09083 | 1.62 | 0.127 |
| Tomato quality (0=Low,1=High) | -0.00032 | 0.03466 | -0 | 0.993 |
| Constant | 0.94583 | 0.49699 | -1.9 | 0.078 * |
| Log likelihood = 14.840655 , Likelihood ratio (LR) = 23.04 |
Table 5: Tobit Regression Results on Factors Influencing Market Diversity.
Asterisks *, , * show significance at 1%, 5% and 10% respectively. Table 5: Tobit Regression Results on Factors Influencing Market Diversity.
Interestingly, size of household was found to be negative and significant at 5% in explaining market diversity. This implies that as household size increased, market diversity decreased. This result concurred with the finding of Chepng’etich E, et al. [44] and Aliyu A, et al. [53] who argued that though households provide family labour for farm operations, it is associated with market inefficiency since its abundance reduces proficiency in agricultural markets. Road infrastructure was positive and it influenced market diversity among respondents at 1% level of probability. This signifies that improved road infrastructure advances the extent of achieving market expansion for smallholder tomato farmers. This result concurred with the findings of Karani KD, et al. [64].
The positive and significant coefficient of farm income at 1% level was a good result. This shows that farmers with more farm income recorded high levels of diversity. Further, market diversity increased with an increase in farm income. The plausible explanation is that farmers with high farm income are sufficiently engaged in farm level marketing hence able to explore more markets and increase marketed outputs. This results corroborated with the work of Mango N, et al. [15]. Contrary, the coefficient of off-farm income was negative and significant at 1% level. The result imply that involvement of farmers in off-farm occupations reduced the time and resources devoted to farm marketing hence reduced chances of expansion. In addition, the results concurred with Ndirangu SN, et al. [45]. Further, the results differed with Abate TM, et al. [54] who explained how off-farm employment reduces financial constraints hence empowering farmers to explore various markets.
In this study, contact with extension agents expressed a positive and significant relationship with market diversity at 1% level. This is because frequent contacts between farmers and extension agents increases the chances of smallholders knowing more about market outlet which offer better price for their produce. In addition, extension service provides the platform upon which farmers acquire important market information as well as enabling tomato producers improve marketing strategies, hence leading to expanded market opportunities. Thus, smallholders who frequently engage with extension and training agents are more likely to increase their diversity scores and explore more channels as explained by Wosene G, et al. [29] and Gebrehiwot NT, et al. [51].
The number of years that farmers were involved in tomato marketing was positive and significantly influenced market diversity. The results indicated that more experienced farmers’ attained high levels of diversity compared to their counterparts who had little understanding of tomato markets. This is because experience empowers farmers to enhance market linkages in searching for alternative market channels. In addition, experienced farmers were endowed with more knowledge of costs and benefits associated with tomato marketing. This result was similar to the findings of Haile BT [26]. Further, membership to organized groups influenced market diversity positively. This is because marketing groups increases the bargaining power of farmers by combining their synergies which empowers them to make informed decisions on price [30].
The amount of credit borrowed by smallholders had a positive coefficient that influenced the level of diversity. This implies that farmers who received more credit were able to magnify their diversity scores since credit gave an added advantage in mitigating the effects of financial constraints that exists in markets. A possible explanation is that credit increases the resources at the farmers’ disposal which enabled them to market in different channels and transport more produce to available markets [50]. The results showed that market proximity negatively affected market diversity. This implies that households located far from the markets were less likely to sell large quantities of their produce in an expanded market with reasonable producer prices. This is because increased distance from the farm to the market increases transaction costs thus compelling farmers to sell their produce at farm gate thus agreeing with Ambetsa FL, et al. [38].
From the above results, a number of factors significantly influenced market diversity among smallholder tomato farmers. This implies that the factors are important determinants of market expansion in fresh tomato markets. Despite this, market inefficiencies existed among producers with inconsistent and unreliable prices. A one-way ANOVA was used to understand whether variations in tomato prices were significantly different across levels of market diversity (Table 6).
| Description | Sum of Squares | df | Mean Squares | F | Sig |
|---|---|---|---|---|---|
| Between groups | 13.165 | 3 | 4.388 | 0.21 | 0.889 |
| Within groups | 7924.668 | 380 | 20.854 | ||
| Total | 7937.833 | 383 |
Table 6: Price differences across diversity levels.
The results in Table 6 show that the relationship between market diversity and tomato prices in the study area was insignificant. This implies that the extant market pricing strategies are independent of differences in market diversity among smallholder tomato farmers. That is, there are no significant price changes that result from differences in levels of diversity. Mutayoba V, et al. [20] attributed this to the engagement of different market participants in various nodes in the flow of tomatoes from the producer to markets. Further, Baiyegunhi L, et al. [65] noted that the insignificant relation between market expansion and tomato prices could be ascribed to poor assimilations in producer markets thus low competitiveness among smallholders. This is so despite prices differing significantly across market channels as expressed in Table 3.
Despite having no benefit in terms of price increase, there exists an opportunity to further diversifies farm level marketing [66]. Le argued that market diversity offers a broad platform to generate sales which earns income and minimizes risks that lead to spoilage and consequent losses of fresh products often occurring during a glut. Bellon MR, et al. [67] further revealed that high levels of market expansion (at least 0.7) would reduce participants along marketing systems and instead encourage collective marketing. This would empower farmers to explore rare markets and consequently realize the benefits of market diversity [68].
Conclusions and Recommendations
The study concluded that respondents sold their tomato produce in three channels. Further smallholder farmers had diversified tomato markets thus increasing income streams hence minimal losses. Prevailing market prices were found to be independent of differences in market diversity. This is associated with the weak market linkages and increased number of participants between farmers and potential markets. As a result, smallholder tomato farmers need to form organized groups to enrich their synergies in both input and output markets. Though opportunities to diversify further exists, this potential has been hampered by poorly maintained road infrastructures thus hindering farmers from accessing high value markets. This prompts farmers to sell their produce at inauspicious prices to evade enormous losses. The study therefore recommends upgrading and continued maintenance of the road infrastructures to enhance transportation of fresh products. In addition, agricultural advisory services play a crucial role in boosting market efficiency. Thus, to expand market opportunities there is a need to improve institutional training which will enlighten smallholders on farm level market diversification.
References
-
Abate TM, Dessie AB, Mekie TM (2019) Technical efficiency of smallholder farmers in red pepper production in North Gondar zone Amhara regional state, Ethiopia. Journal of economic structures 8: 1-18.
-
Abdelrazig HE, Musa MI, Elsheikh SE (2018) Value chain analysis for tomato production and marketing in Khartoum State, Sudan. Current investigations in agriculture and current research 5(4): 715-721.
-
Abel OB, Gor CO, Okuro SO, Omanga PA, Bokelmann W (2019) The African indigenous vegetables value chain governance in Kenya. Studies in agricultural economics 121: 41-52.
-
Adegbola YP, Ahoyo ANR, Adekambi SA, Zossou R, Sonehekpon ES, et al. (2019) Consumer preferences for fresh tomatoes in Benin using a conjoint analysis. Journal of international food and agribusiness marketing 31(1): 1-21.
-
Adeoye IB, Balogun OL (2016) Profitability and efficiency of cucumber production among smallholder farmers in Oyo state, Nigeria. Journal of agricultural sciences 61(4): 387-398.
-
Aliyu A, Latif IA, Shamsudin MN, Nawi NM (2016) Factors affecting technical efficiency of rubber smallholders in Negeri Sembilan, Malaysia. Journal of agricultural science 9(5): 226-232.
-
Ambetsa FL, Mwangi SC, Ndirangu SN (2020) Technical efficiency and its determinants in sugarcane production among smallholder sugarcane farmers in Malava sub- county, Kenya. African journal of agricultural research 15(3): 351-360.
-
Aschemann WJ, De HI, Normann A (2016) Consumer- related food waste: Role of food marketing and retailers and potential for action. Journal of international food and agribusiness marketing 28(3): 271-285.
-
Baiyegunhi L, Sharaunga S, Dlangisa S, Ndaba N (2018) Tomato market integration: a case study of the Durban and Johannesburg fresh produce markets in South Africa. Journal of agribusiness and rural development 49: 239-249.
-
Baliyan SP, Masuku MB (2017) Socio-economic factors as determinants of farm management skills among broiler poultry producers in Botswana. International journal of agricultural economics 2(2): 27-34.
-
Bellon MR, Kotu BH, Azzarri C, Caracciolo F (2020) To diversify or not to diversify, that is the question. Pursuing agricultural development for smallholder farmers in marginal areas of Ghana. World development 125: 1-10.
-
Bhattarai K, Sharma S, Panthee DR (2018) Diversity among modern tomato genotypes at different levels in fresh-market breeding. International journal of agronomy pp: 1-15.
-
Biggeri M, Burchi F, Ciani F, Herrmann R (2018) Linking small-scale farmers to the durum wheat value chain in Ethiopia: Assessing the effects on production and wellbeing. Food policy 79: 77-91.
-
Ceschi S, Canavari M, Castellini A (2018) Consumers preference and willingness to pay for apple attributes: A choice experiment in large retail outlets in Bologna (Italy). Journal of international food and agribusiness marketing 30(4): 305-322.
-
Cochran WG (1977) Sampling Techniques. In: 3rd (Edn.), New York: John Wiley and Sons, pp: 448.
-
Chepng’etich E, Nyamwaro SO, Bett EK, Kizito K (2015) Factors that influence technical efficiency of sorghum production: A case of small holder sorghum producers in lower Eastern Kenya. Advances in agriculture pp: 1-11.
-
Dabkienė V (2016) An analysis of biodiversity of Lithuanian family farms. Scientific papers Series management, economic engineering in agriculture and rural development 16(3): 97-102.
-
Dari L, Addo A, Dzisi KA (2016) Pesticide use in the production of Tomato (_Solanum lycopersicum L_.) in some areas of Northern Ghana. African journal of agricultural research-academic journals 11(5): 352-355.
-
Erkie A, Andualem B (2018) Review on parametric and non-parametric methods of efficiency analysis. Crimpson publishers 2(2): 1-7.
-
Faysse N, Onsamran W (2018) The differing strategies of agricultural cooperatives in Thailand: From managing market links to self-reliance. Journal of community development research 11(3): 13-26.
-
Gebrehiwot NT, Azadi H, Taheri F, Van PS (2018) How participation in vegetables market affects livelihoods: empirical evidence from Northern Ethiopia. Journal of international food and agribusiness marketing 30(2): 107-131.
-
Gido EO, Ayuya OI, Owuor G, Bokelmann W (2016) Consumers choice of retail outlets for African indigenous vegetables: Empirical evidence among rural and urban households in Kenya. Cogent food and agriculture 2(1): 1-14.
-
Government of Kenya (GoK) (2018) Kirinyaga County Government. County integrated development plan 2018- 2022 (pp 202). Nairobi, Kenya. Government printers.
-
Grabchak M, Marcon E, Lang G, Zhang Z (2017) The generalized Simpsons entropy is a measure of biodiversity. PloS one 12(3): 1-11.
-
Haile BT (2015) Determinants of technical, allocative and economic efficiencies among onion producing farmers in irrigated agriculture: Empirical evidence from Kobo district, Amhara region, Ethiopia. African journal of agricultural research 10(20): 2180-2189.
-
Huang Z, Karimanzira TTP (2018) Investigating Key Factors Influencing Farming Decisions Based on Soil Testing and Fertilizer Recommendation Facilities (STFRF)-A Case study on rural Bangladesh. Sustainability 10(11): 2-24.
-
Ibitoye SJ, Shaibu UM, Omole B (2015) Analysis of resource use efficiency in tomato (Solanum lycopersicum) production in Kogi State, Nigeria. Asian journal of agricultural extension, economics and sociology 6(4): 220-229.
-
Issahaku H, Nkegbe PK, Yazidu U (2012) Structure, conduct and performance of tomato marketing in Ghana. Journal of economics and sustainable development 3: 156-163.
-
Joshi PK, Joshi L, Birthal PS (2006) Diversification and its impact on smallholders: Evidence from a study on vegetable production. Agricultural economics research review 19: 219-236.
-
Innocent SG, Mulyungi P, Kinyuru JN, Aimable N (2018) Analysis of Institutional factors Influencing Farmer’s Choice of Milk Marketing Channel in Rwanda. International journal for research in applied science and engineering technology 6: 974-978.
-
Kanburi BJ, Fialor SC, Awunyo VD, Yahaya I (2019) Impact of contract farming on rice farm performance: Endogenous switching regression. Cogent economics and finance 7(1): 1-20.
-
Karani KD, Wanjohi J (2017) Factors influencing marketing of agricultural produce among small-scale farmers, a case of sorghum in Giaki location, Meru county Kenya. University of Nairobi, Kenya.
-
Karuku GN, Kimenju JW, Verplancke H (2017) Farmers perspectives on factors limiting tomato production and yields in Kabete, Kiambu County, Kenya. East African agricultural and forestry journal 82(1): 70-89.
-
Kapoor S, Kumar N (2015) Fruit and vegetable consumers behavior: Implications for organized retailers in emerging markets. Journal of international food and agribusiness marketing 27(3): 203-227.
-
Kissoly L, Faße A, Grote U (2018) Implications of Smallholder Farm Production Diversity for Household Food Consumption Diversity: Insights from diverse agro- ecological and market access contexts in rural Tanzania. Horticulturae 4(3): 1-23.
-
Le H (2019) Literature review on diversification strategy, enterprise core competence and enterprise performance. American journal of industry and business management 9(1): 91-108.
-
Lenné JM, Ward AF (2010) Improving the efficiency of domestic vegetable marketing systems in East Africa: Constraints and opportunities. Outlook on agriculture 39(1): 31-40.
-
Lind DA, Marchal WG, Wathen SA (2012) Statistical techniques in business and economics. Egypt: McGraw- Hill Irwin.
-
Mango N, Makate C, Hanyani-Mlambo B, Siziba S, Lundy M (2015) A stochastic frontier analysis of technical efficiency in smallholder maize production in Zimbabwe: The post-fast-track land reform outlook. Cogent economics and finance 3(1): 1-14.
-
Matsane SH, Oyekale AS (2014) Factors affecting marketing of vegetables among small-scale farmers in Mahikeng Local Municipality, North West Province, South Africa. Mediterranean journal of social sciences 5: 1-8.
-
McLaughlin JE, McLaughlin GW, McLaughlin JS, White CY (2016) Using Simpson’s diversity index to examine multidimensional models of diversity in health professions education. International journal of medical education 7: 1-5.
-
Meniga M (2014) The major problems and prospects of tomato marketing: An empirical analysis. International journal of management research and business strategy 3: 80-93.
-
Morris EK, Caruso T, Buscot F, Fischer M, Hancock C, et al. (2014) Choosing and using diversity indices: insights for ecological applications from the German Biodiversity Exploratories. Ecology and evolution 4(18): 3514-3524.
-
Mukhtar U, Mohamed Z, Shamsuddin MN, Sharifuddin J, Iliyasu A (2018) Application of data envelopment analysis for technical efficiency of smallholder pearl millet farmers in Kano state, Nigeria. Bulgarian journal of agricultural science 24(2): 213-222.
-
Mutayoba V, Ngaruko D (2015) Market performance and farmers choice of marketing channels of high value crops in Tanzania. International journal of economics, commerce and management United Kingdom 3(2): 276- 289.
-
Mutayoba V, Ngaruko D (2018) Assessing tomato farming and marketing among smallholders in high potential agricultural areas of Tanzania. International journal of economics, commerce and management 6(8): 577-590.
-
Mwangi MW, Kimenju JW, Narla RD, Kariuki GM , Muiru WM (2015) Tomato management practices and diseases occurrence in Mwea West Sub County. Journal of natural sciences research 5(20): 119-124.
-
Najjuma E, Kavoi MM, Mbeche R (2016) Assessment of technical efficiency of open field production in Kiambu County, Kenya (Stochastic frontier approach). Journal of agriculture, science and technology 17(2): 21-39.
-
Ndirangu SN, Mbogoh SG, Mbatia OLE (2017) Effects of Land Fragmentation on Food Security in Three Agro- ecological Zones of Embu County in Kenya. Asian journal of agricultural extension, economics and sociology 18(4): 1-9.
-
Ngenoh E, Kurgat BK, Bett HK, Kebede SW, Bokelmann W (2019) Determinants of the competitiveness of smallholder African indigenous vegetable farmers in high-value agro-food chains in Kenya: A multivariate probit regression analysis. Agricultural and food economics 7(2): 1-17.
-
Nguetti JH, Imungi JK, Okoth MW, Wang’ombe J, Mbacham WF, Mitema SE (2018) Assessment of the knowledge and use of pesticides by the tomato farmers in Mwea Region, Kenya. African Journal of Agricultural Research 13(8): 379-388.
-
Ntakyo PR, Van den Berg M, Mugisha J (2019) Market production and productivity: The effects of cash cropping on technical efficiency in staple crop production. African Journal of Agricultural Research 14(19): 828-842.
-
Ochilo WN, Nyamasyo GN, Kilalo D, Otieno W, Otipa M, et al. (2019) Characteristics and production constraints of smallholder tomato production in Kenya. Scientific African 2: 1-10.
-
Okello JJ, Hutchinson MJ, Mwang’ombe A, Ambuko J, Olubayo F, et al. (2015) Consumer Demand for Value- added Products of African Indigenous Vegetables in Coastal Kenya: The Case of Sun-dried and Frozen Cowpea Leaves. Journal of agriculture, food systems, and community development 6(1): 189-207.
-
Ongeri BO (2014) Small Scale Horticultural farming along the Kenyan Highways and Local economic development: Exploring the effect of factor prices. International review of research in emerging markets and the global economy 3: 102-119.
-
Onianwa OO, Wheelock G, Mojica MN (2005) An analysis of the determinants of farmer-to-consumer direct- market shoppers. Journal of food distribution research 36(1): 130-134.
-
Osebeyo SO, Aye GC (2014) Transaction costs and marketing decision: a case study of smallholder tomato farmers in Makurdi, Nigeria. Urban, planning and transport research 2(1): 333-340.
-
Osondu CK, Nwadike FC, Ijioma JC, Udah SC, Ugboaja CI (2015) Marketing Performance of Salad Vegetables: The case of cabbage marketing in Abia State, Nigeria. International journal of agricultural science, research and technology in extension and education systems 4(3): 151-162.
-
Panda RK, Sreekumar (2012) Marketing channel choice and marketing efficiency assessment in agribusiness. Journal of international food and agribusiness marketing 24(3): 213-230.
-
Ruttoh KJ, Bett KE, Nyairo N (2018) Empirical analysis of structure and conduct of tomato marketing in Loitoktok, Kajiado County, Kenya. International journal of agricultural extension and rural development 6(4): 628-638.
-
Sashimatsung, Giribabu (2015) Economic analysis on production and marketing of Chilli in Mokokchung District of Nagaland. Journal of marketing and consumer research 13: 317-330.
-
Sen B, Venkatesh P, Jha GK, Suresh A, Singh DR (2017) Agricultural diversification and its impact on farm income: a case study of Bihar. Agricultural economics research review 30: 77-88.
-
Sudarević T, Šurjanović I, Vlahović B (2015) Viral Marketing in the Food Industry: Canada vs. Serbia. Journal of international food and agribusiness marketing 27(2): 100-119.
-
Tanah SKDTN (2014) Assessing the bottom water quality of a Ramsar site subjected to anthropogenic disturbances: A case study in Kuching wetland national park, Sarawak, Malaysia. Sains Malaysiana 43: 1491- 1501.
-
Tura EG, Hamo TK (2018) Determinants of Tomato Smallholder Farmers Market Outlet Choices in West Shewa, Ethiopia. Journal of agricultural economics and rural development 6(8): 165-171.
-
Wosene G, Ketema M, Ademe A (2018) Factors affecting market outlet choices of pepper producers in Wonberma district, Northwest Ethiopia: multivariate probit approach. Cogent food and agriculture 4(1): 1-13.
-
Yabs JK, Awuor EO (2016) Market Orientation and Performance of Fruit Exporting Firms in Kenya: A Theoretical Perspective. European journal of business and management 8(9): 23-33.
-
Yesdhanulla S, Aparna B (2018) Marketing channels and price spread of tomato in Chittoor district of Andhra Pradesh. Journal of pharmacognosy and phytochemistry 7(2): 873-876.
- Enhancement of Vegetative Growth and Fruit Yield in Cucumber (Cucumis sativus L.) via Spiritual Blessing (Biofield) Energy Intervention
- Production of Açaí (Euterpe oleracea Mart.) under Different Agroforestry System Management Intensities in Amazonian Floodplain (Varzea) Forests
- Coffee and the Production Region: What is the Secret to the Expression "Quality"?
- Experiential Agripreneurship Training in Sub-Saharan Africa: Integrating a Business Incubator into Postgraduate Livestock Education at the University of Buea
- Advances in Agricultural High-Quality Development
- Linking Compost Residue to ABAGE in Plants - a Short Note