Utilization of IMRT and Brachytherapy for Low Risk and Intermediate Risk Prostate Cancer Patients Analysis of the Real World Scenario
Purpose: Two main techniques in radiation therapy (RT) for the treatment of low-risk and intermediate-risk prostate cancer (PCa) are intensity-modulated radiation therapy (IMRT) and brachytherapy (BT). In this study, the pattern of utilization of IMRT, low dose-rate (LDR) BT, and high dose-rate (HDR) BT has been evaluated using a large hospital based registry database. Methods: We analyzed a very large data set of N0, M0, non-surgical, stage T1-T2c prostate cancer patients diagnosed between 2004 and 2015 from the National Cancer Database (NCDB). Based on the RT techniques used, we considered three groups of patients: (1) IMRT (n=61,159; 48.4%) who received an initial as well as a boost treatment with the IMRT, (2) BT LDR (n=43,293; 34.3%), and (3) BT HDR (n=21,938; 17.3%). A total dose of 70-81Gy for IMRT was considered. For brachytherapy, LDR and HDR or unspecified brachytherapy was considered as monotherapy. Patients were stratified according to the National Comprehensive Cancer Network (NCCN) guidelines into: low-risk [clinical stage T1-T2a, Gleason Score (GS) of ≤ 6 (Grade Group 1), and Prostate-specific antigen (PSA) of < 10 ng/mL] and intermediate-risk [clinical stage T2b-T2c, GS of 7 (Grade Groups 2 and 3), and PSA of 10-20 ng/mL]. OS probability was determined using the Kaplan-Meier estimator. Propensityscore matched (PSM) analysis was performed for each risk group (low and intermediate) for the three research treatment modalities (IMRT, BT LDR, and BT HDR). IBM SPSS software was used for statistical analysis; p-value <0.05 was considered statistically significant. Results: There has been a relative increase in IMRT usage for the treatment of both low-risk (29% to 53%) and intermediaterisk (53% to 77%) PCa patients from 2004 to 2015. Observed comparable median OS in low-risk and intermediate-risk patients in these three modalities IMRT (74.8/63.4 mo.), LDR (77.7/65.7 mo.) and HDR (83.5/72.1 mo.). Conclusion: The pattern of utilization of RT modality seems inclined toward increased use of IMRT over brachytherapy (59% vs. 41%) for both the low-risk and intermediate-risk PCa patients. Over the years, use of IMRT increased more in low-risk patient group than in intermediate-risk group.
Introduction
Prostate cancer (PCa) is one of the most common cancers among men in US, with a 12.1% lifetime probability of developing the cancer (as per statistics from 2015-2017). The disease accounts for slightly above 21% of new cancer diagnoses in men every year [1]. Despite a high prevalence rate, prostate cancer accounts for about 10% of primary cancer-related deaths in men, however, has a 98% survival rate [2]. PCa patients often die due to inter current illnesses or secondary issues stemming from the original cancer and complications of treatment modalities, such as failure in the pulmonary circulation and heart failure [3]. Nonetheless, this disease remains of utmost interest to cancer researchers. PCa patients are currently stratified into three risk groups (low, intermediate, and high) based on three main factors: clinical T stage, Gleason score (now histologically compressed into Grade Groups), and PSA levels [4]. A wide array of treatment modalities is used consistently and preferentially to manage each individual’s condition related to age, risk group, demographic, treatment center, and personal preferences, among many other factors. Surgery (prostatectomy), brachytherapy, intensity-modulated radiation therapy, hormonal therapy, and combination of multiple modalities are some of the commonly used treatment modalities [5]. Clinical guidelines regarding various treatment modalities have proven each of them to be safe, giving patients increased autonomy to choose a treatment plan of their preference [6].
IMRT is widely used as a standard treatment technique for prostate cancer [7]. IMRT’s dose escalation is advantageous in cancer control without increasing toxicity [8, 9, 10]. There is evidence that high-dose IMRT (up to 81 Gy) yields high efficacy in preventing biochemical failure with acceptable side effects over the course of 10 years [11]. Meanwhile, BT’s benefits include high dose conformity within the target volume, coupled with a rapid dose fall-off in adjacent organs and normal tissues. There is also a relatively short treatment period with excellent functional outcomes [12]. BT is advantageous in overcoming overall organ motion, and sparing nearby organs and at the same time delivering a very high dose. This allows for a thorough and concise biological planning [12]. Even though BT is valuable in treating localized, low-risk prostate cancer, it is neither utilized frequently nor practiced uniformly across the nation [12, 13, 14]. To date, there have been limited randomized clinical studies performed to investigate the effectiveness of individual treatments for prostate cancer and they remain inconclusive unlike some other types of studies, due to lack of concrete control groups and possibilities of confounding variables [15, 16]. Randomized attempts to assess such differences of effectiveness between various treatment modalities have been prematurely closed, due to decreases in longitudinal active surveillance and thus potential resulting toxicities [17]. Hence, randomized data directly comparing the efficacy and survival outcome of IMRT vs brachytherapy is currently lacking on a national scale [13].
This paper retrospectively investigates trends that are representative of prostate cancer management in the US population (i.e., a real-world scenario). Using the NCDB, data was accumulated from an extensive variety of centers across the country that differ in factors such as demographics served, size of the institution, research intent, etc. This large, diverse database may help us to reduce some of the biases expressed by big cancer centers and instead uncover the outcomes in community-based and smaller treatment centers across the country. We hope that clinicians and researchers may use these analyses to adjust or provide further guidance to their current practices of treating this prevalent disease.
Materials and Methods
Data Source
The NCDB is a nationwide clinical oncology database cosponsored by the American College of Surgeons and the American Cancer Society. Data is extracted from hospital registries of 1,500+ cancer-accredited facilities and represents an estimated 70% of all cancer cases across the United States. The information obtained from the NCDB included patient’s demographics, facility type/location, cancer characteristics, Charlson/Deyo scores, treatment modality, and survival data for prostate cancer patients from 2004 to 2015. The records of these patients in the database were de-identified and sent to researchers for analysis after the approval of their research proposals. The American College of Surgeons and the Commission on Cancer have not verified and are not responsible for the conclusions drawn from the data by the investigators in this study.
Subject Selection
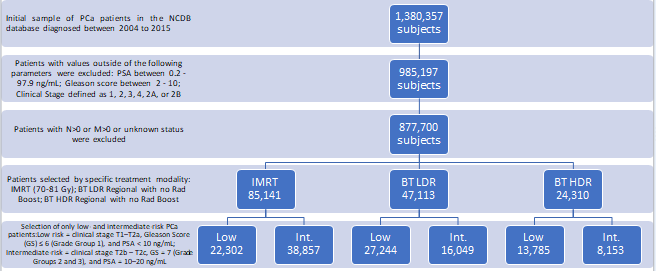
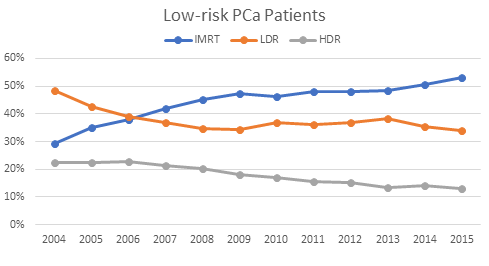
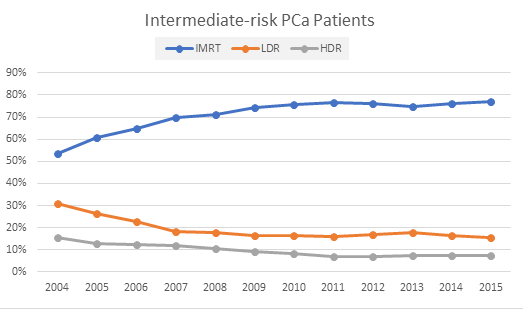
A total of 1,380,357 patients were identified with prostate cancer diagnosis from 2004 to 2015. Of these, patients with PSA levels between 0.2-97.9 ng/mL, Gleason score between 2-10, and Clinical Stage defined as 1, 2, 3, 4, 2A, or 2B were considered, yielding 985,197 subjects. Only patients with the American Joint Committee on Cancer (AJCC) N0 and M0 were considered for the analysis; the rest were excluded (Figure 1). From the remaining 877,700 subjects, PCa patients who underwent prostatectomy surgery/chemotherapy or had unknown surgery/chemotherapy status were also excluded. Finally, only the patients treated with IMRT (70-81 Gy), BT LDR, and BT HDR were included. Total subject frequency by treatment modality was as follows: 85,141 IMRT patients, 47,113 BT LDR patients, and 24,310 BT HDR patients. These patient groups were then stratified by risk, according to the NCCN guidelines into two categories: low-risk [clinical stage T1-T2a, GS ≤ 6 (Grade Group 1), and PSA < 10 ng/ mL] and intermediate-risk [clinical stage T2b-T2c, GS = 7 (Grade Groups 2 and 3), and PSA = 10-20 ng/mL]. To be eligible for these categories, patients had to meet all three necessary criteria. Other T2 patients (i.e., T2-undefined) that met the GS and PSA criteria were also considered. Patients not categorized specifically into these two groups were excluded as out-of-scope for this study. Patient stratification is shown in (Figure 1). The yearly breakdown and utilization of treatment modality of the studied patient population from 2004 to 2015 are illustrated in (Figures 2 & 3).
Based on the specific radiotherapy technique used, we considered two treatment groups of patients from the eligible sample: (1) IMRT group (n=61,159; 48.4%), inclusive of initial + IMRT boost treatment, and (2) BT only group (n=65,231; 51.6%), who were treated with either low-dose- rate (LDR), high-dose-rate (HDR), or any other unspecified brachytherapy. The total dose considered was 70-81Gy for IMRT. The 70-81 Gy IMRT dosage was inclusive of the following patterns: 70-81 Gy in initial/primary IMRT with no additional Boost and 45-51 Gy with an in initial IMRT plan followed by a 25-30 Gy IMRT Boost plan. For Brachytherapy, only monotherapy was considered utilizing LDR, HDR, or unspecified brachytherapy.
Definition of Variables
The year of diagnosis was separated into periods from 2004-2007, 2008-2011, and 2012-2015. Age was stratified into groups of under 65, 65-69, 70-74, and more than 74 years old. The race was defined as white, black, other, or unknown. Insurance was categorized as private, government (including Medicare, Medicaid, and other government), or no insurance. Charlson-Deyo comorbidity index was recorded as the summation of comorbid conditions and was scored as 0, 1, 2, with a score of 0 representing no comorbid conditions recorded [18]. The 2013 US Department of Agriculture Rural-Urban Continuum was used to define metropolitan, urban, and rural areas. Counties in metropolitan areas were coded metropolitan, counties with an urban population of ≥2500 but those not in a metropolitan area were termed urban, and counties with an urban population of <2500 were termed rural. Residential areas were stratified by median income into less than $38,000, $38,000-$47,999, $48,000- $62,999, and $63,000 and above; the statuses of a small set of patients were unknown. Similarly, the education levels of the residential areas were separated by percentage of residents without high school degrees: <7%, 7-12.9%, 13- 20.9%, >21%, and unknown. Distance from the residence to the facility was calculated as that between the center of the patient’s zip code and the treating facility’s mailing address. Facilities were primarily classified as academic/research- based or non-academic centers, with the status of 10 facilities unknown. Facility location was defined as:
- Northeast: CT, MA, ME, NH, NJ, NY, PA, RI, and VT.
- South: AL, AR, DC, DE, FL, GA, KY, LA, MD, MS, NC, OK, SC, TN, TX, VA, and WV.
- Midwest: IA, IL, IN, KS, MI, MN, MO, ND, NE, OH, SD, and WI.
- West: AZ, AK, CA, CO, ID, HI, MT, NM, NV, OR, UT, WA, and WY. Facilities were also stratified by the volume of cases seen, ranging from ≤100, 101-200, 201-300, and >300 cases. Classification of cases into T-Stages was divided into Stages 1, 2, 2A, 2B, or unknown. Lastly, the use of hormone therapy for PCa was included as yes, no, or unknown.
Statistical Analysis
To account for confounding variables, propensity score matching (PSM) was performed for patients treated with IMRT or BT LDR or BT HDR, for both risk groups (low and intermediate). Patients in the IMRT group were well matched with patients in the BT LDR group and the BT HDR group on the following characteristics: age of the patient, race of the patient, distance from the facility, year of diagnosis, clinical T stage, hormone therapy, duration of radiation (days from the start of radiation to the end of radiation), and the number of days between treatment starting and the day of diagnosis. The primary endpoint was median OS. Propensity score matching (1–1 nearest neighbor matching without replacement) was employed to match the three treatment groups using the caliper match algorithm described by Coca-
Perraillon, with the caliper width set to 0.01 [19]. These outcomes were assessed with a log-rank test, and the hazard ratios (HR) were determined by univariate Cox regression. Outcomes of survival probability were determined using a Kaplan-Meier estimator. IBM SPSS software (version 26.0) was used for the overall statistical analysis. For this study, a p-value <0.05 was considered statistically significant.
Disclaimer
This study was carried out as per the guidelines, data dictionary, and accompanying de-identified files provided by the NCDB. The findings of this study are neither endorsed nor verified by the NCDB, they are independently concluded by the listed investigators.
Results
Gross Breakdown
A total of 126,390 patients were selected in this study after all pertaining inclusion and exclusion criteria had been applied. The breakdown of the total post-inclusion and post- exclusion sample (126,390 subjects) was performed via risk stratification: 63,331 subjects (50.1% of total) being classified as low-risk and 63,059 subjects (49.9%) are being classified as intermediate-risk. The individual risk categories were then further stratified into respective treatment modalities as shown in (Figure 1). These modalities are subsequently trended over the course of the study period in Figures 2 and 3. Demographical breakdown by treatment modality is as follows: 65,231 patients (51.6% of total) that underwent brachytherapy and 61,159 patients (48.4%) that underwent 70-81 Gy IMRT. Baseline characteristics, including patient demographics, facility type, stage of disease and treatment for low- and intermediate-risk categories are shown in (Table 1). These baseline characteristics for each risk group are broken down further by treatment modality in (Table 2). It appeared that in both low-risk and intermediate-risk groups, younger patients with private insurance were more likely to receive BT as primary therapy (Table 1).
| Baseline characteristics | Number of Low-risk patients (%) | Number of Intermediate-risk patients (%) |
|---|---|---|
| Overall (n) | 63331 | 63059 |
| Year of Diagnosis | ||
| 2004 – 2007 | 28692 (45.3) | 19414 (30.8) |
| 2008 – 2011 | 23291 (36.8) | 23074 (36.6) |
| 2012 – 2015 | 11348 (17.9) | 20571 (32.6) |
| Age (years) | ||
| Less than 65 | 26506 (41.9) | 18426 (29.2) |
| 65 – 69 | 15957 (25.2) | 14699 (23.3) |
| 70 – 74 | 13193 (20.8) | 15398 (24.4) |
| More than 74 | 7675 (12.1) | 14536 (23.1) |
| Race | ||
| White | 52579 (83.0) | 51096 (81.0) |
| Black | 8643 (13.6) | 9634 (15.3) |
| Other | 1367 (2.2) | 1651 (2.6) |
| Unknown | 742 (1.2) | 678 (1.1) |
| Insurance Status | ||
| Private | 27396 (43.3) | 20299 (32.2) |
| Government | 34505 (54.5) | 41304 (65.5) |
| 565 (0.9) | 683 (1.1) | |
| Unknown | 865 (1.4) | 773 (1.2) |
| Residential Setting | ||
| Metro | 50928 (80.4) | 50228 (79.7) |
| Urban | 9545 (15.1) | 9665 (15.3) |
| Rural | 1274 (2.0) | 1498 (2.4) |
| Unknown | 1584 (2.5) | 1668 (2.6) |
| Median Income (residential area) | ||
| Less than $38,000 | 10001 (15.8) | 10591 (16.8) |
| $38,000 - $47,999 | 14462 (22.8) | 14263 (22.6) |
| $48,000 - $62,999 | 16639 (26.3) | 17061 (27.1) |
| $63,000 and more | 21692 (34.3) | 20670 (32.8) |
| Unknown | 537 (0.8) | 474 (0.8) |
| Without high school degree (residential area), % | ||
| Less than 7 | 16648 (26.3) | 16371 (26.0) |
| 7 – 12.9 | 21629 (34.2) | 21228 (33.7) |
| 13 – 20.9 | 15526 (24.5) | 15609 (24.8) |
| 21 and higher | 9031 (14.3) | 9427 (14.9) |
| Unknown | 497 (0.8) | 424 (0.7) |
| Distance from facility to residence, miles | ||
| Less than 5 | 17661 (27.9) | 18191 (28.8) |
| 5 – 9.9 | 14484 (22.9) | 14597 (23.1) |
| 10 – 24.9 | 17373 (27.4) | 17249 (27.4) |
| 25 and higher | 13336 (21.1) | 12618 (20.0) |
| Unknown | 477 (0.8) | 477 (0.8) |
| Facility Type | ||
| Non-academic | 46377 (73.2) | 45563 (72.3) |
| Academic/research | 16944 (26.8) | 17495 (27.7) |
| Unknown | 10 (0.0) | 1 (0.0) |
| Facility Location | ||
| Northeast | 15325 (24.2) | 14377 (22.8) |
| South | 22481 (35.5) | 21162 (33.6) |
| Midwest | 16979 (26.8) | 18165 (28.8) |
| West | 8536 (13.5) | 9353 (14.8) |
| Unknown | 10 (0.0) | 1 (0.0) |
| Facility volume, cases | ||
| Less than 100 | 28250 (44.6) | 31560 (50.0) |
| 101 - 200 | 14798 (23.4) | 16310 (25.9) |
| 201 - 300 | 10352 (16.3) | 7515 (11.9) |
| More than 300 | 9931 (15.7) | 7674 (12.2) |
| T stage | ||
| 1 | 19200 (30.3) | 2656 (4.2) |
| 2 | 41668 (65.8) | 31695 (50.3) |
| 2A | 1617 (2.6) | 25760 (40.9) |
| 2B | 844 (1.3) | 2935 (4.7) |
| Unknown | 2 (0.0) | 13 (0.0) |
| Prostate-specific antigen | ||
| Between 0.2 to 2.9 ng/mL | 6606 (10.4) | 3963 (6.3) |
| Between 3 to 6.9 ng/mL | 43068 (68.0) | 29467 (46.7) |
| Between 7 and 10.0 ng/mL | 13657 (21.6) | 13536 (21.5) |
| Between 10.1 and 20 ng/mL | ----------- | 16093 (25.5) |
| Total Gleason Score | ||
| Less than 6 | 1734 (2.7) | 360 (0.6) |
| 6 | 61597 (97.3) | 10801 (17.1) |
| 7 | ----------- | 51898 (82.3) |
| Radiotherapy | ||
| IMRT | 22302 (35.2) | 38857 (61.6) |
| BT LDR | 27344 (43.0) | 16049 (25.5) |
| BT HDR | 13785 (21.8) | 8153 (12.9) |
| Hormonal Therapy | ||
| No | 51155 (80.8) | 39695 (62.9) |
| Yes | 10024 (15.8) | 21855 (34.7) |
| Unknown | 2152 (3.4) | 1509 (2.4) |
Table 1: Baseline characteristics of all patients with low- or intermediate-risk prostate cancer who received IMRT or BT LDR or B
| Low Risk | IMRT (n = 22302) | BT LDR (n = 27244) | BT HDR (n = 13785) |
|---|---|---|---|
| Year of Diagnosis | |||
| 2004 – 2007 | 8424 (37.8) | 13061 (47.9) | 7207 (52.3) |
| 2008 – 2011 | 9115 (40.9) | 9436 (34.6) | 4740 (34.4) |
| 2012 – 2015 | 4763 (21.4) | 4747 (17.4) | 1838 (13.3) |
| Age (years) | |||
| Less than 65 | 7631 (34.2) | 12348 (45.3) | 6527 (47.3) |
| 65 – 69 | 5735 (25.7) | 6910 (25.4) | 3312 (24.0) |
| 70 – 74 | 5274 (23.6) | 5297 (19.4) | 2622 (19.0) |
| More than 74 | 3662 (16.4) | 2689 (9.9) | 1324 (9.6) |
| Race | |||
| White | 18029 (80.8) | 23214 (85.2) | 11336 (82.2) |
| Black | 3484 (15.6) | 3321 (12.2) | 1838 (13.3) |
| Other | 542 (2.4) | 433 (1.6) | 392 (2.8) |
| (Unknown = 742) | |||
| Insurance Status | |||
| Private | 7956 (35.7) | 12682 (46.5) | 6758 (49.0) |
| Government | 13727 (61.6) | 14038 (51.5) | 6740 (48.9) |
| 263 (1.2) | 191 (0.7) | 111 (0.8) | |
| (Unknown = 865) | 356 (1.6) | 333 (1.2) | 176 (1.3) |
| Residential Setting | |||
| Metro | 18353 (82.3) | 21009 (77.1) | 11566 (83.9) |
| Urban | 3052 (13.7) | 4766 (17.5) | 1727 (12.5) |
| Rural | 359 (1.6) | 696 (2.6) | 219 (1.6) |
| (missing = 1584) | |||
| Median Income (residential area) Less than $38,000 3765 (16.9) 4371 (16.0) 1865 (13.5) $38,000 - $47,999 4993 (22.4) 6608 (24.3) 2861 (20.8) $48,000 - $62,999 6100 (27.4) 7131 (26.2) 3408 (24.7) $63,000 and more 7289 (32.7) 8849 (32.5) 5554 (40.3) (missing = 537) Without high school degree (residential area), % | |||
| Less than 7 | |||
| 7 – 12.9 | 5616 (25.2) | 6962 (25.6) | 4070 (29.5) |
| 13 – 20.9 | 7616 (34.1) | 9406 (34.5) | 4607 (33.4) |
| 21 and higher | 5493 (24.6) | 6720 (24.7) | 3313 (24.0) |
| (missing = 497) | 3433 (15.4) | 3892 (14.3) | 1706 (12.4) |
| Distance from facility to residence, miles Less than 5 7591 (34.0) 6631 (24.3) 3439 (24.9) 5 – 9.9 5649 (25.3) 5650 (20.7) 3185 (23.1) 10 – 24.9 6054 (27.1) 7575 (27.8) 3744 (27.2) 25 and higher 2868 (12.9) 7133 (26.2) 3335 (24.2) (missing = 477) Facility Type | |||
| Non-academic | 16323 (73.2) | 20638 (75.8) | 9416 (68.3) |
| Academic/research | 5978 (26.8) | 6601 (24.2) | 4365 (31.7) |
| (missing = 10) | |||
| Facility Location | |||
| Northeast | 6324 (28.4) | 5925 (21.7) | 3076 (22.3) |
| South | 6973 (31.3) | 10494 (38.5) | 5014 (36.4) |
| Midwest | 6469 (29.0) | 7243 (26.6) | 3267 (23.7) |
| West | 2535 (11.4) | 3577 (13.1) | 2424 (17.6) |
| (missing = 10) | |||
| Facility volume, cases | |||
| Less than 100 | 12898 (57.8) | 10308 (37.8) | 5044 (36.6) |
| 101 - 200 | 4028 (18.1) | 6873 (25.2) | 3897 (28.3) |
| 201 - 300 | 3247 (14.6) | 4896 (18.0) | 2209 (16.0) |
| More than 300 | 2129 (9.5) | 5167 (19.0) | 2635 (19.1) |
| T stage | |||
| 1 | 7783 (34.9) | 8175 (30.0) | 3242 (23.5) |
| 2 | 13434 (60.2) | 18183 (66.7) | 10051 (72.9) |
| 2A | 771 (3.5) | 528 (1.9) | 318 (2.3) |
| 2B | 313 (1.4) | 358 (1.3) | 173 (1.3) |
| (missing = 2) | |||
| Hormonal Therapy | |||
| No | 18503 (83.0) | 21502 (78.9) | 11150 (80.9) |
| Yes | 2977 (13.3) | 4836 (17.8) | 2211 (16.0) |
| (unknown = 2152) |
Table 2: Comparative utilization of IMRT, BT LDR, and BT HDR for low-risk and intermediate-risk prostate cancer patients (p-value
Trends In Utilization
As observed in Figures 2 and 3, there was a decline in usage of BT (both LDR and HDR) in the treatment of low- and intermediate-risk PCa patients from 2004-2015. While year- to-year variations may not fully adhere to the gross pattern over the 11 years, the overall trend of BT utilization declined over this timespan. In contrast, a relative increase in the usage of IMRT in both risk categories was observed.
Univariable Analyses of Patient Population
In the low-risk population, overall survival was significantly increased with races other than black or white, incomes greater than $38,000, treatment at an academic/ research facility, and facility volume >200 patients seen. Within the low-risk population, poorer survival was associated with increasingly rural areas, government-insured and uninsured populations, areas with greater percentages of those without high school diplomas (starting at less than 7%), facilities located in the South and the Midwest, and patients who underwent hormonal therapy. Univariable analyses differed when compared to the intermediate-risk population group. Significant differences in overall survival were no longer present with patients living in rural areas, patients without insurance, residential areas with median incomes between $38,000-$47,999, and those undergoing hormonal therapy. However, facility locations in the South and the Midwest were still significantly associated with poorer survival (in comparison to the Northeast).
Multivariable Analyses of Patient Populations
Multivariable Cox proportional hazard models is shown in Table 3 to better understand survival trends. Hazard ratios are superior in effectively capturing the effects of the variables studied over the entire duration of the Kaplan-Meier curve, rather than at a single point as is done by the median survival statistic [20]. In addition, such analysis allows for further understanding of survival trends if carried out with propensity score matching. Within the low-risk population, the multivariable analysis indicated significantly increased overall survival associated with relatively younger patients, incomes greater than $63,000, the West (geographical location of the facility), and usage of BT LDR and BT HDR. Additionally, poorer survival outcomes were significantly associated with government insurance and areas with greater percentages of those without high school diplomas 13% or greater. The same trends were noticed in the multivariable analyses of the intermediate-risk population group.
| Factor | Univariable | Multivariable | ||
|---|---|---|---|---|
| HR (95% CI) | P-value | HR (95% CI) | P-value | |
| Low-risk | ||||
| Year of Diagnosis | ||||
| 2004 – 2007 | 1 | 0.75 | 1 | 0.311 |
| 2008 – 2011 | 1.01 (0.96 – 1.06) | 0.344 | 1.03 (0.97 – 1.10) | 0.998 |
| 2012 – 2015 | 0.94 (0.82 – 1.07) | 1.00 (0.85 – 1.18) | ||
| Age (years) | ||||
| Less than 65 | 1 | <0.001 | 1 | <0.001 |
| 65 – 69 | 1.69 (1.56 – 1.78) | <0.001 | 1.32 (1.22 – 1.43) | <0.001 |
| 70 – 74 | 2.30 (2.16 – 2.45) | <0.001 | 1.78 (1.65 – 1.93) | <0.001 |
| More than 74 | 3.65 (3.43 – 3.89) | 2.80 (2.59 – 3.04) | ||
| Race | ||||
| White | 1 | 0.418 | 1 | 0.098 |
| Black | 1.03 (0.96 – 1.10) | <0.001 | 1.06 (0.99 – 1.15) | 0.011 |
| Other | 0.67 (0.56 – 0.80) | 0.79 (0.65 – 0.95) | ||
| Insurance | ||||
| Private | 1 | <0.001 | 1 | <0.001 |
| Government | 2.23 (2.12 – 2.35) | <0.001 | 1.44 (1.35 – 1.54) | 0.014 |
| 1.55 (1.20 – 2.01) | 1.41 (1.07 – 1.84) | |||
| Residential Setting | ||||
| Metro | 1 | <0.001 | 1 | 0.256 |
| Urban | 1.19 (1.12 – 1.26) | <0.001 | 1.04 (0.97 – 1.12) | 0.009 |
| Rural | 1.43 (1.24 – 1.64) | 1.22 (1.05 – 1.42) | ||
| Median Income (residential area) | ||||
| Less than $38,000 | 1 | <0.001 | 1 | 0.018 |
| $38,000 - $47,999 | 0.87 (0.81 – 0.93) | <0.001 | 0.91 (0.85 – 0.99) | 0.003 |
| $48,000 - $62,999 | 0.77 (0.72 – 0.82) | <0.001 | 0.89 (0.82 – 0.96) | <0.001 |
| $63,000 and more | 0.64 (0.60 – 0.68) | 0.82 (0.74 – 0.90) | ||
| Without high school degree (residential area), % | ||||
| Less than 7 | 1 | <0.001 | 1 | 0.002 |
| 7 – 12.9 | 1.18 (1.12 – 1.26) | <0.001 | 1.11 (1.04 – 1.19) | <0.001 |
| 13 – 20.9 | 1.38 (1.30 – 1.47) | <0.001 | 1.22 (1.12 – 1.32) | <0.001 |
| 21 and higher | 1.49 (1.39 – 1.60) | 1.26 (1.14 – 1.39) | ||
| Distance from Facility to Residence, Miles | ||||
| Less than 5 | 1 | --- | 1 | --- |
| 5 – 9.9 | 0.93 (0.88 – 0.99) | 0.025 | 1.00 (0.94 – 1.07) | 0.909 |
| 10 – 24.9 | 0.92 (0.87 – 0.98) | 0.005 | 0.99 (0.94 – 1.06) | 0.924 |
| 25 and higher | 0.95 (0.89 – 1.01) | 0.107 | 0.90 (0.83 – 0.97) | 0.006 |
| Facility Type | ||||
| Non-academic | 1 | <0.001 | 1 | 0.176 |
| Academic/research | 0.85 (0.81 – 0.90) | 0.96 (0.91 – 1.02) | ||
| Facility Location | ||||
| Northeast | 1 | <0.001 | 1 | 0.195 |
| South | 1.20 (1.14 – 1.27) | 0.001 | 1.04 (0.98 – 1.11) | 0.666 |
| Midwest | 1.11 (1.04 – 1.17) | <0.001 | 0.99 (0.92 – 1.05) | <0.001 |
| West | 0.74 (0.68 – 0.80) | 0.78 (0.72 – 0.85) | ||
| Facility Volume, Cases | ||||
| Less than 100 | 1 | 0.511 | 1 | 0.8 |
| 101 –– 200 | 1.02 (0.97 – 1.08) | <0.001 | 1.01 (0.95 – 1.07) | 0.005 |
| 201 –– 300 | 0.87 (0.82 – 0.93) | <0.001 | 0.91 (0.85 – 0.97) | 0.168 |
| More than 300 | 0.82 (0.77 – 0.87) | 0.95 (0.89 – 1.02) | ||
| T stage | ||||
| 1 | 1 | 0.838 | 1 | 0.903 |
| 2 | 1.02 (0.83 – 1.27) | 0.523 | 0.99 (0.79 – 1.24) | 0.484 |
| 2A | 0.92 (0.70 – 1.20) | 0.063 | 0.91 (0.69 – 1.19) | 0.179 |
| 2B | 1.07 (0.99 – 1.16) | 1.07 (0.97 – 1.17) | ||
| Radiotherapy | ||||
| IMRT | 1 | <0.001 | 1 | <0.001 |
| BT LDR | 0.75 (0.71 – 0.79) | <0.001 | 0.85 (0.81 – 0.90) | <0.001 |
| BT HDR | 0.69 (0.65 – 0.73) | 0.83 (0.78 – 0.88) | ||
| Hormonal Therapy | ||||
| No | 1 | <0.001 | 1 | 0.125 |
| Yes | 1.14 (1.08 – 1.21) | 0.96 (0.91 – 1.01) | ||
| Intermediate-risk | ||||
| Year of Diagnosis | ||||
| 2004 – 2007 | 1 | 0.955 | 1 | 0.828 |
| 2008 – 2011 | 0.99 (0.95 – 1.05) | 0.464 | 1.01 (0.95 – 1.06) | 0.977 |
| 2012 – 2015 | 0.97 (0.89 – 1.06) | 0.99 (0.89 – 1.11) | ||
| Age (years) | ||||
| Less than 65 | 1 | <0.001 | 1 | <0.001 |
| 65 – 69 | 1.39 (1.30 – 1.49) | <0.001 | 1.19 (1.10 – 1.28) | <0.001 |
| 70 – 74 | 1.76 (1.65 – 1.87) | <0.001 | 1.48 (1.37 – 1.59) | <0.001 |
| More than 74 | 2.70 (2.55 – 2.87) | 2.31 (2.15 – 2.49) | ||
| Race | ||||
| White | 1 | 0.579 | 1 | 0.386 |
| Black | 0.98 (0.93 – 1.04) | <0.001 | 1.03 (0.96 – 1.10) | 0.009 |
| Other | 0.77 (0.67 – 0.88) | 0.82 (0.71 – 0.95) | ||
| Insurance | ||||
| Private | 1 | <0.001 | 1 | <0.001 |
| Government | 1.85 (1.77 – 1.95) | 0.212 | 1.33 (1.26 – 1.42) | 0.526 |
| 1.17 (0.92 – 1.48) | 1.08 (0.84 – 1.39) | |||
| Residential Setting | ||||
| Metro | 1 | <0.001 | 1 | 0.706 |
| Urban | 1.12 (1.07 – 1.19) | 0.005 | 0.99 (0.93 – 1.05) | 0.821 |
| Rural | 1.20 (1.06 – 1.35) | 1.02 (0.89 – 1.16) | ||
| Median Income (residential area) | ||||
| Less than $38,000 | 1 | 0.007 | 1 | 0.098 |
| $38,000 - $47,999 | 0.92 (0.87 – 0.98) | <0.001 | 0.94 (0.88 – 1.01) | 0.024 |
| $48,000 - $62,999 | 0.85 (0.80 – 0.90) | <0.001 | 0.92 (0.85 – 0.99) | <0.001 |
| $63,000 and more | 0.69 (0.65 – 0.73) | 0.80 (0.73 – 0.87) | ||
| Without high school degree (residential area), % | ||||
| Less than 7 | 1 | <0.001 | 1 | 0.092 |
| 7 – 12.9 | 1.16 (1.10 – 1.22) | <0.001 | 1.05 (0.99 – 1.12) | <0.001 |
| 13 – 20.9 | 1.32 (1.25 – 1.39) | <0.001 | 1.15 (1.07 – 1.23) | <0.001 |
| 21 and higher | 1.37 (1.29 – 1.46) | 1.20 (1.10 – 1.32) | ||
| Distance from facility to Residence, Miles | ||||
| Less than 5 | 1 | 0.001 | 1 | 0.087 |
| 5 – 9.9 | 0.91 (0.88 – 0.96) | 0.001 | 0.95 (0.90 – 1.01) | 0.334 |
| 10 – 24.9 | 0.91 (0.87 – 0.96) | 0.013 | 0.97 (0.92 – 1.03) | 0.012 |
| 25 and higher | 0.93 (0.88 – 0.98) | 0.91 (0.85 – 0.98) | ||
| Facility Type | ||||
| Non-academic | 1 | <0.001 | 1 | 0.089 |
| Academic/research | 0.87 (0.83 – 0.91) | 0.96 (0.91 – 1.01) | ||
| Facility Location | ||||
| Northeast | 1 | <0.001 | 1 | 0.289 |
| South | 1.15 (1.09 – 1.21) | <0.001 | 1.03 (0.97 – 1.10) | 0.492 |
| Midwest | 1.11 (1.05 – 1.17) | <0.001 | 1.02 (0.96 – 1.09) | <0.001 |
| West | 0.85 (0.80 – 0.91) | 0.85 (0.79 – 0.91) | ||
| Facility volume, cases | ||||
| Less than 100 | 1 | <0.001 | 1 | 0.079 |
| 101 –– 200 | 0.92 (0.88 – 0.96) | 0.002 | 0.96 (0.91 – 1.01) | 0.025 |
| 201 –– 300 | 0.90 (0.85 – 0.96) | <0.001 | 0.92 (0.86 – 0.99) | 0.061 |
| More than 300 | 0.85 (0.80 – 0.91) | 0.94 (0.87 – 1.00) | ||
| T stage | ||||
| 1 | 1 | 0.605 | 1 | --- |
| 2 | 1.04 (0.90 – 1.20) | 0.105 | 0.99 (0.91 – 1.22) | 0.502 |
| 2A | 1.16 (0.97 – 1.38) | 0.346 | 0.91 (0.95 – 1.38) | 0.151 |
| 2B | 1.07 (0.93 – 1.22) | 1.05 (0.91 – 1.22) | 0.503 | |
| Radiotherapy | ||||
| IMRT | 1 | <0.001 | 1 | <0.001 |
| BT LDR | 0.75 (0.72 – 0.79) | <0.001 | 0.83 (0.79 – 0.88) | <0.001 |
| BT HDR | 0.68 (0.64 – 0.73) | 0.82 (0.77 – 0.88) | ||
| Hormonal Therapy | ||||
| No | 1 | 0.001 | 1 | 0.343 |
| Yes | 1.08 (1.03 – 1.12) | 0.98 (0.94 – 1.02) | ||
| Risk | IMRT | BT LDR | BT HDR | p-value |
| Low | 74.84 | 77.73 | 83.65 | <0.001 |
| Intermediate | 63.37 | 65.68 | 72.11 | <0.001 |
Table 3: Unadjusted and adjusted hazard ratios (HR) for respective univariate and multivariate Cox proportional hazard models of
Survival Outcomes
Trends in survival are presented in Table 4. Median OS was calculated as the number of months from a patient’s diagnosis to last contact or death. Outcomes were distinguishable by both risk category and treatment modality. All data points were found to be significant with p <0.001 (Table 4).
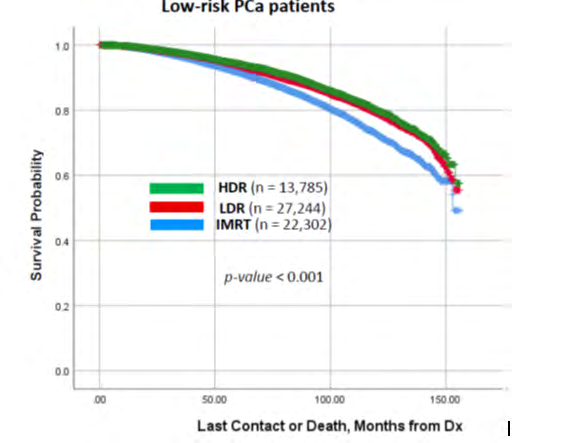
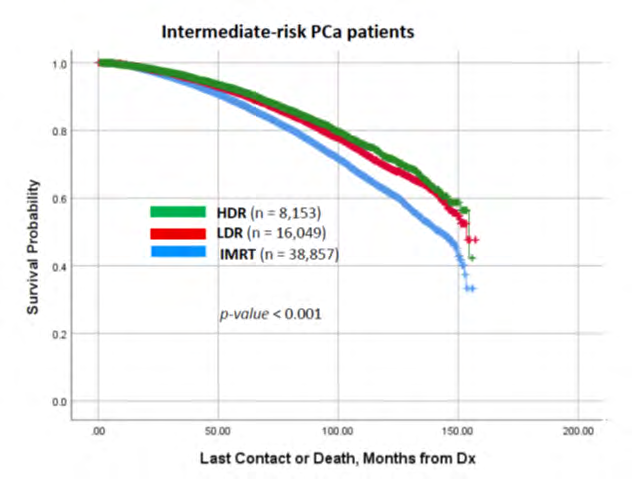
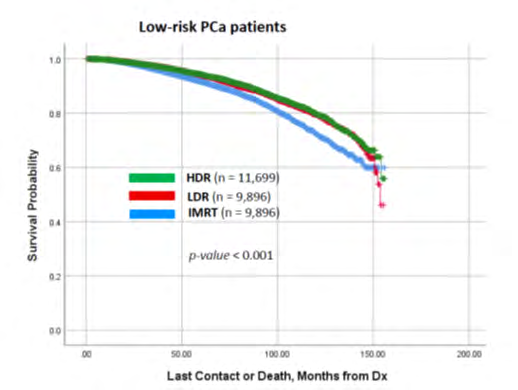
As expected, the low-risk population group exhibited better survival figures than the intermediate-risk group across the respectively matched treatment groups. Appeared that the OS for BT HDR treatment group was slightly better than other two groups (i.e. IMRT and BT LDR). Kaplan-Meier survival curves (Figures 4 and 5), shows better OS achieved by BT over IMRT. As seen in these curves, there is a clear superiority of BT HDR in OS for both low- and intermediate- risk populations. IMRT maintained the relatively lower cumulative survival than BT groups in both risk groups.
Propensity Score Matching
Propensity score matching between IMRT, BT LDR, and BT HDR groups in low- and intermediate-risk patients was performed to address confounding patient demographics, cancer characteristics, and treatment differences between the groups. Variables included in the PSM analysis were age, race, comorbidity, distance from the facility, year of diagnosis, clinical stage of treatment, hormone therapy, number of days from the day of diagnosis to start of treatment, and number of days between start and end of radiation treatment. Patients were then paired 1:1 based on these propensity scores using the “greedy” nearest-neighbor matching algorithm without replacement [21]. Patient order was randomized while drawing matches to prevent a drastically shrunken pool of potential matches for those appearing later in a fixed-order list. Standardized differences were estimated before and after matching to evaluate the balance of covariates, and a match tolerance level of 0.01 was used (i.e., standardized differences < 0.1 indicated balance between the treatment groups). Following 1:1 propensity score-matching, OS between matched IMRT, BT LDR, and BT HDR cohorts was examined by Kaplan-Meier analysis using the Klein-Moeschberger methodology [22]. For the low-risk patient group, the PSM for all patients combined resulted in a cohort consisting of 31,491 patients, well-matched and divided between IMRT, BT LDR, and BT HDR. We followed the same approach for the intermediate-risk patient group, and the PSM cohort consisted of a 21,135-spatients, well- matched and divided between IMRT, BT LDR, and BT HDR.
The post-PSM median OS for these two groups are presented in (Table 5).
| Risk | IMRT | BT LDR | BT HDR | p-value |
|---|---|---|---|---|
| Low | 77.75 | 84.40 | 81.38 | <0.001 |
| Intermediate | 68.11 | 72.61 | 72.05 |
Table 4: Median OS (months) for low- (n=31,491) and intermediate-risk (n=21,135) PCa patients, post-PSM.
There were differences in median OS trends after the PSM analysis. Contrary to the longer median OS of BT HDR previously, median OS after PSM was longest in the BT LDR group in both low- (84.40 months) and intermediate-risk (72.61 months) patients. In the low-risk group, BT LDR had 3.7% higher median OS than BT HDR and 8.6% longer than IMRT. The intermediate-risk group showed BT LDR to have only 0.8% higher median OS than BT HDR but 6.6% higher than IMRT. Consistent with the findings above, post-PSM Kaplan-Meier curves show significant survival differences with matched datasets for both the low-risk patient group (Figure 6) and the intermediate-risk patient group (Figure 7).
Discussion
The increased use of IMRT compared to brachytherapy (LDR and HDR combined) was the first notable observation in this study. Increasing usage of IMRT may reflect a possible treatment preference throughout the US for similar patient population groups. This is in alignment with the report by Mohler J, et al. that IMRT has established itself as the standard radiotherapy treatment for prostate cancer, and its usage accounting for nearly 80% of all radiotherapy modalities [23]. This is an important finding. Prior report by Glazer, et al. [24] looking at NCDB data also showed similar pattern of declined use of brachytherapy in intermediate- and high-risk PCa. The main difference between their study and the current study is that they included both intermediate- and high-risk patients and compared between brachytherapy boost and IMRT dose escalation. Several other reports also commented on this alarming trend in decrease in utilization of brachytherapy altogether [25, 26, 27]. However, it is unclear why the use of IMRT is increasing in the past decade compared to the use of BT. The reasons could be multifactorial including current reimbursement model and decreased availability of a well- trained physician performing brachytherapy treatment. Unfortunately, further exploration in this regard is beyond the scope of this study.
The median OS for all three modalities (IMRT, BT LDR and BT HDR) were comparable, BT appeared slightly better. When the survival points were analyzed by propensity score matching, the same trend continued. We also observed, as shown in Table 2, younger patients with private insurance were more likely to receive BT compared to older patients with government insurance where IMRT was a preferential treatment. This may be to some extent responsible for better OS of patients who had brachytherapy. Interestingly, high volume centers with > 300 patients had more BT treatment compared to centers with <100 patients where IMRT was preferred. The reasons are unknown, but it is possible that younger patients received BT because of the convenience of shorter treatment course versus older people who are considered higher risk for anesthesia required for BT.
Main aims of this study were to 1) investigate the usage rates of IMRT (70-81 Gy), BT LDR, and BT HDR in the treatment of prostate cancer on a national scale, and 2) analyze corresponding baseline characteristics and survival outcomes of each treatment modality. A key focus of this paper was to analyze trends that are representative of low- and intermediate-risk prostate cancer management in the US population. We acknowledge that the quality of our results may not be equivalent to those of a randomized trial due to inherent selection bias with retrospective data, which we attempted to minimize by doing PSM analysis but nonetheless is present. However, this large data set is composed of real- world practices across the country where a majority of patients are treated. Usage of PSM statistical technique with the observational data points in the NCDB database allows us to partially mimic some characteristics of any randomized study. PSM allows for estimation of population- average treatment effects, in contrast to regression-based approaches [28]. The results in this study may aid in general clinical decision-making or adjust the clinical practice for prostate cancer treatment.
We acknowledge that there are several limitations is this study, they include:
- The lack of information/guidelines regarding the choice of treatment in each patient. For example, patients and urologists tend to avoid BT for higher-risk cancers and thus may lead to treatment selection bias. Follow-up therapies after initial treatment were not considered.
- The total patient dataset from 2004-2015 may not be uniform in length of follow-up for each subject, as subjects from earlier timeframes are probable to have longer follow-up periods than those from more recent timeframes. While this did not impact results in our study, analysis of distinct, mature follow-up groups may show more compelling differences in future studies.
- There is potential availability bias as only accredited hospitals input data in the NCDB registry.
- Differences in other important clinical endpoints (quality of life, adverse events, and other toxicities) were not assessed.
- There is missing toxicity-related data. With that being said, survival is the most important outcome with treatment according to the NCCN guidelines [29].
The greatest strength of this study resides with the usage of a nationwide cancer database; it provides a large number of patients that could be representative of actual prostate cancer treatment throughout the US and avoids influences that are typically present in single-institution studies. The database is also homogenous in the stratification of the sample, with objective criteria separating the patients into low- and intermediate-risk groups. Despite these strengths, the presence of numerous limitations means further investigation is warranted.
Conclusion
This large-scale, analysis of the NCDB data showed that a preferential treatment existed for non-surgical, non- chemotherapy, low- and intermediate-risk prostate cancer patients from 2004-2015. There was a trend of increased utilization of IMRT over the years. Increased utilization of IMRT for low-risk patients was more prominent than for intermediate-risk patients. The overall survival in all three modalities were comparable. Randomized trials and longer observation periods of retrospective data would be desirable to confirm these findings.
Acknowledgement
The authors would like to thank the American College of Surgeons (ACS) to provide access to the National Cancer Database (NCDB). The ACS or NCDB is not responsible for any analysis, comments or conclusions in this study.
References
-
American Cancer Society(2021) Cancer Statistics Center.
-
Siegel RL, Miller KD, Jemal A (2019) Cancer statistics 69(1): 7-34.
-
Riihimaki M, Thomsen H, Brandt A, Sundquist J, Hemminki K (2011) What do prostate cancer patients die of?. Oncologist 16(2): 175-181.
-
National Comprehensive Cancer Network (2021) NCCN Guidelines Version 2.2021 Prostate Cancer.
-
Tsubokura T, Yamazaki H, Masui K, Sasaki N, Shimizu D, et al. (2018) Comparison of Image-Guided Intensity-Modulated Radiotherapy and Low-dose Rate Brachytherapy with or without External Beam Radiotherapy in Patients with Localized Prostate Cancer. Sci Rep 8(1): 10538.
-
Wallis CJ, Saskin R, Choo R, Herschorn S, Kodama RT, et al. (2016) Surgery Versus Radiotherapy for Clinically- localized Prostate Cancer: A Systematic Review and Meta-analysis. Eur Urol 70(1): 21-30.
-
Hayashi N, Osaka K, Muraoka K, Hasumi H, Makiyama K, et al. (2020) Outcomes of treatment for localized prostate cancer in a single institution: comparison of radical prostatectomy and radiation therapy by propensity score matching analysis. World J Urol 38(10): 2477-2484.
-
Pollack A, Zagars GK, Starkschall G, Antolak JA, Lee JJ, et al. (2002) Prostate cancer radiation dose response: results of the M. D. Anderson phase III randomized trial. Int J Radiat Oncol Biol Phys 53(5): 1097-1105.
-
Zietman AL, DeSilvio ML, Slater JD, Rossi Jr CJ, Miller DW, et al. (2005) Comparison of conventional-dose vs high-dose conformal radiation therapy in clinically localized adenocarcinoma of the prostate: a randomized controlled trial. JAMA 294(10): 1233-1239.
-
Zietman AL, Bae K, Slater JD, Shipley WU, Efstathiou JA, et al. (2010) Randomized trial comparing conventional- dose with high-dose conformal radiation therapy in early-stage adenocarcinoma of the prostate: long-term results from proton radiation oncology group/american college of radiology 95-09. J Clin Oncol 28(7): 1106- 1111.
-
Alicikus ZA, Yamada Y, Zhang Z, Pei X, Hunt M, et al. (2011) Ten-year outcomes of high-dose, intensity- modulated radiotherapy for localized prostate cancer. Cancer 117(7): 1429-1437.
-
Alitto AR, Tagliaferri L, Lancellotta V, D’Aviero A, Piras A, et al. (2020) BIT-ART: Multicentric Comparison of HDR- brachytherapy, Intensity-modulated Radiotherapy and Tomotherapy for Advanced Radiotherapy in Prostate Cancer. In Vivo 34(3): 1297-1305.
-
Mohler JL, Antonarakis ES, Armstrong AJ, D’Amico AV, Davis BJ, et al. (2019) Prostate Cancer, Version 2.2019, NCCN Clinical Practice Guidelines in Oncology. J Natl Compr Canc Netw 17(5): 479-505.
-
Autorino R, Vicenzi L, Tagliaferri L, Soatti C, Kovacs PG, et al. (2018) A national survey of AIRO (Italian Association of Radiation Oncology) brachytherapy (Interventional Radiotherapy) study group. J Contemp Brachytherapy 10(3): 254-259.
-
King CR, Freeman D, Kaplan I, Fuller D, Bolzicco G, et al. (2013) Stereotactic body radiotherapy for localized prostate cancer: pooled analysis from a multi- institutional consortium of prospective phase II trials. Radiother Oncol 109(2): 217-221.
-
Radiation Therapy Oncology Group (2011) Radiation Therapy in Treating Patients with Prostate Cancer.
-
Wiegel T, Albers P, Bartkowiak D, Bussar MR, Harter M, et al. (2021) Results of a randomized trial of treatment modalities in patients with low or early-intermediate risk prostate cancer (PREFERE trial). J Cancer Res Clin Oncol 147(1): 235-242.
-
Deyo RA, Cherkin DC, Ciol MA (1992) Adapting a clinical comorbidity index for use with ICD-9-CM administrative databases. J Clin Epidemiol 45(6): 613-619.
-
Coca PM (2007) Local and Global Optimal Propensity Score Matching. SAS Global Forum 185: 1-9.
-
Barraclough H, Simms L, Govindan R (2011) Biostatistics Primer: What a Clinician Ought to Know: Hazard Ratios. J Thorac Oncol 6(6): 978-982.
-
Austin PC (2014) A comparison of 12 algorithms for matching on the propensity score. Stat Med 33(6): 1057- 1069.
-
Klein JP, Moeschberger ML (2003) Survival analysis: Techniques for censored and truncated data. In: (2 Edn.). New York: Springer-Verlag, Inc 62: 625-635.
-
Nguyen PL, Gu X, Lipsitz SR, Choueiri TK, Choi WW, et al. (2011) Cost implications of the rapid adoption of newer technologies for treating prostate cancer. J Clin Oncol 29(12): 1517-1524.
-
Glaser SM, Dohopolski MJ, Balasubramani GK, Benoit RM, Smith RP, et al. (2017) Brachytherapy boost for prostate cancer: Trends in care and survival outcomes. Brachytherapy 16: 330-341.
-
Martin JM, Handorf EA, Kutikov A, Uzzo RG, Bekelman JE, et al. (2014) The rise and fall of prostate brachytherapy: Use of brachytherapy for the treatment of localized prostate cancer in the National Cancer Data Base. Cancer 120: 2114-2121.
-
Orio PF, Nguyen PL, Buzurovic I, Cail DW, Chen YW (2016) The decreased use of brachytherapy boost for intermediate and high-risk prostate cancer despite evidence supporting its effectiveness. Brachytherapy 15(6): 701-706.
-
Mahmood U, Pugh T, Frank S, Levy L, Walker G, et al. (2014) Declining use of brachytherapy for the treatment of prostate cancer. Brachytherapy 13(2): 157-162.
-
Austin PC (2011) An Introduction to Propensity Score Methods for Reducing the Effects of Confounding in Observational Studies. Multivariate Behav Res 46(3): 399-424.
-
Ricco A, Hanlon A, Lanciano R (2017) Propensity Score Matched Comparison of Intensity Modulated Radiation Therapy vs Stereotactic Body Radiation Therapy for Localized Prostate Cancer: A Survival Analysis from the National Cancer Database. Front Oncol 7: 185.
- Cancer Diagnosis from RNA Sequence of Blood Cells by Using AI
- Field Cancerization in Oral Cavity, Case Report and Review of Literature. Oncologic Program Salud Integral Hospital, Managua, Nicaragua
- Identification of B Lymphocytes in Cancer Patient’s Blood
- A Case Report of a Breast Cancer Patient Developing Pneumonitis as a Result of Abemaciclib Therapy
- Immune Checkpoint Therapeutics for Today’s Fight and Beyond
- The Amalgamated Sophomore-Gonadoblastoma