Fennel Essential Oil Prevents Cytotoxicity and Genotoxicity Induced by Triflumuron in Two Human Cell Lines
Background: Among insecticides belonging to the insect growth regulators class, we are interested in this present work in the study of Triflumuron (TFM) which is widely used in the protection of crops, human and animal health against diseases caused by certain vector insects. However, the bibliographic data of its toxicity in vitro are almost impossible to find. The increased use of these insecticides has caused severe damage. This prompted us to look for preventive strategies with respect to the toxicity induced by TFM. Objective: Our study aimed to test the effect of an antioxidant substance, the fennel essential oil (FEO) against toxicity induced by TFM using two different cell lines, the human renal embryonic cells (HEK 293) and hepatocytes (Hep G2). Methods and results: According to the MTT assay, and independently of the cell line used, we showed a significant reduction in the cell viability, an increase in reactive oxygen species (ROS) generation, MDA levels and mitochondrial membrane potential in both cell lines after their treatment with TFM. Moreover, we showed an increased in both catalase and superoxide dismutase activities. We demonstrated also, that TFM is an inductor of DNA damages quantified by the comet assay accompanied by apoptosis, highlighted by the evaluation of the expression of pro and anti-apoptotic proteins (Bax and Bcl2). Conclusion: However, the use of FEO reversed completely the cytotoxicity induced by TFM.
Introduction
Pesticides are used to define a range of chemicals used to kill pests in the agricultural sector or other applications such as home maintenance or human medicine. The impact of pesticides on health and environment led to the search for other control measures to protect stored foodstuffs from damage caused by insect pests. Among these products, we were interested on insect growth regulators insecticide’s which disrupts the normal development of insects. They act by inhibiting or blocking the synthesis of chitin, an essential and almost indestructible part of the exoskeleton [1].
Among the insecticides belonging to the class of insect growth regulators, we worked in this present study with Triflumuron (TFM) commonly used in Tunisia and mainly known for its numerous toxic manifestations which could affect public health. TFM is widely used in the protection of crops, human and animal health against diseases caused by certain vector insects [1, 2, 3]. Mechanically, TFM inhibits the synthesis of chitin, which leads to a change in the moult of insects, accompanied by their death [4, 5, 6]. However, the bibliographic data of its toxicity in vitro are almost impossible to find.
In this context, our study aims, in a first part, to reveal the molecular mechanism by which TFM induced its toxic effects in different renal and hepatic human cell lines namely HEK-293 and Hep G2. Thus, the part of oxidative stress in the toxicity induced by TFM, in the two cell lines, was assessed by the determination of cell viability, the generation of reactive oxygen species (ROS), the measurement of MDA levels and the mitochondrial trans membrane potential. The antioxidant system was also evaluated by determining the activities of catalase and superoxide dismutase (SOD). Besides, the study of TFM-induced apoptosis was determined by measuring the expression of pro and anti-apoptotic proteins. The expression of the heat shock protein Hsp70 has been determined. Hsp are markers involved in the early detection of toxic effects [7, 8].
Due to the toxic effects of TFM, we tried to find a way to limit these effects by using antioxidant substances. Among these natural antioxidant molecules, we focused on fennel essential oil (FEO) which is used in many sectors such as the cosmetic industry, pharmaceuticals and perfumes. In addition, this oil is used as an additive in food preparation [9]. Numerous studies showed the important effects of FEO in the treatment of certain human diseases, due to these medicinal activities such as anti-diuretic, anti-inflammatory, analgesic, antioxidant [10], antiseptic, sedative and stimulating [9, 11]. In this context, our work aimed, in a second part, to study the possible preventive effects of FEO against the cytotoxicity and the genotoxicity induced by TFM in both renal and hepatic cell lines.
Material and Methods
Chemicals
Triflumuron (TFM) and Fennel Essential Oil (FEO) were purchased from Sigma-Aldrich (St. Louis, MO, USA). 3-4,5-Dimethylthiazol-2-yl, 2,5- diphenyltetrazolium bromide (MTT), cell culture medium (MEM), foetal calf serum (FCS), phosphate buffer saline (PBS), trypsin-EDTA, penicillin and streptomycin mixture and L-glutamine (200 mM) were from GIBCO-BCL (UK). 2, 7-Dichlorofluoresce diacetate (DCFH-DA) was supplied by Molecular Probes (Cergy Pontoise, France). Low melting point agarose (LMA) and normal melting point agarose (NMA) were purchased from Sigma (St. Louis, MO, USA). Mouse anti-Hsp 70 (SP- 810) was from stressgen (Canada), mouse monoclonal anti- bax and anti-bcl2 were from Invitrogen (Carlsbad, California, USA) and mouse anti -GAPDH (ab983) was from ABCAM. All other chemicals used were of analytical grade. All other chemicals used were of analytical grade.
Cell culture
Hepatic cells (derived from human hepatocellular carcinoma; HepG2), and renal cells (Human Renal Embryonic Cells (HEK 293)) were used in this work. Their culture was performed respectively, in Dulbecco’s modified Eagle’s medium (DMEM) for the liver line and MEM for the kidney line. Then, cells were incubated at 37°C with 5% CO2 for 24 h. In addition both culture media were enriched with 10% FBS, 1% L-glutamine (200 mM), 1% of mixture penicillin (100 IU / mL) and streptomycin (100 mg / mL).
Cell toxicity assay (MTT assay)
The MTT test is a cell viability test based on measuring the activity of the mitochondrial enzyme, succinate dehydrogenase. In living cells, this enzyme converts succinate into fumarate. This oxidation reaction can be coupled with a reduction of MTT (yellow) to formazan (blue-violet). The intensity of the color is assessed by spectrophotometry at 570 nm and is proportional to the activity of succinate dehydrogenase, which is itself proportional to cell viability [12].
Cells are seeded in multi-well plates (96 wells; 27.104 cells / well) in a volume of 200 μL of medium and incubated at 37°C. 24 h later, the medium is renewed and cells in the exponential growth phase are treated with TFM alone or combined with FEO (100, 150 and 200 μM) in a volume not exceeding 1% of the volume of the total cellular medium. Cells are incubated for 24 h at 37°C, in an atmosphere containing 5% CO2. The medium is then removed and cells were rinsed 3 times with PBS and then incubated in the presence of a solution of MTT (5 mg / mL) diluted 1/10 in medium at a rate of 200 μL / well for 4 h at 37°C. The MTT solution is removed and the insoluble formazan crystals formed are dissolved in DMSO. The absorbance is finally measured at 540 nm. The percentage of cell viability is determined relative to the untreated cells representing 100% viability. The inhibitory concentration of 50% of the cells for each molecule used is determined from the curve representing the percentages of cell viability as a function of the concentrations of agents.
Oxidative Stress Status
• Reactive oxygen species determination 2 “, 7” dichlorodihydrofluorescein diacetate (DCFH-DA)
is a fluorochrome that in living cells, it will be deacetylated by cellular esterases to a non-fluorescent compound, DCFH. The latter, will be oxidized, in the presence of ROS, to a fluorescent compound: DCF [13, 14, 15]. The dosage of free radicals is determined following the inoculation of cells in multi-well plates (96 wells) at the rate of 2.10$^4$ cells / well. After 24 h, cells are incubated for 30 min with 20 $\mu$M of DCFH-DA and are then treated with the various substances (FEO, TFM) for 24 h. H$_2$O$_2$ (20 $\mu$M) is used as a positive control. Fluorescence is measured by a fluorimeter (Biotek FL x 800) with an excitation wavelength of 485 nm and an emission wavelength of 530 nm.
Protein extraction
Hep G2 and HEK-293 cells are seeded in 6-well plates at a rate of 10$^6$ cells / well. After 24 h of incubation, cells treated with the different concentrations of the studied molecules are recovered by trypsinization and centrifugation. Cell pellet is suspended in 100 $\mu$l of lysis buffer (0.5M HEPES; 1M Mgcl$_2$; 1M KCl; 80% glycerol; NP40 (Nonidet P40) 80%; PMSF 20 mg / mL, Aprotinin 5 mg / mL; Leupeptin 5 mg / mL; DTT (Dithiothreitol) 1M) then incubated for 2 h at 4°C, then centrifuged again at 12000 rpm for 30 min at 4°C. The supernatant which constitutes the protein fraction and the protein concentration was determined using the Bradford method [16].
Lipid peroxidation
To determine lipid peroxidation in cell extracts, we monitored the measurement of MDA level. Indeed, the spectrophotometric assay of MDA is conducted out according to the method described by Ohkawa, et al. [17]. Hepatic and renal cells are seeded at a rate of 10$^6$ cells / 2 ml of complete medium in 6-well plates and incubated for 24 h. Then cells are treated with TFM and FEO at the concentrations already mentioned, for 24 h in a humidified atmosphere (5% CO$_2$ - 95% air). After incubation, the medium is removed, the cell layer is rinsed twice with 500 $\mu$l of PBS, cells detached from their support by trypsination, are recovered. Thus, cell extracts are taken up in 200 $\mu$L KCl (1.15% at 0°C) to which are added 200 $\mu$L SDS (8.1%), 1.5 mL acetic acid (20%), 1.5 mL thiobarbituric acid (0.8%). The samples are heated at 95°C for 120 min then cooled to room temperature. 5 mL of a mixture of n-butanol + pyridine (15:1 v / v) are added to each sample. After vigorous stirring and centrifugation at 1800 rpm / 10 min, the supernatant is isolated and the DO is taken at 546 nm. Finally, MDA production is expressed as $\mu$mol MDA / mg of proteins.
Protein extraction and Hsp 70 expression determination
Lysate containing 20 $\mu$g of proteins was subjected to 10% SDS–polyacrylamide gel electrophoresis. Separated proteins were transferred onto 0.45 $\mu$m nitrocellulose membrane in transfer buffer (10 mM Tris-base, pH 8.3, 96 mM glycine and 10% methanol). After having been blocked with 5% BSA, the membrane was incubated with Hsp70 antibody for 4 h (1:1000 dilutions). Subsequently, the membrane was washed twice more and incubated with the appropriate secondary antibody for 2 h. Next, the membrane was washed and the chromogenic substrate BCIP/NBT was added to localize antibody binding. Protein levels were then determined by computer-assisted densitometric analysis (Densitometer, GS-800, BioRad Quantity One).
Antioxidant Enzymes Determination
Measurement of catalase (CAT) activity
Catalases are enzymes involved in the cell's defense against oxidative stress by eliminating oxygen species (H$_2$O$_2$). According to the technique described by Aebi [18], in a quartz tank, we introduced in order: 780 $\mu$L of phosphate buffer (100 mM; pH 7.4), 200 $\mu$L of hydrogen peroxide (H$_2$O$_2$; 50 mM) and 20 $\mu$L of cell extract. The measurement is made at 240 nm at a time t = 0s and t = 60s, and the Catalase activity was calculated using the molar extinction coefficient (0.04 mM$^{-1}$ cm$^{-1}$). Results were expressed as mmol / min / mg protein.
Measurement of superoxide dismutase (SOD) activity
SOD is an enzyme that eliminates superoxide anion, the first toxic species formed from oxygen. The activity of this enzyme is assayed according to the method described by Marklund and Marklund [19]. The method is based on the auto-oxidation and illumination of pyrogallol at 440 nm for 3 min. One unit of SOD activity was calculated as the amount of protein that caused 50% pyrogallol auto-oxidation inhibition. The SOD activity is expressed as U / mg protein.
Apoptosis Analysis
Mitochondrial membrane potential (MMP) assay
The measurement of the potential membrane allowed the evaluation of the mitochondrial apoptotic pathway in cells by a toxic substance. Several membrane-permeable lipophilic cations can accumulate in the mitochondria of eukaryotic cells in response to the mitochondrial membrane electrical potential [20]. These cations are widely used to study the fall in mitochondrial membrane potential [21]. Among these probes, we find Rhodamine 123 (Rh-123), which exhibits fluorescence following its distribution in energized systems, the rate of decrease of this fluorescence proves to be proportional to the drop in the mitochondrial membrane potential [20, 22].
Thus, cells are seeded at a rate of 27.104 cells / well in multi-well plates (96 wells). After 24 h, cells are pretreated for 2 h with the FEO in the presence or absence of TFM under the different treatment conditions for each cell line. Then, the medium is removed and the cells are incubated for 30 min with 5 μM of Rhodamine 123. Cells are rinsed and re- incubated with PBS for 15 min. The fluorescence is finally measured using a fluorimeter (Biotek FLx800) with an excitation wavelength of 485 nm and an emission wavelength of 530 nm. The decrease in fluorescence intensity reflects the decreased retention of Rh-123 and therefore the drop in mitochondrial potential.
• DNA damage assessed by the comet assay The Comet test was firstly, described by Ostling and Johanson [23]. Cells fixed in agarose, placed on microscope slides then lysed, release DNA which is electrophoresed in an electric field. DNA with single or double stranded breaks will migrate further towards the anode and show under a fluorescent microscope a DNA streak that forms the tail adjacent to the intact DNA that remains at the head of the comet. To do this, 6-well plates are used to inoculate 7.5 × 10 5 cells / well. Then, the cells are treated with the different concentrations of TFM and FEO for 24 hours. Approximately 2 × 10⁴ cells were then recovered and mixed with 1% low melting dot agarose (LMP) in PBS and a microscope slide spread previously covered with a 1% normal melting agarose (NMP) in PBS layer.
After agarose solidification, cells were treated with an alkaline lysis buffer (2.5M NaCl, 0.1M EDTA, 10Mm Tris, pH 10, 1% (v/v) Triton X-100 and 10% (v/v) DMSO) for 1 h at 4°C, then the DNA was allowed to unwind for 40 min in the electrophoresis buffer (0.3M NaOH, 1mM EDTA, pH > 13). The slides were then subjected to electrophoresis in the same buffer for 30 min at 25 V and 300 mA. Slides were then neutralized using a Tris buffer solution (0.4MTris, pH 7.5) for 15 min. After staining the slides with ethidium bromide (20 μg/mL), the comets were detected and scored using a fluorescence microscope. The experiment was done in triplicate. The damage is represented by an increase of DNA fragments that have migrated out of the cell nucleus during electrophoresis and formed an image of a “comet” tail. A total of 100 comets on each slide were visually scored according to the intensity of fluorescence in the tail and classified by one of five classes as described by Collins, et al. [24]. The total score was evaluated according to the following equation: (% of cells in class 0 × 0) + (% of cells in class 1 × 1) + (% of cells in class 2 × 2) + (% of cells in class 3 × 3) + (% of cells in class
4 × 4). • Determination of Bax and Bcl2 Status To determine the expression levels of these two proteins, cell extracts treated with TFM alone or combined with FEO were migrated on an SDS polyacrylamide gel. A transfer step on a nitrocellulose membrane was performed before incubating with BSA. Then, the membrane was incubated with primary antibody for 4 h at the following dilutions: Bcl2 and Bax (1:1000 dilutions). Then we washed the membrane for 2h with the appropriate secondary antibody. Next, we washed the membrane and we add the chromogenic substrate BCIP/NBT in order to localize antibody binding. Finally, we used computer-assisted densitometric analysis (Densitometer, GS-800, BioRad Quantity One) to determine Protein levels.
Statistical Analysis
Each experiment was done three times separately and data were expressed as the mean ± SD of the means. One- way ANOVA was used to assess differences among the groups followed by Dennett’s post hoc test. When two groups were compared, differences were assessed by Student’s t test. Differences were considered significant at P<0.05.
Results
Effect of FEO on cell viability
The exposure of HEK-293 and Hep G2 cells to increasing concentrations of TFM ranging from 100 µM to 500 µM for 24 h showed a clear decrease in the percentage of cell viability in both used cells. Indeed, the IC 50 found is 200 and 120 μM respectively for HEK-293 and Hep G2 cells (Figure1A). In order to determine the adequate concentrations of fennel essential oil (FEO) presenting the best preventive effects against TFM toxicity, HEK-293 and Hep G2 cells were treated with different FEO concentrations (50 - 500 µM). Our results showed that in the presence of 300 µM of FEO, cells remained alive (Figure 1B). Thus, for the rest of this study, we have chosen to work with 100, 150 and 200 μM where the percentages of cell viabilities obtained are similar to the values found for untreated cells.
The pretreatment of 2 of HEK-293 and Hep G2 cells with 100, 150 and 200 μM of FEO before their exposure to the IC 50 found for each cell type for 24, decreased, significantly, the cytotoxicity induced by TFM of a dose dependent-manner (Figure 1C).
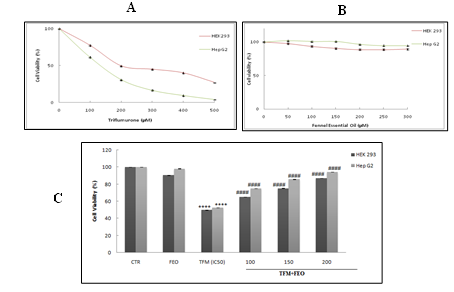
Figure 1: Percentage of cell viability after treatment of HEK-293 and Hep G2 cells with Triflumuron (TFM) alone (A), Fennel Essential Oil alone (FEO) (B) and their combinations (C) determined by the MTT test. Data are expressed as mean ± standard deviation of independent experiences. Data are expressed as mean ± standard deviation of independent experiences (n = 6). *** p <0.001 are significantly different from the control; (##) and (####) significant difference compared to cell treated with Triflumuron alone.
Effect of FEO on TFM- induced ROS production
Figure 2 showed the FEO inhibitory effect on TFM- induced ROS generation in renal and hepatic cells. The level of ROS produced by the different cells in the presence or absence of TFM and FEO was measured using the DCFH-DA method. Indeed, in the presence of H2O2 in the intracellular medium, DCFH was oxidized to DCF by intracellular esterases.
Our results indicated that the level of ROS increased in cells treated with the IC50 of TFM (200 and 120 µM respectively for HEK-293 and Hep G2). The 2 h pretreatment with the different concentrations of FEO (100, 150 and 200 µM) showed that the intracellular ROS produced in the presence of TFM was completely suppressed. Indeed, with the highest concentration of FEO, we observed that the level of ROS generation was similar to that found in untreated cells.
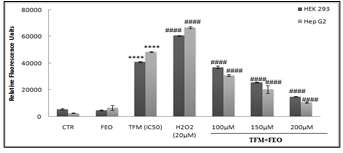
Figure 2: Modification of the oxidative status in the presence of TFM and FEO taken separately and / or in combination after 24 hours. Data are expressed as an average ± standard deviation of independent experiences. **** p <0.0001 are significantly different from the control; (####) significant difference compared to cell treated with Triflumuron alone.
Effect of FEO on MDA production
To determine lipid peroxidation, we measured the level of MDA, which is an ultimate fragment of the degradation of membrane lipids in HEK-293 and Hep G2 cells. The effect of FEO on the lipid membrane oxidation of hepatic and renal cells after 24 h of exposure to TFM was presented in Figure 3. Indeed, we noted that the intoxication of different cells by IC50 of TFM induced a significant increase in the level of MDA. Pretreatment of cells with the FEO, 2 h before their exposure to TFM caused a decrease in the MDA level which drops by 2.66 times compared to cells treated with TFM alone for Hep G2 cells.
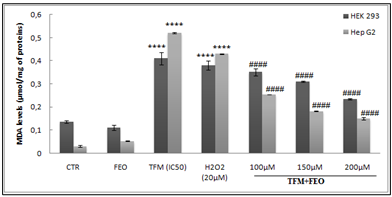
Figure 3: Effect of FEO on MDA production in HEK-293 and Hep G2 cells after their exposure to TFM and FEO at different concentrations. Data are expressed as an average ± standard deviation of three independent experiments. The values are significantly different (p <0.05) compared to the control. **** p <0.0001, statistically significant compared to the control group. (####) p <0.0001 significantly different compared to cells treated with Triflumuron alone.
Effect of FEO on TFM-antioxidant enzymes activities alteration
The change in the levels of antioxidant enzymes can be considered a marker of oxidative stress. Indeed, in the event of stress, SOD catalyzes the dismutation of the superoxide anion into H2O2, which can then be decomposed into water and oxygen by the CAT or by the Gpx. The enzymatic activities of CAT and SOD were determined in both renal and hepatic cell lines in the presence of TFM (400, 200 and 120 µM) and FEO at 100, 150 and 200 µM (Figures 4A & B). Thus, we showed a marked increase in the activity of these two enzymes in cells treated with the IC 50 of TFM. On the other hand, the 2 h- pre-treatment of cells with FEO at different concentrations restored, in a dependent concentration manner, the activities of CAT and SOD at their basal level, particularly with the highest concentration of FEO.
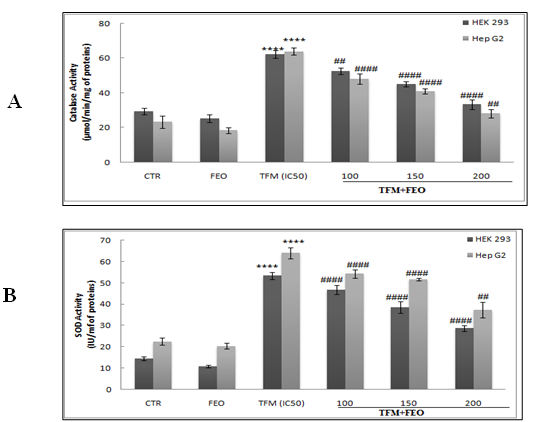
Figure 4: Effects of FEO on the enzymatic activities of CAT (A) and SOD (B) in hepatic and renal cells after their exposure to TFM and FEO. Data are expressed as an average ± standard deviation of three independent experiments. The values are significantly different (p <0.05) compared to the control. **** p <0.0001, statistically significant compared to the control group. (##) <0.01 significantly different from the control; (####) p <0.0001 significantly different compared to cells treated with Triflumuron alone.
Effect of FEO on HSP 70 expression
Figure 5 (A & B) presented the result of the effect of FEO on the expression of heat shock proteins in liver and kidney cells. After the exposure of the two cell lines to FEO alone, TFM alone (at the value of the IC 50 for each cell type) and the combination TFM and FEO for 24 h, we observed an induction of the expression of Hsp 70, whatever the cell line considered. Compared with untreated cells, the expression of Hsp 70 was found to be higher in hepatocytes (Figure 5A) than in renal cells (Figure 5B). The pretreatment of cells with FEO improved the level of Hsp 70 expression.
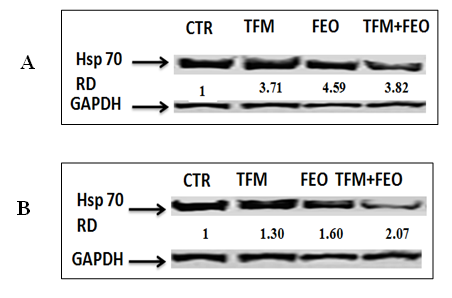
Figure 5: Effects of FEO on TFM-induced genotoxicity in HEK-293 and Hep G2 cells. Data are expressed as an average ± standard deviation of three independent experiments. The values are significantly different (p <0.05) compared to the control. **** p <0.0001, statistically significant compared to the control group. (##) <0.01 significantly different from the control; (####) p <0.0001 significantly different compared to cells treated with Triflumuron alone (A). Different classes of DNA damages quantified by the comets test and visualized using fluorescent microscope. Then cell were photographed using a digital camera (original magnification ×200) (B).
Effect of FEO on TFM Induced Apoptosis
Effect of FEO on Mitochondrial Transmembrane Potential
To evaluate the effect of FEO on the mitochondrial alterations induced by TFM, we incubated the HEK-293 and Hep G2 cells with Rhodamine 123 (Rh123). The results of this test showed a significant decrease in Rh123 in cells treated with TFM alone, thus indicating that cells lost their mitochondrial potential. The use of different concentrations of the FEO showed a remarkable restoration of the percentage of absorption of Rh123. Our results demonstrated the protective effect of FEO against mitochondrial alterations caused by TFM (Figure 6).
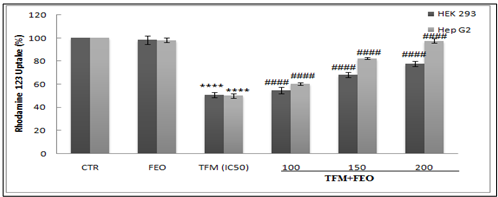
Figure 6: Preventive effects of FEO against transmembrane potential (ΔΨm) alteration induced by TFM in both renal and hepatic cells. Data are expressed as an average ± standard deviation of three independent experiments. The values are significantly different (p <0.05) compared to the control. **** p <0.0001, statistically significant compared to the control group. (####) p <0.0001 significantly different compared to cells treated with Triflumuron alone.
Effect of FEO on TFM induced-DNA damages
The genotoxic action of TFM was quantified by the comet test (Figures 7A & B). Our results indicated that cell treatments with IC50 increased DNA fragmentation. However, this fragmentation was weakened by almost 3 times when cells were pretreated with FEO at 200 µM. Through these investigations, we can confirm the anti-genotoxic effect of FEO. Moreover, these damages are classified in 5 classes from 0 to 4 (Figures 7A & B).
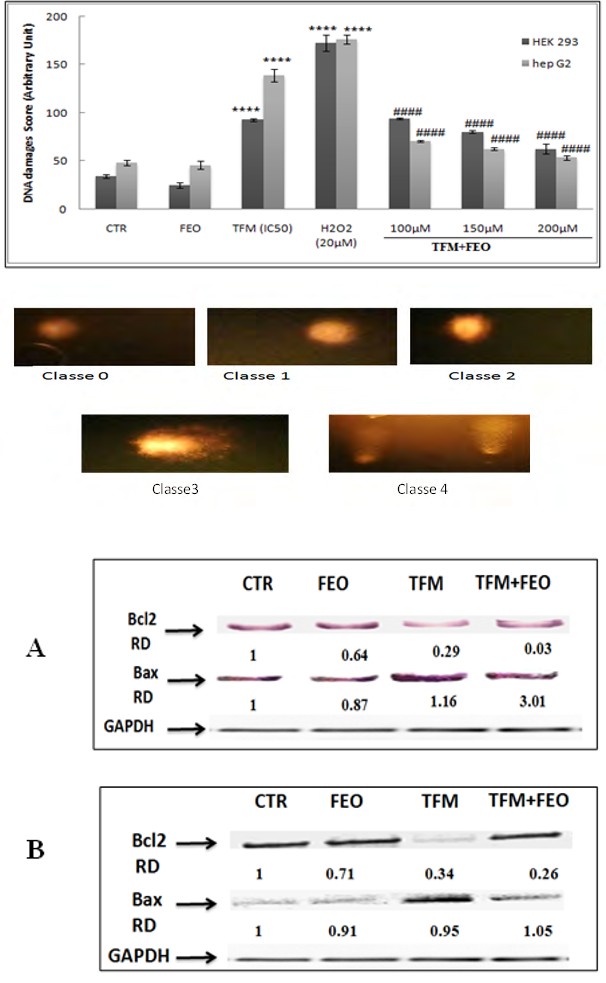
Figure 7A & B: Immunochemical detection of Hsp 70 after exposure of Hep G 2 (A) and HEK-293 (B) cells to FEO (200 µM), TFM (IC 50 value for each line) and to the combination FEO + TFM.
Effect of FEO on TFM induced apoptotic cell death
The evaluation of FEO effect on pro- and anti-apoptotic proteins expression, in response to the exposure of Hep G2 and HEK-293 cells to TFM only, FEO alone or TFM with FEO is illustrated in Figure 8 (A and B). Our results showed that TFM increased the levels of Bax expression and decreased the amount of Bcl-2 in the two cell lines used. However, a clear restoration in Bax and Bcl-2 expression levels was observed when cells are pretreated with FEO.
Discussion
Triflumurone (TFM), a benzoylurea insecticide belonging to the class of insect growth regulators, acts by inhibiting the synthesis of chitin; the main constituent of the insect’s cuticle, consequently causing its death [6]. However, studies revealing the toxic effects of TFM in vivo and in vitro remain rare. In this context, we studied the mechanisms by which this insecticide induces its toxic effects renal (HEK-293) and hepatic (Hep G2) cells in culture.
Thus, treating cells with increasing concentrations of TFM (ranging from 50 to 500 µM) significantly reduced cell viability using the MTT test. In our experimental conditions, the IC 50 found for HEK-293 and Hep G2 cells were approximately 200 and 120 µM, respectively.
On the other hand, tests showing the oxidative status alteration were carried out. It was noted that this alteration disrupts functions and cell integrity by the accumulation of oxygen-reactive species (ROS) which can oxidize membrane lipids, proteins and DNA leading to apoptosis [25]. Several studies showed the involvement of oxidative stress in the toxicity induced by pesticides via the overproduction of free radicals that affected membrane lipids [26, 27]. Thus, in the current study, we noted an increase in MDA production rate in both renal and hepatic cell lines, which confirm the implication of oxidative stress in the toxicity induced by TFM. Our results are in coincidence with those of Ilboudou and his team [28] which showed that diflubenzuron (DFM) increased lipoperoxidation, as well as antioxidant enzymes activities (SOD and CAT) in Caco2 cells. Similarly, the study carried out by Deivanayagam, et al. [29] on an animal model (mouse) poisoned by lufenuron generated an overproduction of MDA accompanied by an alteration of the antioxidant enzyme system.
The alteration of the enzymatic and non-enzymatic cell defense system was carried out by measuring some antioxidant activities such as catalase (CAT) and superoxide dismutase (SOD). SOD, following stress, represents the first defense line and it catalyzes the disproportionation of superoxide radicals into oxygen and peroxide hydrogen which will be neutralized under the action of CAT [30]. Thus, we confirm the cytotoxicity of TFM by increasing ROS production causing a change in the normal levels of CAT and SOD. Our results are in agreement with results of Huang, et al. [31], which indicated the cytotoxicity of chlorfluazuron, a benzoylurea-based insecticide, in human renal (HEK-293) and hepatic (HepG2) cells. Moreover, Diflubenzuron (DFM), another benzoylureazed insecticide decreased cell viability in CHOK1 cells [32] and HepG2 cells) [33]. In the same context, Perecco, et al. [34] showed the cytotoxicity of DFM in BALBC 3T3 leading to cell transformation.
We also highlighted the decrease in cell viability accompanied by the reduction in the mitochondrial transmembrane potential which is at the origin of mitochondrial membrane depolarization. This depolarization is seen as the step of the non-return of the molecular cascade leading to cellular apoptosis. Knowing that any oxidative stress can induce genotoxicity by interacting with nuclear DNA and can lead to mutagenic and even carcinogenic effects. This is the reason why we have tried to quantify the DNA damage caused by TFM through the comet test. Our results confirmed the oxidative damage of this compound, at the DNA level, in the three cell models studied. In addition, this oxidative damage was accompanied by apoptosis detected by determining the level of expression of pro and anti-apoptotic proteins using the Western blot. Indeed, the apoptotic pathway is triggered by the release of cytochrome C and the activation of caspases [35, 36]. Therefore, we will suggest that TFM is an activator of the intrinsic (mitochondrial) pathway of apoptosis. Thus, to confirm this hypothesis, we tried to determine the levels of expression of the pro-apoptotic (Bax) and anti-apoptotic (Bcl-2) proteins in extracts of hepatic and renal cells.
Proteins of the Bcl-2 family modulate apoptosis by regulating its mitochondrial pathway [37]. Bax is one of the promoters of apoptosis [37], while Bcl-2 is a major inhibitor of cell death [38, 39, 40]. The correct balance of pro- and anti- apoptotic proteins can determine whether or not apoptosis is triggered [41]. To confirm our hypothesis, we sought the induction of heat shock proteins (Hsp) since several studies have shown that they are antioxidant and therefore anti-apoptotic [42, 43, 44]. Thus, our data demonstrated that TFM-induced cell apoptosis was revealed by an increase in the level of Bax and by a decrease in the expression of Bcl- 2. Subsequently, the relationship between Bax and Bcl-2 determines the induction or inhibition of apoptosis [45, 46].
Our results are in agreement with those of Xu, et al. [47] who indicated that Tebufénozide (TBF), an insecticide belonging to the same family as TFM, widely used in agriculture, induced apoptosis evidenced by the increase in the level of Bax and the decrease in Bcl-2 level. Another in vitro study carried out on chlorofluazuron, a benzoylurea- based insecticide, showed its cytotoxic power in Hep G2 and HEK-293 cells by inhibiting cell viability and causing the cell cycle to stop [31].
Due to the toxic effects of TFM found in HEK-293 and Hep G2 cells, we tried to look for a natural molecule able to reduce and prevent the toxicity induced by TFM. Thus, we focused our interest on fennel essential oil (FEO), characterized by its antioxidant, antifungal and antibacterial properties [48]. In this context, we studied the protective effects of fennel essential oil (FEO) against the cytotoxicity and genotoxicity induced by our insecticide: Triflumurone (TFM), in both renal and hepatic cultured cells.
We found that FEO reduced cell death caused by TFM in the studied cells. In addition, MDA levels and ROS generation were modulated using increased FEO concentrations. The use of FEO, a plant rich in antioxidants against the toxic effects caused by xenobiotics using in vivo and in vitro models, was established [48]. In our work, we have proved that the pretreatment of HEK-293 and Hep G 2 cells with different concentrations of FEO (100, 150 and 200 µM) protected cells against oxidative stress and genotoxicity induced by TFM. In this case, after treating cells with TFM only, we found a decrease in the activity of catalase and SOD. In the presence of fennel essential oil, the activities of these two enzymes were restored to their normal levels. In addition, by combining FEO (100, 150 and 200 µM) with TFM, we found a reduction in mitochondrial transmembrane potential as well as repair of DNA damage induced by TFM. On the other hand, FEO protected neuronal cells (WG1-7) against toxicity induced by hydrogen peroxide (Mizuno et al., 2015). Preventive effects of FEO in vivo were also elucidated. Indeed, its anti cytotoxic and anti genotoxic against cyclophosphamide in mice has been demonstrated. The re-establishment of CAT, SOD, GSH activities and MDA level to their baseline level was noted [49]. Likewise, Alamoudi et al. (2017) [48] reported the ability of FEO to suppress toxic effects in albino rats treated with sodium valproate, an anticonvulsant and mood stabilizer drug.
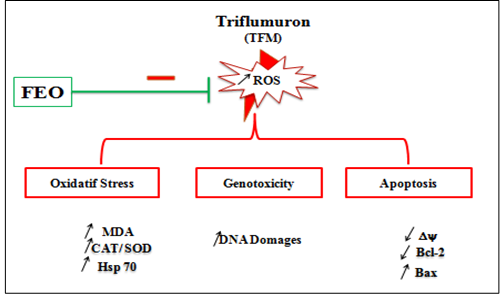
In this context, we showed previously that, on human intestinal cells (HCT116), the FEO prevents cytoxicity and genotoxicity caused by TFM [50]. According to bibliographic data, fennel extracts contain several polyphenolic compounds [51], characterized by their antioxidant properties [52, 53]. These antioxidant activities are involved in the adsorption and neutralization of free radicals, the deactivation of singlet and triplet oxygen or the decomposition of peroxides [54, 55]. In conclusion, regardless of the cell line used, TFM is found to be highly toxic. This toxicity passes essentially via an oxidizing stress causing cytotoxic and genotoxic damage. Indeed, cytotoxicity has been elucidated by the dose-dependent decrease in cell viability, the production of MDA, the induction of Hsp 70 and the disruption of the antioxidant enzymatic cell defense system. Genotoxicity was demonstrated by the fall in mitochondrial transmembrane potential, the disturbance of the Bax / Bcl-2 balance and finally the DNA fragmentation leading to mitochondrial apoptosis.
In addition, we found that liver cells were the most sensitive to exposure to TFM. Therefore, the liver seems to be the target and privileged organ of TFM compared to the kidney. Fennel essential oil reversed completely the toxicity induced by TFM (Figure 9).
Ethical Approval
Animal handling and all experimental design were approved according to the National Institute of Health Guidelines for Animal Care and approved by the local Ethics Committee.
Informed Consent
Not applicable
Author Contributions
Rim Timoumi, Ines Amara and Salwa Abid designed the experiement, Rim Timoumi, Intidhar Ben Salem, Emna Annabi, Ghada Souid, Emna Elgolli Bennour, Chiraz Zaied performed the experiment, Rim TIMOUMI, Ines AMARA, Intidhar Ben Salem and Emna Elgolli Bennour analyzed the data, Rim Timoumi and Ines Amara wrote the manuscript, Salwa Abid Essefi revised the manuscript and all authors read and approved the final manuscript.
Funding
The authors did not receive support from any organization for the submitted work.
Competing Interests
The authors have no relevant financial or non-financial interests to disclose.
Availability of data and materials
The data that support the findings of this study are available from the corresponding author upon request.
Acknowledgement
This study was supported by “Le Ministère Tunisien de l’Enseignement Supérieur et de la Recherche Scientifique”.
References
-
Lowden S, Gray S, Dawson K (2007) Treatment of natural infestations of the biting louse (Werneckiellaequi) on horses using triflumuron, a benzoylurea derivative insect growth regulator. Vet Parasitol 148(3-4): 295-300.
-
Konradsen F (2007) Acute pesticide poisoning--a global public health problem. Dan Med Bull 54(1): 58-59.
-
Alavanja MC (2009) Introduction: pesticides use and exposure extensive worldwide. Rev Environ Health 24(4): 303-309.
-
Vasuki V (1992a) Adult longevity of certain mosquito species after larval and pupal exposure to sublethal concentration of an insect growth regulator hexaflumuron. Southeast Asian J Trop Med Public Health 23(1): 121-124.
-
Vasuki V (1992b) The effects of sublethal doses of hexaflumuron on the feeding behavior of mosquitoes (Diptera: Culicidae). Bull Entomol Res 82: 535-538
-
Wilson TG, Cryan JR (1997) Lufenuron, a chitin-synthesis inhibitor, interrupts development of Drosophila melanogaster. J Exp Zool 278(1): 37-44.
-
Carnevali O, Maradonna F (2003) Exposure to xenobiotic compounds: looking for new biomarkers. Gen Comp Endocrinol 131(3): 203-209.
-
El Golli E, Hassen W, Bouslimi A, Bouaziz C, Ladjimi MM, et al. (2006) Induction of Hsp 70 in Vero cells in response to mycotoxins Cytoprotection by sub-lethal heat shock and by Vitamin E. Toxicol Let 166(2): 122-130.
-
Tinoco MT, Martins MR, Cruz-Morais J (2007) Antimicrobial activity of Foenicu-lumvulgare Miller essential oil. Rev Ciências Agrárias 30: 448-454.
-
Gross M, Friedman J, Dudai N, Larkov O, Cohen Y, et al. (2002) Biosynthesis of estragole and trans- anethole in bit-ter fennel (Foeniculumvulgare Mill. var. vulgare) chemotypes. Changes inSAM: phenylpropene O-methyltransferase activities during development. Plant Sci 162: 1047-1053.
-
He WP, Huang BK (2011) A reviews of chemistry and bioactivities of a medicinalspice: Foeniculumvulgare. J Med Plants Res 5: 3595-3600.
-
Mosman T (1983) Rapid colorimetric assay for cellular growth and survival. Application to proliferation and cytotoxicity assays. J Immunol Meth 65(1-2): 55-63.
-
Cathcart R, Schwiers E, Ames BN (1983) Detection of picomole levels of hydroperoxides using a fluorescent dichlorofluorescein assay. Anal Biochem 134(1): 111- 116.
-
Le Bel CP, Ischiropoulos H, Bondy SC (1992) Evaluation of the probe 2-,7- dichlorofluorescein as an indicator of reactive oxygen species formation and oxidative stress. Chem Res Toxicol 5(2): 227-231.
-
Chen T, Wong YS (2009) Selenocystine induces caspase- independent apoptosis in MCF-7 human breast carcinoma cells with involvement of p53 phosphorylation and reactive oxygen species generation. Int J Biochem Cell Biol 41(3): 666-676.
-
Bradford M (1979) A rapid and sensitive method for the quantification of microgram quantities of protein utilizing the principle of protein dye binding. Anal Biochem 72: 248-254.
-
Ohkawa H, Ohishi N, Yagi K (1979) Assay of lipid peroxides in animal tissues by thiobarbituric acid reaction. Anal Biochem 95(2): 351-358.
-
Aebi A (1984) Catalase in vitro. Methods Enzymol 105: 121-126.
-
Markland S, Marklund G (1974) Involvement of the superoxide anion radical in the autoxidation of pyrogallol and a convenient assay for superoxide dismutase. Eur J Biochem 47(3): 469-474.
-
Baracca AL, Sgarbi G, Solaini G, Lenaz G (2003) Rhodamine 123 as a probe of mitochondrial membrane potential: evaluation of proton flux through F (0) during ATP synthesis. Biochim Biophys Acta 1606 (1-3): 137- 146.
-
Johnson RJ, Sautin YY, Oliver WJ, Roncal C, Wei M, et al. (2009) Lessons from comparative physiology: could uric acid represent a physiologic alarm signal gone awry in western society? J Comp Physiol B 179 (1): 67-76.
-
Debbasch C, Brignole F, Pisella PJ, Warnet JM, Rat P, et al. (2001) Quaternary ammoniums and other preservatives’ contribution in oxidative stress and apoptosis on Chang conjunctival cells. Invest Ophthalmol Vis Sci 42(3): 642- 652.
-
Ostling O, Johanson KJ (1984) Microelectrophorec study of radiation-induced DNA damages in individual mammalian cells. Biochem Biophys Res Commun 123(1): 291-298.
-
Collins AR, Dusinska, Gedik CM, Stetina R (1996) Oxidative damage to DNA: dowe have a reliable biomarker? Environ Health Perspect 104(Suppl 3): 465- 469.
-
Battisti C, Formichi P, Radi E, Federico A (2008) Oxidative-stress-induced apoptosis in PBLs of two patients with Parkinson disease secondary to alpha- synuclein mutation. J Neurol Sci 267(1-2): 120-124.
-
Astiz M, Arnal N, de Alaniz MJT, Marra CA (2011) Occupational exposure characterization in professional sprayers: clinical utility of oxidative stress biomarkers. Environ Toxicol Pharmacol 32(2): 249-258.
-
Abdollahi M, Karami-Mohajeri S (2012) A comprehensive review on experimental and clinical findings in intermediate syndrome caused by organophosphate poisoning. Toxicol Appl Pharmacol 258(3): 309-314.
-
Ilboudo S, Edwin F, Virginie R, Toe AM, Gamet-Payrastre L, et al. (2014) _In vitro_ impact of five pesticides alone or in combination on human intestinal cell line Caco-2. Toxicol Rep 1: 474-489.
-
Deivanayagam C, Asokan S, Rajasekar S (2014) The Study of Lipid Peroxidation, Liver Enzymes and Antioxidant status In lufenuron Treated Mice, Mus Musculus species. International Journal of Chem Tech Research 6: 5321- 5328.
-
Salvi M, Battaglia V, Brunati AM, La Rocca N, Tibaldi E, et al. (2007) Catalase takes part in rat liver mitochondria oxidative stress defense. J Biol Chem 282(33): 24407- 24415.
-
Huang Q, Wu X, Yu X, Zhang L, Lu M, et al. (2015) Comparison of the cytotoxic impact of chlorfluazuron on selected insect and human cell lines. Environ Toxicol Chem 34(7): 1675-1682.
-
Bayoumi AE, Pérez-Pertejo Y, Zidan HZ, Balaña-Fouce R, Ordóñez C, et al. (2003) Cytotoxic effects of two antimolting insecticides in mammalian CHO-K1 cells. Ecotoxicol Environ. Saf 55(1): 19-23.
-
Delescluse C, Ledirac N, de Sousa G, Pralavorio M, Lesca P, et al. (1998) Cytotoxic effects and induction of cytochromes P450 1A1/2 by insecticides in hepatic or epidermal cells: binding capability to the Ah receptor. Toxicol Lett 96-97: 33-39.
-
Perocco P, Colacci A, Grilli S (1993) In vitro cytotoxic and cell transforming activities exerted by the pesticides cyanazine, dithianon, diflubenzuron, procymidone, and vinclozolin on BALB/c 3T3 cells. Environ Mol Mutagen 21(1): 81-86.
-
Susin SA, Zamzami N, Kroemer G (1998) Mitochondria as regulators of apoptosis: doubt no more. Biochim Biophys Acta 1366(1-2): 151-165.
-
Raza H, John A, Benedict S (2011) Acetylsalicylic acid- induced oxidative stress, cell cycle arrest, apoptosis and mitochondrial dysfunction in human hepatom HepG2 cells. Eur J Pharmacol 668(1-2): 15-24.
-
Cory S, Huang DC, Adams JM (2003) The Bcl-2 family: roles in cell survival and oncogenesis. Oncogene 22: 8590-8607.
-
Dixon S, Soriano BJ, Lush RM, Bomer MM, Figg WD (1997) Apoptosis: its role in the development of malignancies and its potential as a novel therapeutic target. Ann Pharmcol 31(1): 76-81.
-
Story M, Kodym R (1998) Signal transduction during apoptosis; implications for cancer therapy. Front Biosci 3: 365-375.
-
Cory S, Adams JM (2002) The Bcl2 family: regulators of the cellular life-or-death switch. Nat Rev Cancer 2(9): 647-656.|
-
Wang X, Zhan Q, Coursen JD, Khan MA, Kontny HU, et al. (1999) GADD45 induction of a G2/M cell cycle checkpoint. Proc Natl Acad Sci USA 96(7): 3706-3711.
-
Rashmi R, Kumar STR, Karunagaran D (2003) Human colon cancer cells differ in their sensitivity to curcumininduced apoptosis and heat shock protects them by inhibiting the release of apoptosis-inducing factor and caspases. FEBS Lett 538(1-3): 19-24.
-
Schepers H, Geugien M, van der Toorn M, Harm H, Bart JLK, et al. (2005) HSP27 protects AML cells against VP- 16- induced apoptosis through modulation of p38 and c-Jun. Exp Hematol 33: 660-670.
-
Casado P, Zuazua-Villar P, del Valle E, Martínez-Campa C, Lazo PS, et al. (2007) Vincristine regulates the phosphorylation of the antiapoptotic protein HSP27 in breast cancer cells. Cancer Lett 247(2): 273-282.
-
Oltvai ZN, Milliman CL, Korsmeyer SJ (1993) Bcl-2 heterodimerizes in vivo with a conserved homolog, Bax, that accelerates programmed cell death. Cell 74(4): 609- 619.
-
Desagher S, Martinou JC (2000) Mitochondria as the central control point of apoptosis. Trends Cell Biol 10(9): 369-377.
-
Xu W, Wang B, Yang M, Zhang Y, Xu Z, et al. (2017) Tebufenozide induces G1/S cell cycle arrest and apoptosis in human cells. Environ Toxicol Pharmacol 49: 89-96.
-
Al-Amoudi WM (2017) Protective effects of fennel oil extract against sodium valproate-induced hepatorenal damage in albino rats. Saudi J Biol Sci 24(4): 915-924.
-
Tripathi P, Tripathi R, Patel RK, Pancholi SS (2013) Investigation of antimutagenic potential of Foeniculum vulgare essential oil on cyclophosphamide induced genotoxicity and oxidative stress in mice. Drug Chem Toxicol 36(1): 35-41.
-
Timoumi R, Ben Salem I, Amara I, Annabi E, Abid- Essefi S (2019) Protective effects of fennel essential oil against oxidative stress and genotoxicity induced by the insecticide triflumuron in human colon carcinoma cells. Environ Sci Poll Res 27(8): 7957-7966
-
Faudale M, Viladomat F, Bastida J, Poli F, Codina C (2008) Antioxidant activity and phenolic composition of wild, edible, and medicinal fennel from different Mediterranean countries. J Agric Food Chem 56(6): 1912-1920.
-
Choi EM, Hwang JK (2004) Anti-inflammatory, analgesic and antioxidant activities of the fruit of Foeniculumvulgare. Fitoterapia 75(6): 557-565.
-
Chatterjee S, Goswami N, Bhatnagar P (2012) Estimation of phenolic components and in vitro antioxidant activity of fennel (Foeniculumvulgare) and ajwain (Trachyspermumammi) seeds. Adv Biores 3: 109-118.
-
Sofowora EA, John Willey, Sons Chichester (1993) Medicinal Plants and Traditional Medicine in Africa, pp: 178.
-
Singh G, Maurya S, de-Lampasona MP, Catalan C (2006) Chemical constituents, antifungal and antioxidative potential of Foeniculumvulgare volatile oil and its acetone extract. Food Control 17(9): 745-752.
- Pattern of Gonadal Hormones in Oral Testosterone-Supplimented Male Wistar Rats with Diabetes-Induced Hypogonadism
- Re-Evaluation of the Genotoxicity of Currently Used Food Dyes in Mouse Multiple Organs Via Continuous Administration by Drinking Using the Comet Assay
- Pharmacogenetics of Type 2 Diabetes Mellitus: Linking Genetic Variability to Drug Efficacy and its Cardiovascular Outcomes
- Exploratory Proteomic Profiling of SARS-CoV-2 Infected THP-1 Macrophages Reveals Alterations in Inflammatory Response and Cellular Metabolism
- Study of Genotoxicity of Hepatocarcinogens in Multiple Organs in Mice by Feeding and Drinking Using the Comet Assay
- Spirulina Polypeptides Inhibit the Growth of Human Lung Tumor (H460) Cells