Is Genotoxicity of Peroxisome Proliferator-Activated Receptor Agonists Due to Oxidative Stress Via Agonistic Pathways?
In order to investigate the relationship between genotoxicity and peroxisome proliferator-activated receptor (PPAR) agonistic effects, we conducted two kinds of comet assays (cellular and acellular), a micronucleus (MN) test, and a TK mutation assay with and without PPAR antagonists using human lymphoblastoid cells. PPARα agonist clofibrate (CLF) and PPARγ agonists indomethacin (IND) and pioglitazone (PGZ) showed positive responses in the cellular comet assay, TK mutation assay, and detection of intracellular reactive oxygen species (ROS), but not in the acellular comet assay and MN test. PPARα antagonist (GW6471) suppressed the induction of ROS, DNA damage, and TK mutation by CLF. PPARγ antagonist (BADGE) suppressed the induction of ROS, DNA damage, and TK mutation by IND and PGZ. Therefore, CLF and two PPARγ agonists (PGZ and IND) show genotoxicity by oxidative stress via PPARα and PPARγ agonistic pathways, respectively. Considering that some unrepaired DNA lesions induced by them persist to form gene mutations but not chromosome aberrations, there is a possibility that their genotoxic potential is due to mutagenic but not clastogenic potential by the production of ROS via agonistic pathway
Introduction
Several proliferator-activated receptors (PPAR) agonists have tumor-promoting activity in rodent liver [1] and are classified as “possible human carcinogens” by the Environmental Protection Agency (EPA) [2]. We have previously investigated the genotoxicity of PPARα agonists perfluoroalkyl acids (PFAAs), using two kinds of comet assays (cellular and acellular), a micronucleus (MN) test, and a TK mutation assay with and without PPARα antagonists in human lymphoblastoid TK6 cells. In that study, PFAAs at
125-1000 µg/mL showed positive responses in the cellular comet assay but not in the MN test and TK mutation assay. Based on the findings that PPARα antagonist GW6471 reduced PFAA-induced DNA damage (in the cellular comet assay) and abolished PFOA-induced intracellular reactive oxygen species (ROS) formation, PFAA-induced DNA damage is partly related to the oxidative stress via PPARα, without manifestation of chromosome aberration and point mutation [3]. Various PPAR agonists, such as clofibrate, simfibrate ciprofibrate, and phthalate ester plasticizers, increase levels of 8-OHdG [4, 5, 6] and ciprofibrate has been shown to induce DNA adducts in rat liver in the 32P-postlabeling studies [7]. Furthermore, indomethacin induced gene mutations in Salmonella [8]. In vivo clasogenicity of indomethacin was also shown in male mice [9]. Although PPAR agonists are considered to be non-genotoxic rodent carcinogens [1], therefore, it remains possible that PPAR agonists are genotoxic. In the present study, we investigated whether DNA damages is induced by PPARα and PPARγ agonists via PPAR agonistic pathways. For this purpose, we conducted comet assay, MN test, and TK mutation assay using human lymphoblastoid cells.
Materials and Methods
Chemicals
Studied PPAR agonists and antagonists are shown in Table 1.
| Agonists, antagonists, and CAS No | Abbreviation | Mode of action | Source |
|---|---|---|---|
| Perfluorooctanoic 335-67-1 | PFOA | PPARα agonist | W |
| Clofibrate 637-07-0 | CLF | PPARα agonist | T |
| Indomethacin 53-86-1 | IND | PPARγ agonist | T |
| Pioglitazone 111025-46-8 | PGZ | PPARγ agonist | S |
| GW6471 880635-03-0 | PPARα antagonist | To | |
| Bisphenol A 1675-54-3 | BADGE | PPARγ antagonist | A |
Table 1: PPAR agonists and antagonists examined in this study W: Wako Pure Chemical Industries, Ltd., Osaka, Japan; T: Tokyo Kase
Cells
The TK+/- heterozygote of the WTK1 human lymphoblastoid cells (kindly provided by Dr. Honma, National Institute of Health Sciences) and L5178Y mouse lymphoblastoid cells were maintained in culture using RPMI1640 medium (Nissui Pharmaceutical Co., Ktd.) supplemented with 10% horse serum (SAFC Biosciences), 200µg/mL sodium pyruvate, and 200µg/mL streptomycin at 37°C under 5% CO2 atmosphere. Cells were maintained in logarithmic growth. Cells at 5 x 10⁵ cells/mL were exposed to each PPAR agonist for 4h with and without PPAR antagonists. After exposure, the cell cultures were centrifuged, washed twice with Hanks’ BSS, and re-suspended in the fresh medium. The cell cultures were used for the comet assay, MN test, and TK gene mutation assay.
Comet Assay
Both cellular and acellular comet assays were conducted. The cellular comet assay was generally conducted as previously described [10], immediately after chemical treatment, with or without the combination of DNA repair inhibitors of cytosine-1-β-D-arabinofuranoside (araC) (1.8 mM) and hydroxyurea (HU) (10 mM). The two inhibitors were used at concentrations that did not induce significant reductionsin cell viability [10]. Immediately after chemical treatment, cell viability was also measured using the trypan blue exclusion test. Relative survivals (survivals of treated cells compared with untreated control cells) were obtained. The cells were embedded in LGT agarose (Nakalai Tesque, Kyoto, Japan) dissolved in saline at 1%. Then, slides were placed in a chilled lysing solution (2.5M NaCl, 100mM Na4EDTA, 10 mM Tris-HCl, 1% sarkosyl, 10% DMSO, and 1% Triton X-100, pH 10) and kept at 0°C in the dark for >60 min, then the slides were placed on a horizontal gel electrophoresis platform, and covered with pH>13 alkaline solution comprised of 300mM NaOH and 1mM Na 2EDTA for 20 min in the dark at 0°C. Electrophoresis was conducted at 0 oC in the dark for 20min at 25V (0.96V/cm, approximately 300 mA). In the acellular comet assay, slides embedded with untreated WTK1 cells were lysed as indicated above. The lysed slides were then neutralized in 400mM Tris HCl buffer (pH 7.5) for 15 min, and then treated with PPAR agonists in the buffer for 4h at room temperature in the dark. After treatment, the slides were rinsed three times for 5min by immersing in cold distilled water, placed on a horizontal gel electrophoresis platform, and covered with pH >13 alkaline solution comprised of 300 mM NaOH and 1 mM Na2EDTA, then electrophoresed as described above. For both the cellular and acellular comet assays, neutralized slides were stained with 50µL of 2 µg/mL ethidiumbromide. Photographs of comet images were taken using Fuji Neopan Presto 400 Black & White film and tail length was measured manually using a scale for 50 nuclei for each dose.
MN Test
WTK1 cells were exposed to each PPAR agonist for 4 h as described above. At the end of the treatment period, the cells were washed with Hanks’ BSS, cultured for 24h in medium containing 3 µg/mL cytochalasin B, and then sampled. The collected cells were suspended in 0.075M KCl hypotonic solution for 15 min, and the cell suspension was concentrated to the volume of 1 mL, mixed with 1 mL of 10% neutral buffered formalin solution, and then concentrated to a volume of 100µL. The cell suspension was further mixed with 100 µL of 0.05 w/v% aqueous solution of acridine orange, and then 50 µL of cell suspension was put onto a slide glass and mounted with a 24 x 48 mm cover slip. Bi- nuclei cells with micronuclei (MNBNC) at 1000 bi-nuclei cells (BNC) and BNC at 1000 cells were scored with the aid of a fluorescence microscope (Olympus at 600x magnification) equipped with a B filter.
TK mutation assay
To evaluate cytotoxicity, cells treated for 4 h were seeded onto 96-well cluster dishes at 1.6 cells/well and cultured for 12 days, and then the numbers of wells with colonies were recorded. To detect TK mutations, cells treated for 4 h were cultured in fresh medium for 3 days, and then cells were seeded onto 96-well cluster dishes at 2000 cells/well in fresh medium with 3.0 µg/mL trifluorothymidine (TFT) and 1.6 cells/well in fresh medium without TFT. For cells cultured with TFT, the numbers of wells with normally growing (NG) and slowly growing (SG) colonies were recorded to evaluate TFT resistant mutation frequency after 12 and 30 days, respectively.
Detection of Intracellular Reactive Oxygen Species (ROS) Formation
The intracellular ROS was detected as previously described [3]. WTK1 cells were cultured for 1 h with 50 µM BES-H2O2-Ac (Wako Pure Chemical Industries, Ltd.), exposed to each PPAR agonist or H2O2 for 30 min with and without PPAR antagonists, and then the frequency of fluorescent cells was scored with the aid of a fluorescence microscope (Olympus at 600x magnification) equipped with a B filter [3].
Statistics
Differences between the means of triplicated studies in treated and control groups were compared with the Dunnett test after one-way ANOVA. For each pairwise comparison, Student’s t-test was used. A p-value less than 0.05 was considered significant.
Results
In the cellular comet assay, the studied PPAR agonists at >250µg/mL significantly increased tail length in the presence and absence of a combination of DNA repair inhibitors of araC and HU, and tail length was longer with than without DNA repair inhibitors. In the acellular comet assay, PPAR agonists did not significantly increase tail length (Figure 1).
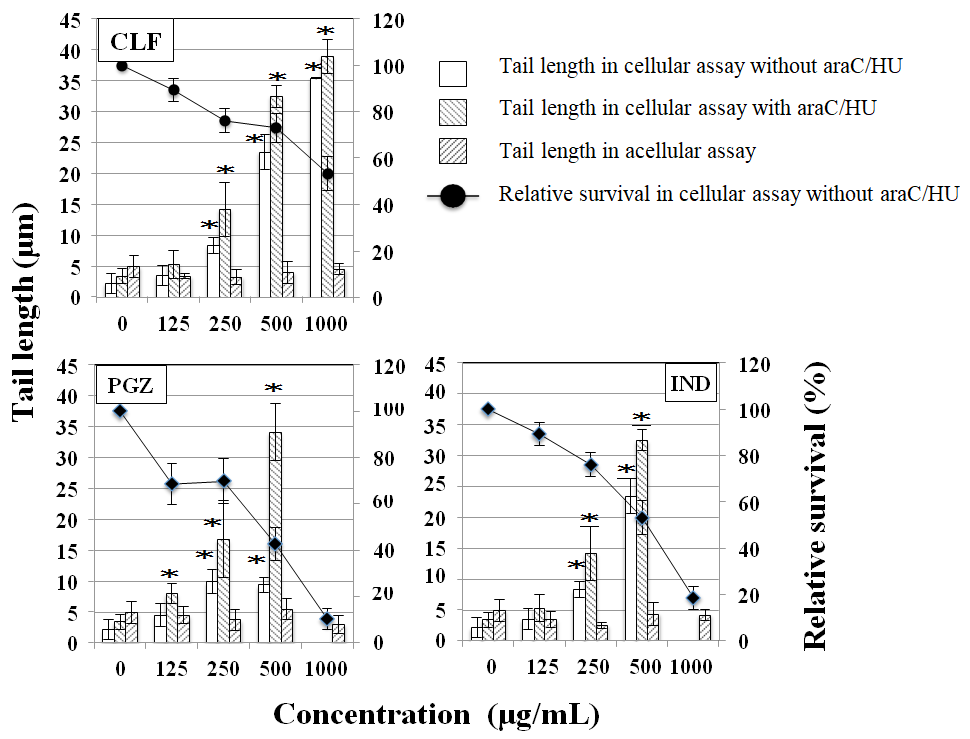
Figure 1: Tail length and relative survival by CLF, IND, and PGZ in the acellular and cellular comet assay. Tail length with and without araC/HU and relative survival without araC/HU (%, survival compared with the untreated control) were obtained immediately after exposure to each chemical for 4 h. Mean of three trials are shown. The error bars indicate standard deviation of the mean of three independent trials. *Significantly higher than untreated cells: p<0.05.
PPARα antagonist GW6471 reduced tail length induced by CLF but not by IND and PGZ. On the contrary, PPARγ antagonist BADGE reduced tail length induced by IND and PGZ but not by CLF (Figure 2). In the MN test, no significant increase in the frequency of MNBNCs was observed in cells treated with CLF, IND, and PGZ for 4 h at the concentration range where remarkable reduction in relative BNC was not observed (Figure 3). In the TK mutation assay with WTK1 cells (Figure 4), CLF, IND, and PGZ increased the frequency of NG but not SG mutant colonies. The ratio of SG mutant colony to total mutant colony (%SG) decreased dose-dependently. PFOA increased the frequency of NG mutant colonies in WTK1 and L5178Y cells (Figure 5). The frequencies of SG mutant colonies were increased by 62.5 and 125 µg/mL PFOA in WTK1 and L5178Y cells. Although %SG decreased dose- dependently at >15.6 µg/mL PFOA and reached to plateau (about 30%) at >31.3 µg/mL in L5178Y cells, it increased dose-dependently and reached >50% at 125 µg/mL in WTK1 cells. The frequency of total mutant colony was about 8-times higher in L5178Y cells than in WTK1 cells. The induction of mutant colony by CLF was observed with PPARγ antagonist BADGE but reduced with PPARα antagonist GW6471 (Figure 6). On the contrary, the induction of mutant colonies by IND and PGZ was observed with PPARα antagonist GW6471 but was reduced with PPARγ antagonist BADGE (Figure 6).
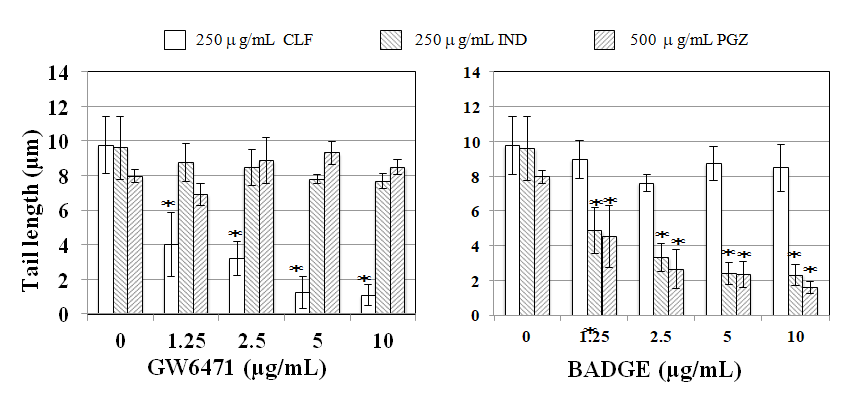
Figure 2: Effect of PPAR antagonists on DNA migration by CLF, IND, and PGZ in the cellular comet assay. Tail length was obtained immediately after the exposure to 250 µg/mL CLF, 250 µg/mL IND, or 500 µg/mL PGZ for 4 h with a PPAR antagonist without araC/HU. Mean of three trials are shown. The error bars indicate standard deviation of the mean of three independent trials. *Significantly lower than without PPAR antagonist: p<0.05.
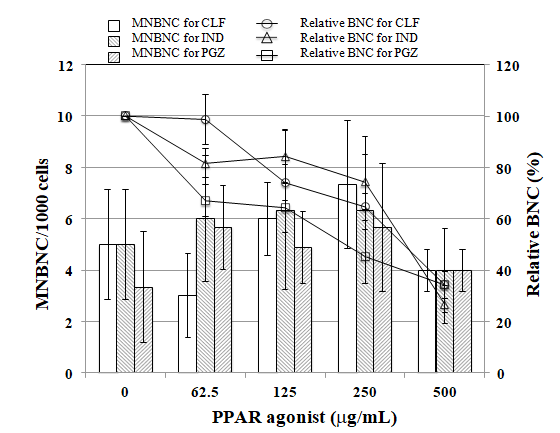
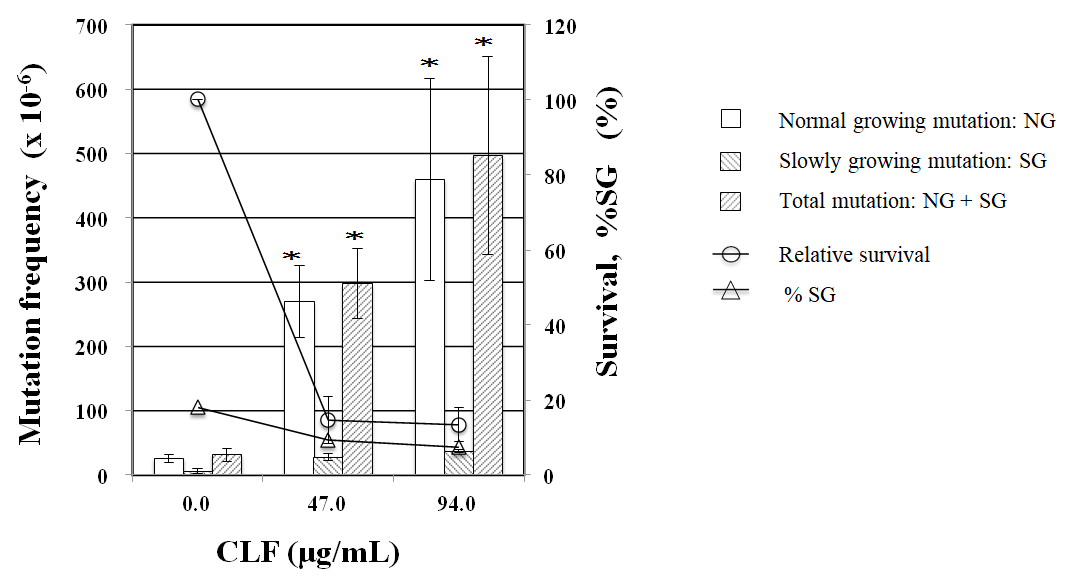
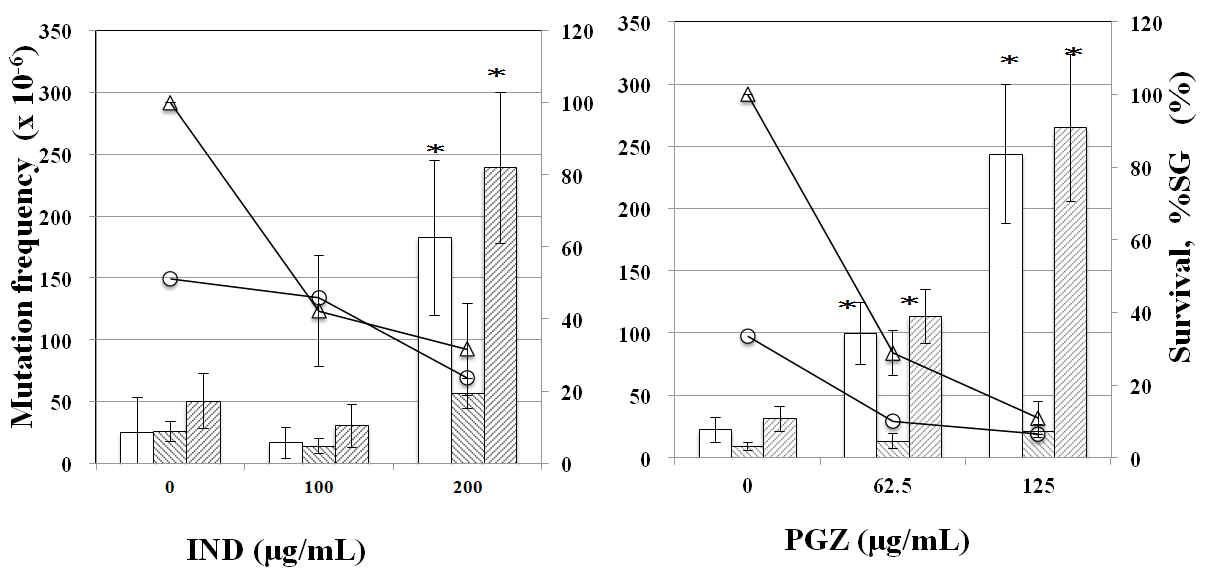
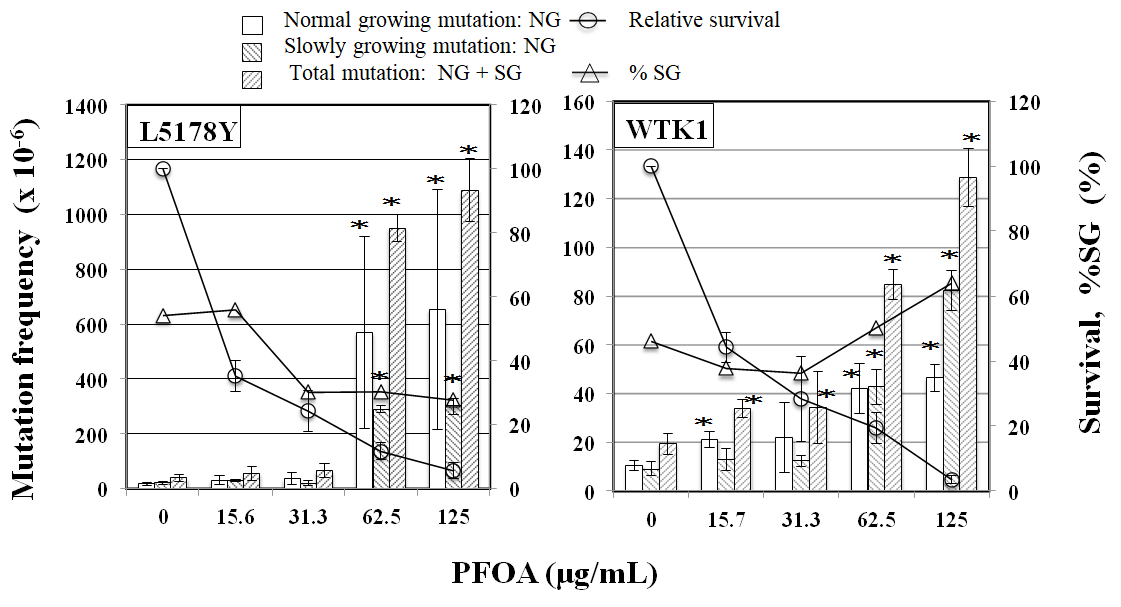
Figure 5: TK mutation induction by PFOA in WTK1 and L5178Y cells. The frequency of TK mutation was obtained after a 3-day expression period following exposure to each chemical for 4h. Mean of three trials are shown. The error bars indicate standard deviation of the mean of three independent trials. *Significantly higher than untreated cells: p<0.05
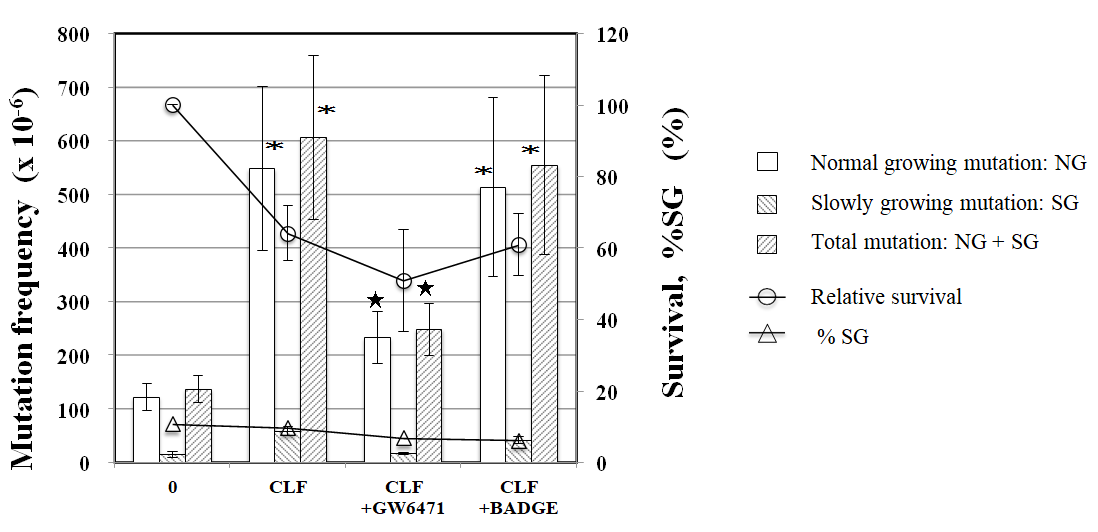
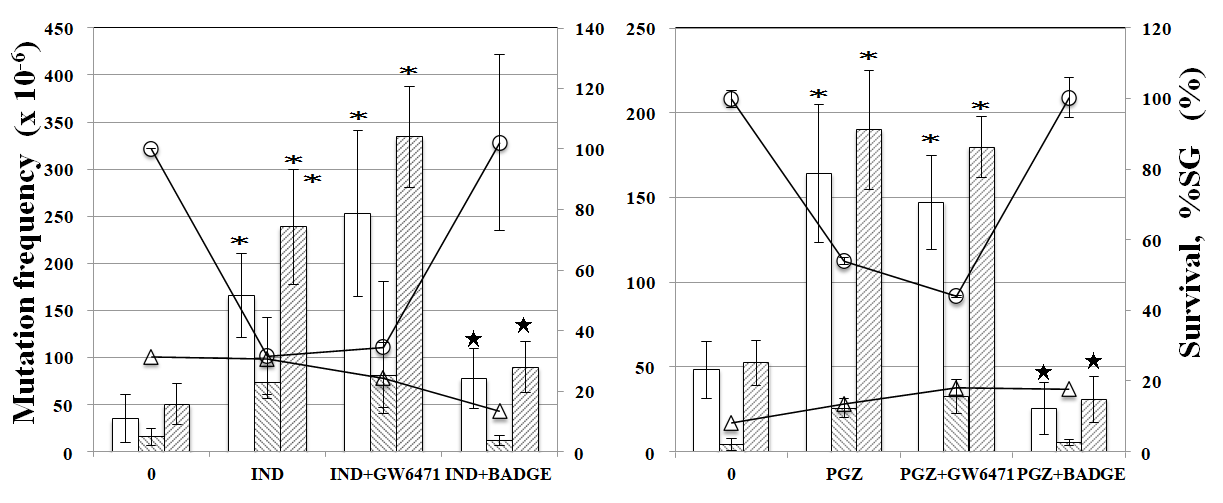
Figure 6: Effect of PPAR antagonists on TK mutation induction by CLF, IND, and PGZ. The frequency of TK mutation was obtained after a 3-day expression period following exposure to 94 µg/mL CLF, 100 µg/mL IND, or 125 µg/mL PGZ with or without 4 µg/mL PPAR antagonists. Mean of three trials are shown. The error bars indicate standard deviation of the mean of three independent trials. *Significantly higher than untreated cells: p<0.05. ★Significantly lower than without PPAR antagonist: p < 0.05. 30
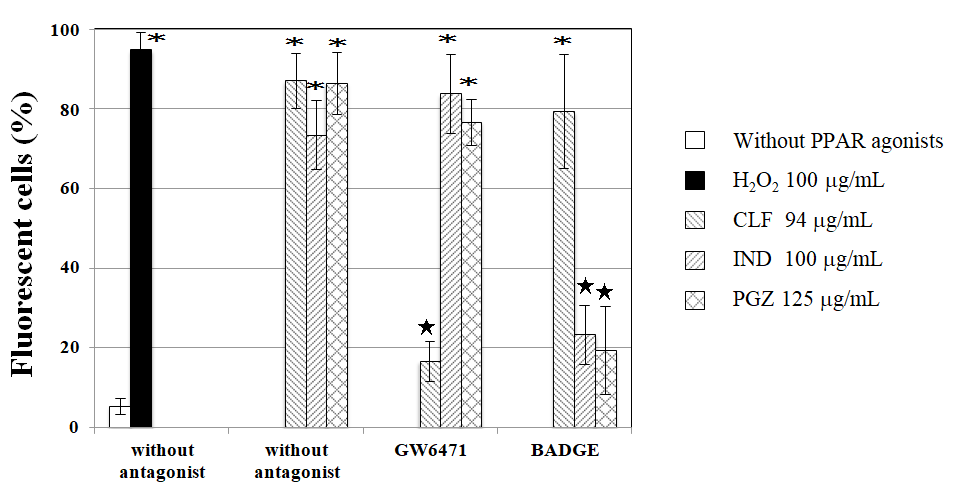
Figure 7: Effects of PPAR antagonists on CLF-, IND-, and PGZ -induced intracellular ROS. Fluorescent cells were scored immediately after 30 min exposure to CLF, IND, or PGZ with and without 4 µg/mL PPAR antagonist GW6471 or BADGE after 1h incubation with 50 µM BES-H2O2-Ac. Mean of three trials are shown. The error bars indicate standard deviation of the mean of three independent trials. *Significantly higher than untreated cells: p<0.05. ★ Significantly lower than without PPAR antagonist: p < 0.05.
The induction of intracellular ROS is shown in Figure 7. Not only H2O2 but also 3 PPAR agonists (CLF, IND, and PGZ) without PPAR antagonists increased the frequency of fluorescent cells, showing the induction of intracellular ROS. Significant differences in the frequencies of fluorescent cells by CLF were not observed between with and without PPARγ antagonist BADGE, but the frequency of fluorescent cells by CLF was significantly lower with than without PPARα antagonist GW6471. Significant differences in the frequencies of fluorescent cells by IND and PGZ were not observed between with and without PPARα antagonist GW6471, but the frequencies of fluorescent cells by IND and PGZ were significantly lower with than without PPARγ antagonists BADGE.
Discussion
In the acellular assay, since lysed cells are exposed to test compounds, it detects only single strand breaks (SSBs) as initial lesions produced by the direct reaction between DNA and test compounds without any biological events [11]. Previously, PFOA, a PPARα agonist, showed positive response in the acellular comet assay where there is no cellular function, such as PPAR, from which PFOA-induced DNA damage was considered to be caused by two distinct pathways: (1) oxidative stress via PPARα agonistic pathway and (2) direct reaction of PFOA with DNA or remaining cellular components such as proteins [3]. The induction of ROS by PPARα agonist CLF and PPARγ agonists (IND and PGZ) was suppressed by PPARα and PPARγ antagonists but not by PPARγ and PPARα antagonists, respectively, supporting that PPAR agonists induce ROS via PPAR agonistic pathways. Furthermore, the PPAR agonists did not show positive responses in the acellular comet assay, which supports the ruling out of genotoxic mechanisms through the induction of SSBs as initial damage without any cellular functions. For SSBs as initial lesions and DNA lesions that may be repaired by excision repair, tail length is greater with than without DNA repair inhibitors [10]. Tail length by CLF, IND, and PGZ was greater with than without araC/HU, supporting that they induced DNA lesions that can be repaired by the excision repair. Considering that oxidized bases are removed by excision repair [11] and that CLF, IND, and PGZ were shown to induce ROS in the present study, it is possible that DNA damages induced by CLF, IND, and PGZ through PPAR agonistic pathways are oxidized bases, which coincides with that CLF increased levels of 8-OHdG [4].
The comet assay detects not only SSBs as initial DNA damage but also SSBs that are developed from alkali-labile sites under alkaline conditions [12]. The MN test detects structural chromosome aberrations and/or numerical chromosome aberrations due to aneugenic effects [13]. The TK mutation assay detects point mutations and gross structural changes that may result in chromosome aberrations [14]. CLF, IND, and PGZ showed positive responses in the cellular comet and TK mutation assays but not in the acellular comet assay and MN test, indicating that they induced DNA damages that can form point mutations but not chromosome aberrations. PPARα antagonist GW6471 reduced the induction of DNA damage and TK mutation by CLF in the cellular comet assay and TK mutation assay, but did not affect the induction of DNA damage and TK mutation by IND and PGZ. PPARγ antagonist BADGE reduced the induction of DNA damage and TK mutation by PGZ and IND but not by CLF. Therefore, PPARα agonist (CLF) and PPARγ agonists (PGZ and IND) may have mutagenic potential via PPARα agonistic and PPARγ agonistic pathways, respectively.
Considering the carcinogenic process, it is important to inspect whether DNA primary lesions are repaired, un- repaired DNA lesions result in cytotoxicity, or un-repaired DNA lesions form chromosome aberrations and/or gene mutations. In the present in vitro study, we compared the induction of DNA lesions, chromosome aberrations (micronuclei), and TK gene mutations. Both CLF and IND led to positive responses in the cellular comet assay and TK gene mutation assay but not in the MN test, suggesting that un-repaired DNA lesions induced by them persist to form gene mutations but not chromosome aberrations. Therefore, it is possible that genotoxicity of PPAR agonists via PPAR dependent pathways may be correlated with carcinogenicity.
In this study, the PPARα agonist PFOA induced TK mutation in both WTK1 and L5178Y cells, which seems to contradict our previous findings that PFOA induced DNA damage but not TK mutation in human lymphoblastoid TK6 cells [3]. The results suggest that PFOA-induced DNA damage persist to form point mutations in WTK1 but not in TK6 cells. Although TK6 have a functional p53, WTK1 and L5178Y cells have a mutated p53. Therefore, the discrepancy between WTK1 and TK6 cells in the induction of TK mutation by PFOA is most likely attributed to p53 functionality rather than cell origin (human vs mice). Although PFOA induced TK mutation in both WTK1 and L5178Y cells, mutation frequency is about 8-times higher in L5178Y than in WTK1 cells, which is concordant with the finding that PPARα expression in rodents is about 10 times higher than that in humans [2].
In TK6 and WTK1 cells, NG mutants are produced mainly as a result of point mutations in the TK locus, whereas SG mutants are induced by gross structural changes outside the TK locus [15]. In the present study, CLF, IND, and PGZ increased the frequency of NG but not SG mutants, suggesting that observed gene mutations are due to point mutations in the TK locus but not gross structural changes. CLF, IND, and PGZ did not induce MNBNC, which coincides with the finding that they did not induce SG mutants. Therefore, our results suggest that the genotoxicity of these agonists is due to mutagenic but not clastogenic potential. On the other hand, PFOA increased both NG and SG mutants, suggesting that the genotoxicity of PFOA is due to both mutagenic and clastogenic potential.
Conclusion
The genotoxicity of PPAR agonists except for PFOA is due to mutagenic but not clastogenic potential by the production of ROS via agonistic pathway.
Conflicts of Interest
The authors declare that the research was conducted in the absence of any intellectual commercial or financial relationships that could be construed as potential conflicts of interest.
Acknowledgement
No funding was provided by any agency or institute for this work. This research was conducted by Hijiri Kojima as a graduation research of Chemical and Biological Engineering Course, National of Institute of Technology, Hachinohe College under the research guidance of a course staffs based on allocation of school educational expenses. Authors acknowledge Chemical and Biological Engineering Course, National of Institute of Technology, Hachinohe College.
References
-
Popp JA, Cattley RC (1992) Peroxisome proliferators as initiators and promoters of rodent hepatocarcinogenesis. In: Gibson GG, et al. (Eds.), Monograph of Peroxisome Proliferation, Taylor & Francis, London, pp: 653-665.
-
Palmer CN, Hsu MH, Griffin KJ, Raucy JL, Johnson EF (1998) Peroxisome proliferator activated receptor- alpha expression in human liver. Mol Pharmacol 53(1): 14-22.
-
Nakamura M, Takahashi T, Izumi T, Miura M, Kawaguchi M, et al. (2016) Peroxisome proliferator activated receptor-mediated genotoxicity of perfluoroalkyl acids using human lymphoblastoid cells. Fundm Toxicol Sci 3(4): 143-150.
-
Kasai H, Okada Y, Nishimura S, Rao MS, Reddy JK (1989) Formation of 8-hydroxydeoxy-guanosine in liver DNA of rats following long-term exposure to a peroxisome proliferator. Cancer Res 49(10): 2603-2605.
-
Sai TK, Umemura T, Hasegawa R, Kurokawa Y (1990) Significant increase of 8-hydroxydeoxyguanosine in liver DNA of rats following short-term exposure to the peroxisome proliferators di-2-ethylhexyl.phthalate and di-2-ethyl- hexyl.adipate. Jpn J Cancer Res 81(3): 213 -215.
-
Sai TK, Umemura T, Hasegawa R, Kurokawa Y (1991) Short-term exposure to the peroxisome proliferators, perfluo- rooctanoic acid and perfluorodecanoic acid, causes significant increase of 8-hydroxydeoxyguanosine in liver DNA of rats. Cancer Lett 57(1): 55-60.
-
Randerath E, Randerath K, Reddy R, Danna TF, Rao MS, et al. (1991) Induction of rat liver DNA alterations by chronic administration of peroxisome proliferators as de- tected by 32 P-postlabeling. Mutat Res 247(1): 65- 76.
-
Mortelmans K, Haworth S, Lawlor T, Speck W, Tainer B, et al. (1986) Salmonella mutagenicity tests II. Results from the testing of 270 chemicals. Environ Mutagen 8 (suppl 7): 1-119.
-
Devi PS, Polasa H (1987) Evaluation of the anti- inflammatory drug indomethacin, for its genotoxicity in mice. Mutat Res 188(4): 343-347.
-
Kawaguchi S, Nakamura N, Yamamoto A, Sasaki HG (2010) Is the Comet Assay a Sensitive Procedure for Detecting Genotoxicity? J Nucleic Acids. Article ID 541050.
-
Kawaguchi S, Nakamura T, Honda G, Yokohama N, Sasaki YF (2008) Detection of DNA single strand breaks induced by chemical mutagens using the acellular Comet assay. Genes and Environment 30(3): 77-88.
-
Collins R (2004) The Comet assay for DNA damage and repair: principles, applications, and limitations. Mol Biotechn 26(3): 249-261.
-
Obe G, Pfeiffer P Savage JRK (2002) Chromosomal aberrations: formation, identification and distribution. Mutat Res 504(1-2): 17-36.
-
Fenech M, Morley AA (1985) Measurement of micronuclei in lymphocytes. Mutat Res 147(1-2): 29-36.
-
Bakalkin G, Yakovleva T, Selivanova G, Magnusson K, Szekely L, et al. (1994) p53 binds single stranded DNA ends and catalyzes DNA renaturation and strand transfer. Proc Natl Acad Sci USA 91(1): 413-417.
- Pattern of Gonadal Hormones in Oral Testosterone-Supplimented Male Wistar Rats with Diabetes-Induced Hypogonadism
- Re-Evaluation of the Genotoxicity of Currently Used Food Dyes in Mouse Multiple Organs Via Continuous Administration by Drinking Using the Comet Assay
- Pharmacogenetics of Type 2 Diabetes Mellitus: Linking Genetic Variability to Drug Efficacy and its Cardiovascular Outcomes
- Exploratory Proteomic Profiling of SARS-CoV-2 Infected THP-1 Macrophages Reveals Alterations in Inflammatory Response and Cellular Metabolism
- Study of Genotoxicity of Hepatocarcinogens in Multiple Organs in Mice by Feeding and Drinking Using the Comet Assay
- Spirulina Polypeptides Inhibit the Growth of Human Lung Tumor (H460) Cells