Effect of Kidney Function on Amikacin Pharmacokinetics on Hospitalized Patients: Knowledge to Improve Therapy
Despite the narrow therapeutic window characteristic of amikacin, this amino glycoside remains one of the most frequently prescribed particularly against multiple drug-resistant pathogens. In order to achieve an effective antibiotic therapeutic effect with minimal toxicity and, simultaneously avoid bacterial resistance development, the pharmacokinetics drug monitoring is recommended for amikacin. Since amikacin is almost 100% eliminated by glomerular filtration and it is nephro- and ototoxic, its exposure and availability in renal patients is expected to be altered in relation to patients with normal organ function. In this context, the present study aimed at assessing the correlation between demographical/biochemical data and the pharmacokinetic parameters of amikacin in an attempt of developing dosage recommendations to renal patients. The present retrospective study included 628 patients undergoing therapy with amikacin and admitted in Coimbra University Hospital pole of the Hospital and University Centre of Coimbra, EPE, in Portugal, between 2008 and 2015. Blood samples were collected 1 h after the end of amikacin infusion and 30 min before the following administration to attain the peak concentration (Cmax) and the trough concentration (Cmin). Demographic data, dose and frequency of administration of amikacin and creatinemia were also collected for each patient, whose pharmacokinetic parameters were then calculated using equations Sawchuk and Zaske. The population was divided regarding the age of each patient (18-34; 35-49; 50-64; 65-79 and ≥80 years old) and regarding the glomerular filtration rate:
Introduction
The exponential increase in antibiotic resistance seen in several countries, including Portugal, combined with the paucity of new drug development calls for a prudent, controlled and appropriate use of antibiotics in all areas of medicine [1]. The density of anti-bacterial treatments —with all its implications for cost, toxicity, the emergence of resistance and recommendations on diagnosis and follow-up, as well as recommendations on further therapy in the outpatient setting—is so high, particularly in the hospital sector, that safety and quality processes must be assured. In this context, since emergence of anti-bacterial resistance developed by bacteria can be promoted by using incorrect, low dosages of antibiotics with low resistance barrier, strategies to avoid incorrect drug dosage or suboptimal dispensing have revealed to be useful. Among them, pharmacokinetic drug monitoring (PDM) and the assessment of pharmacokinetic/pharmacodynamic properties can be highlighted as they seem to improve antibiotic dosing and to allow the achievement of optima anti-bacterial effective and safe plasma levels at least in critical areas such as intensive care units, oncology, pediatric and nephrology [2, 3, 4, 5, 6, 7, 8, 9]. At the hospital level, the amino glycoside amikacin has been one of the most frequently prescribed antimicrobial agents against Gram-negative and multi- drug resistant pathogens such as Pseudomonas aeruginosa [10, 11]. Although widespread used, amikacin exhibits a narrow therapeutic plasma index, potential nephro- and ototoxic side effects and wide intra- and inter-individual variability. Altogether, these facts promoted the use of PDM and the assessment of plasma drug concentrations (PDC) as a standard clinical practice in order to guaranty the therapeutic effect with minimal or no side effects and, hence, adjust and optimize the posology of amikacin individually [12]. Indeed, amikacin is a concentration-dependent antibiotic, which means that its therapeutic effect is dependent of drug concentration in plasma. The ratio of its peak plasma concentration (Cmax) to the known minimum inhibitory concentration (MIC) of the pathogen (which can be given by local antibiogram data) is the PK/PD index that best link to the drug antibacterial activity and clinical efficacy. Currently, a ratio Cmax/MIC between 8 and 12 has been demonstrated to be necessary to achieve the clinical response [11, 13]. On the other hand, due to its toxicity, amikacin should not exhibit excessive predose (trough) concentrations and, therefore, its plasma concentrations should be also monitored before the following administration (Cmin), allowing dose decrease when unnecessarily high exposures have been measured [12]. Nevertheless, even employing PDM, the administration of the adequate amikacin dose is a real challenge due to its marked intra- and inter-individual pharmacokinetic variability; furthermore the pharmacokinetic behavior of amikacin is strongly influenced by the complex path physiological conditions of the patients. In particular, amikacin is a small and hydrophilic antibiotic with reduced plasma protein binding (< 10%), a volume of distribution similar to extracellular fluid volume (0.2-0.3 L/kg in adults) and a clearance proportional to glomerular filtration rate (GFR) [12, 14]. Alterations in volume of distribution can be very large in conditions leading to unstable or unknown fluid balances (e.g. sepsis, severe burns and febrile neutropenia), resulting in a reduced peak concentration if the dose is unchanged [14]. Thus, for concentration-dependent antimicrobials as amikacin, an increased volume of distribution will reduce the ability of a prescribed dose to achieve a target Cmax. To confirm that a larger dose achieves the optimal target, PDM is recommended to be performed by sampling plasma 30-60min after the end of the intravenous infusion [15]. Furthermore, due to its very low lipophilicity, amikacin is totally eliminated in its unchanged form by renal route and nearly 100% by glomerular filtration [16]; its elimination half-life time (t1/2) is approximately 2-3 h in adults, but it is prolonged in children (neonates) due to their immature renal function as well as it can be altered in patients who have impaired renal function [14]. Thus, the rate of clearance of renal eliminated drugs (including amikacin) is proportional to creatinine clearance (CLcr), a commonly used clinical biomarker of renal function and an estimate of the GFR, which has been used to estimate the optimal amikacin dose to be administered [16, 17]. Indeed, it is well recognized that the kidney is the primary organ responsible for drug elimination and, being amikacin nephrotoxic and exclusively eliminated by renal route, patient’s renal function must be monitored before and during amikacin administration as well as the target therapeutic concentrations (and, hence, the administered dose) must be individualized in accordance to the renal impairment degree. Renal diseases affect glomerular blood flow and filtration rates, which may compromise glomerular filtration of amikacin; thus, dosing regimens may need to be accordingly adjusted [10]. Otherwise, if the dose is not adjusted, reduced amino glycoside clearance will predispose the patient to toxicities (nephrotoxicity or ototoxicity). Obviously, the impact of renal diseases, such as acute kidney injury (AKI), on amikacin plasma concentrations depends on the extent that renal function is impaired. As amikacin is nearly 100% excreted by glomerular filtration, in the case of a certain reduction in CLcr, a proportionate reduction is expected to occur in amino glycoside clearance requiring a prolongation of the dosing interval [16]. In these clinical cases, an extension of the dosing frequency is suggested and the dosing interval should seek to maximize use of the amino glycoside post-antimicrobial effect [17]. Although minimizing the likelihood of toxicity using PDM and assessing PDC in renal patients are important, initial dosing regimen and further dose optimization to avoid under-dosing and maximize efficacy are also valuable. Moreover it is expected that the systemic availability (exposure) of amikacin to be higher in patients with lower CLcr than in those with normal CLcr. These facts prompted us to more carefully assess the correlation between changes in CLcr and amikacin pharmacokinetic parameters in order to identify the major determinants of these changes in subjects with distinct degrees of renal impairment in an attempt of developing dosage recommendations.
Methods
Patients Population and Data Collection
The present work was an observational and retrospective study, which used clinical data and plasma amikacin concentrations obtained as part of routine clinical care in patients admitted in Coimbra Hospital and Universitary Centre (CHUC, EPE) in Portugal. It included all patients admitted to different services of Coimbra University Hospital pole from CHUC, between January 2008 and December 2015, who were older than 18 years old, undergoing therapy with amikacin and with at least two PDC monitored (Cmax and Cmin). The plasma concentrations of amikacin from patients were obtained as routine practice in the CHUC, EPE and determined by fluorescence polarization immunoassay performed in the Clinical Pathology Laboratory from CHUC, EPE. Exclusion criteria included pregnant women, patients with insufficient weight, overweight or obese as well as those with renal replacement therapy. Usual clinical and demographic data was retrospectively collected and included gender, age, total body weight, ideal body weight (IBW), height, body mass index (BMI) and serum creatinine. Based on serum creatinine, CLcr which was estimated according to the Cockroft-Gault equation [18], while GFR was estimated based on Modification of Diet in Renal Disease (MDRD) equation [19, 20]. PDM data was also collected and included dose and frequency of amikacin administration, infusion and sampling times, and plasma concentrations of amikacin immediately before its administration (Cmin) and 60 min after intravenous infusion has finished (Cmax). The PDC were analyzed in accordance to the posologic regime instituted: conventional multiple daily dose (MDD) or extended dosing interval (EDI). Given the strong correlation well- known between CLcr and age with the pharmacokinetic parameters of amikacin, the population herein in study was divided regarding the age (18-34; 35-49; 50-64; 65- 79 and ≥80 years old) and the renal function given by GFR of each patient (<60, 60-120 and ≥120 mL/min/1.73 m2).
Estimation of Pharmacokinetic Data
Individual pharmacokinetic parameters of amikacin were estimated employing the computer application PKS - Abbott base Pharmacokinetic Systems, (PKS; version 1.1) and the equations of Sawchuk and Zaske [21]. Both methods allow the elaboration of therapeutic schemes "a priori" (initial dosage) and "a posteriori" (following therapeutic adjustments). Individual pharmacokinetic parameters are estimated, establishing, subsequently, the appropriate adjusted regime to achieve serum concentrations located within the therapeutic window. The former (PKS) is one of the most widely used programs in PDM and allows the use of non-linear, linear regression methods, and Bayesian methods for data adjustment. On the other hand, the Sawchuk and Zaske equation is an approach used to establish the dosing regimens for drugs administered by multiple intravenous infusions. It has been used for a long time, due to its clinical user-friendly approach and good predictive capability, requiring only two plasma concentrations-time for the calculation of the apparent distribution volume and the t1/2 in individual patients. These values are then used to individualize the dosing regimen where it is required to maintain plasma concentrations of the drug within a desired range [21]. Assuming that amikacin exhibits a first-order elimination kinetic behavior and it can be represented by a one-compartment model, , the Sawchuk and Zaske equations were herein applied using the values of Cmax and Cmin to estimate the apparent distribution volume, elimination constant, clearance and the t1/2 of amikacin in each patient from the study. Accordingly, the equations were as follow:
- Ke = ln (Cmax/Cmin) / tdif
- t1/2 = 0,693/ke
- Clearance = [[(dose/tdif)/Cmax*(1-e-ke.tinf)]/ (1-e- ke.tinf)]*(e-ketinf)
- Volume of distribution = (clearance/ke)/Weight Where tdif corresponds to time between the collection of both samples, tinf to the infusion time and ke to the elimination constant of amikacin.
Statistical Analysis
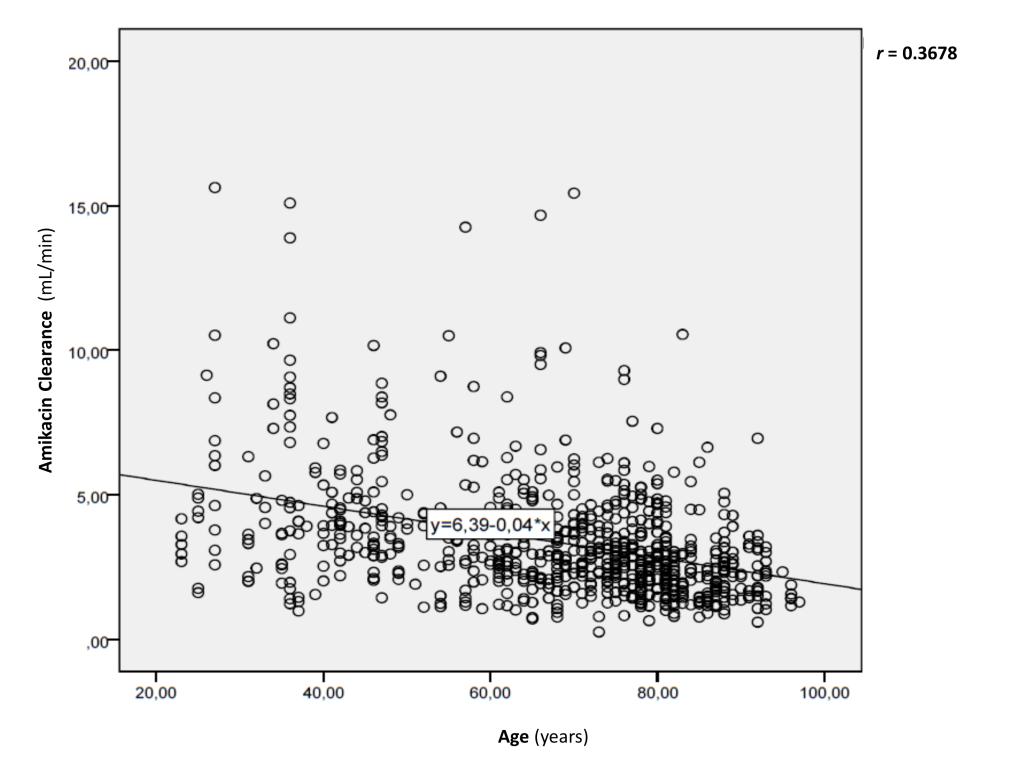
The analysis of the data was carried out through the statistical program SPSS version 20.0, and also using the program Microsoft Office Excel 2013 in which all the data collected was organized for each patient. The analysis of patient data included sex as categorical variable, and age, body weight, and pharmacokinetic parameters (including Cmax and Cmin) as continuous variables. Distribution normality was assessed and verified (Kolmogorov-Smirnov for n ≥ 50 or Shapiro-Wilk for n < 50), when regarding the quantitative dependent variables; their statistical comparison was accomplished through parametric tests, such as the t- Student test ("independent samples t-test") for two independent samples, or ANOVA ("analysis of variances") to compare the averages of at least three independent populations. In the latter case, when significant differences were found, pairs were compared through the Tukey test. Homogeneity of variance was also assessed and observed through the Levene test, when comparing populations with very different number of patients (n). For all the aforementioned tests, p values lower than 0.05 were assumed to be indicative of statistical differences. In order to identify the major determinants of amikacin pharmacokinetic behavior of renal patients, correlation studies were performed between amikacin pharmacokinetic parameters (i.e. dependent variables) and clinical/demographical variables such as weight, age, creatinine, CLcr (i.e. independent variables). The statistical correlation was assessed resorting to dispersion diagrams, Pearson (r) correlation coefficient; when correlation was found, a simple linear regression analysis was conducted to assess its predictive capacity.
Results and Discussion
Patient Population
Demographics and clinical characteristics of the 628 subjects enrolled in the present study are summarized in Table 1. The patient population was predominantly male and elderly since approximately 53.19% were at least 65 years old. As it is well known that the renal function and creatinine production is age-dependent and their tendency is to decrease as the age increases, together with the considerable variability observed within the present population (it ranged from 18 to 27), the population was divided into 4 sub-groups, whose frequency distribution is reported in Table 1. In opposition to age, BMI varied only between 18.5-25.0 kg/m2, which is regarded, in accordance to the WHO, as normal (18.5-24.9 kg/m2) [22]. Indeed this was expected due to the exclusion criteria mentioned in section 2.1. The principal pathologies most frequently diagnosed in the 628 patients included those from respiratory tract, namely pneumonia. Indeed, in Portugal, respiratory diseases are still one of the main causes of morbidity and mortality, with a tendency to increase, unlike other pathologies such as those from cardiovascular system [23]. Furthermore, the current world economic crisis scenario has also been responsible for the increment of chronic respiratory diseases, leading to numerous hospitalizations, loss of quality-of-life and high economic costs. On the other hand, it is interesting to emphasize the high prevalence of oncologic patients, who emerge, in this population, at the second place (Table 1). In fact, due to their immunosuppressed and neutropenia states, oncologic patients are highly susceptible to suffer bacterial infections, being amino glycosides one of the antibiotic groups usually administered not only for bacterial treatment but also as prophylaxis [24]. Regarding the species isolated amongst the patients herein evaluated, the Gram-negative Acinetobacter baumannii and Pseudomonas aeruginosa were the most common ones followed by Klebsiella pneumonia and Staphylococcus spp. (Table 1). According to the Infectious Diseases Society of American, these species are among the pathogens more clinically threatening mainly due to their ability to develop multi-resistance mechanisms against the antibiotic [25]. They have been frequently observed in hospitalized patients and in healthcare provision environments [26]. As they can survive in inanimate material such as ventilators, benches, urine collectors, beds and defibrillators, their prevalence in hospital is becoming more frequent [25].
| Demographic characteristics | Mean ± SD (Min-Max) or n (%) | ||||
|---|---|---|---|---|---|
| Sex [n (%)] | |||||
| Male | 446 (71.02) | ||||
| Female | 182 (28.98) | ||||
| Age (years) | 63 ± 19.38 (18.00-97.00) | ||||
| < 50 | 161 (25.64) | ||||
| [50-65] | 133 (21.18) | ||||
| [65-80] | 188 (29.94) | ||||
| ≥ 80 | 146 (23.25) | ||||
| Height (cm) | 167.49 ± 7.36 (148.00-192.00) | ||||
| Body weight (kg) | 63.92 ± 7.20 (43.00-82.00) | ||||
| BMI (kg/m2) | 22.74 ± 1.59 (18.56-25.00) | ||||
| [18.5-20.5] | 61 (9.71) | ||||
| [20.5-22.4] | 144 (22.93) | ||||
| [22.5-25.0] | 423 (67.36) | ||||
| Etiology of Principal Diagnosis [n (%)] | |||||
| Respiratory diseases | 191 (30.42) | ||||
| Oncologic diseases | 116 (18.47) | ||||
| Genitourinary diseases | 81 (12.89) | ||||
| Blood diseases | 72 (11.46) | ||||
| Osteomuscular diseases | 52 (8.28) | ||||
| Infectious / Parasitic diseases | 44 (7.01) | ||||
| Lesions and Intoxications | 38 (6.06) | ||||
| Gastrointestinal diseases | 24 (3.82) | ||||
| Dermatological diseases | 10 (1.59) | ||||
| Identified Pathogens [n (%)] | |||||
| Acinetobacter baumanni | 276 (43.97) | ||||
| Pseudomonas aeruginosa | 134 (21.28) | ||||
| Klebsiella pneumonia | 103 (16.31) | ||||
| Staphylococcus spp. | 40 (6.38) | ||||
| Echerichia coli | 31 (4.96) | ||||
| Proteus mirabilis | 14 (2.13) | ||||
| Enterococcus faecalis | 9 (1.42) | ||||
| Morganella morganni | 9 (1.42) | ||||
| Nocardia | 4 (0.71) | ||||
| Pseudomonas putida | 4 (0.71) | ||||
| Serratia marcescens | 4 (0.71) |
Renal Function of Patient Population
Since the present investigation aimed at assessing the influence of renal function in the pharmacokinetics of amikacin, the population was also characterized regarding the renal disease stage (0, 1, 2, 3, 4 and 5) of each patient (Table 2). According to the international clinical practice guidelines for chronic kidney diseases from National Kidney Foundation and other international recommendations, five stages of renal lesions can be identified taking into account the GFR and clinical and biochemical data [27, 28, 29, 30]. According to National Kidney Foundation, values of GFR below 60 mL/min/1.73 m2 indicate functional abnormalities at the renal system level characterized by a progressive and irreversible loss of the glomerular, tubular and endocrine functions of the kidneys. An additional stage 0 is often mentioned and corresponds to an augmented TFG (superior to 120 mL/min/1.73m2) that may occur without renal dysfunctions; this one was herein also included as it probably would change the amikacin indisposition. At the present study, GFR is of outmost relevance as amikacin in nearly 100% eliminated by glomerular filtration and, hence, it is expected to be eliminated in a rate proportional to that of the glomerular filtration and, inevitably, the pharmacokinetics of amikacin.
| Stages of Renal | CLcr | SC | |||||||||||||||
|---|---|---|---|---|---|---|---|---|---|---|---|---|---|---|---|---|---|
| GFR | % patient | s | n | ||||||||||||||
| Diseaseaa | (mL/min) | (mg/dL) | |||||||||||||||
| 0 | > 120 mL/min/1.73m2 Increased glomerula | 39.50% | 248 | x̅ 122.0514 | x̅ 0.4910 | ||||||||||||
| σ 47.0315 | σ 0.5100 | ||||||||||||||||
| Max. 335.9221 | Max. 0.7710 | ||||||||||||||||
| Min. 10.7841 | Min. 0.1900 | ||||||||||||||||
| 1 | > 90-120 mL/min/1.73 m2 Normal glomerular filtration | 25.60% | 161 | x̅ 77.8735 | x̅ 0.6834 | ||||||||||||
| σ 47.1023 | σ 0.500 | ||||||||||||||||
| Max. 131.6225 | Max. 1.000 | ||||||||||||||||
| Min. 40.3111 | Min. 0.500 | ||||||||||||||||
| 2 | 60-89 mL/min/1.73 m2 Renal lesion with glomerular filtration lightly decreased | 18.30% | 115 | x̅ 55.6634 | x̅ 0.8741 | ||||||||||||
| σ 47.00 | σ 0.5100 | ||||||||||||||||
| Max. 107.8515 | Max. 1.3323 | ||||||||||||||||
| Min. 13.5432 | Min. 0.6418 | ||||||||||||||||
| 3 | 30-59 mL/min/1.73 m2 Renal lesion with moderately decreased glomerular filtration | 13.50% | 85 | x̅ 35.0911 | x̅ 1.400 | ||||||||||||
| σ 47.3543 | σ 0.5000 | ||||||||||||||||
| Max. 64.0742 | Max. 2.2911 | ||||||||||||||||
| Min. 4.7731 | Min. 0.9612 | ||||||||||||||||
| 4 | 15-29 mL/min/1.73 m2 Renal lesion with severely decreased glomerular filtration | 2.20% | 14 | x̅ 16.9121 | x̅ 2.5612 | ||||||||||||
| σ 25.6735 | σ 0.55 | ||||||||||||||||
| Max. 23.9542 | Max. 3.4000 | ||||||||||||||||
| Min. 14.1628 | Min. 2.000 | ||||||||||||||||
| 5 | < 15 mL/min/1.73 m2 Renal functional bankruptcy whether or not in replacement renal therapy | 0.80% | 5 | x̅ 9.3832 | x̅ 4.8313 | ||||||||||||
| σ 1.8221 | σ 1.0114 | ||||||||||||||||
| Max. 12.4335 | Max. 7.6801 | ||||||||||||||||
| Min. 7.1825 | Min. 3.3531 |
Table 2: Characterization of patient population according to the renal disease stage and respective seric creatinine and clearanc
aStages of renal diseases defined in accordance to National Kidney Foundation; Max. Maximum value; Min: minimum value; x̅: mean value; σ: standard deviation. Table 2: Characterization of patient population according to the renal disease stage and respective seric creatinine and clearance of creatinine. Herein, GFR was used to evaluate the renal disease stage of each patient (Table 2). Accordingly, it is worthy to note that approximately 25.6% of patients exhibited a normal GFR, but 40% of the population exhibited an increased GFR (corresponding to the stage 0). As a consequence of glomerular hyper filtration, augmented renal clearance refers to enhanced excretion of hydrophilic compounds (circulating metabolites, toxins, waste products, and drugs including amikacin) in comparison to renal baseline function. There is a variety of clinical conditions leading to augmented renal clearance including sepsis, trauma, particularly burn injury, pancreatitis, autoimmune disorders, ischemia, and major surgery [11, 13]. Often these conditions also lead to increased apparent volume of distribution, providing an additional Factor potentially contributing to insufficient antimicrobial concentrations. Also, as antimicrobial clearance is proportional to CLcr, patients have an increased risk to exhibit sub therapeutic concentrations.
Observing Table 2, patients from stage 0 present considerably higher values of CLcr than the remaining ones and, as amikacin is eliminated by glomerular filtration, and augmented renal clearance is likely to be an important pharmacokinetic covariate and, hence, it will be explored in the next sections. Conversely, it is evident that patients with renal function impairment and GFR lower than 60 mL/min/1.73m2, are less predominant (< 20%) and have mean values of CLcr significantly lower than those from patients with normal or enhanced GLF (Table 2). Obviously, a corresponding increment in mean, minimum and maximum values of serum creatinine is observed (Table 2), suggesting functional abnormalities at renal system level characterized by a progressive and irreversible loss of glomerular, tubular and endocrine functions of the kidneys [31]. As referred in section 2.1, GFR was estimated based on serum creatinine, requiring attention about the limitations of using this biological marker. The main concern is related to factors capable of influencing the endogenous production of creatinine, and the underlying lesions in the kidney that may not reflect the elimination of this endogenous metabolite. For instance, due to the lower lean body weight in elderly people, normal creatinine concentrations in plasma are reduced in relation to young adults, compromising the values estimated for GFR and their clinical significance.
Amikacin Plasma Concentrations of Patient Population
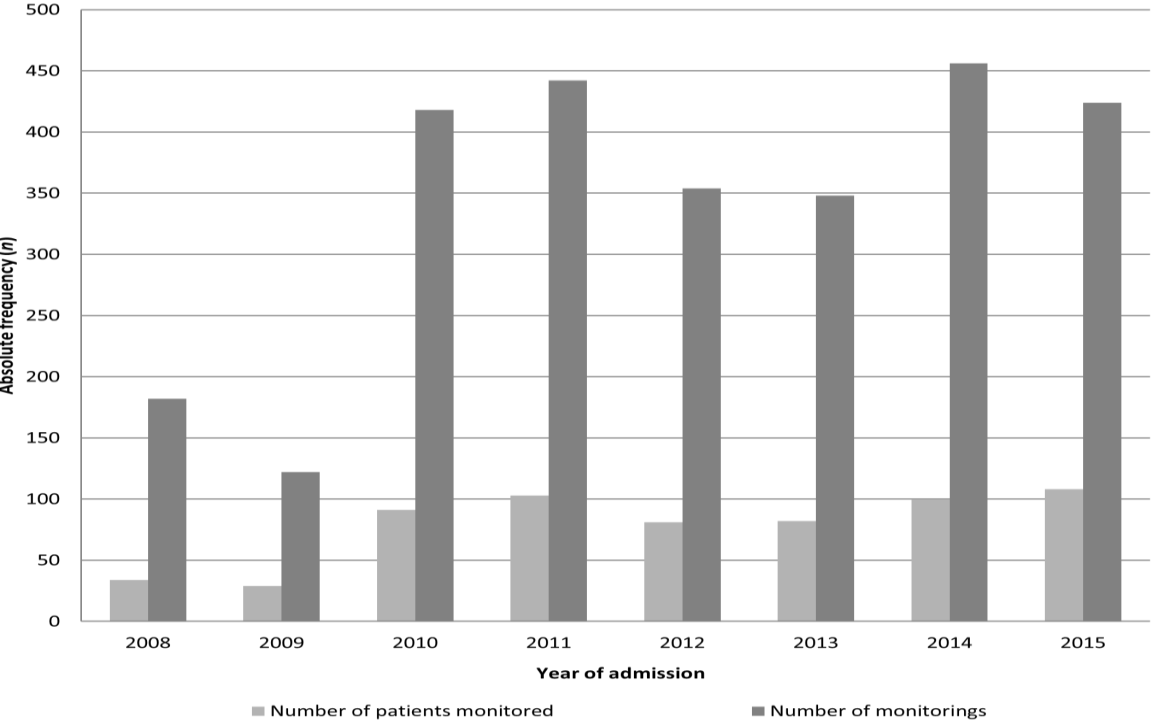
The 628 patients herein enrolled provided a total of 1373 pairs of monitoring measurements. Figure 1 describes the evolution of the number of patients submitted to PDM and the correspondent number of PDM by each year of admission. Their increment over the years is evident and it probably resulted from the fact that the micro-organisms most frequently isolated in this population were Acinetobacter baumannii, Pseudomonas aeruginosa and Klebsiella pneumonia, which started approximately in 2010 to develop multiple resistances against other antibiotics, requiring amikacin administration. In an attempt of evaluating whether the initial doses and following adjustments allowed the achievement of therapeutic Cmax concentrations and avoided toxic Cmin, PDC were herein analyzed in accordance to the type of the administration regime: EDI and MDD.
that bacterial eradication increases as the drug plasma concentration rises. As EDI regimens uses higher doses compared to the smaller individual doses in MDD, the probability of reaching Cmax/MIC ratios of at least 8 is increased, as well as an effective therapy. In literature is currently uncountable that the concentration-dependent response supports the use of higher doses to attain peak concentrations [13, 34, 35, 36]. On the other hand, as toxicity relates to the Area Under the time vs. concentration Curve (AUC), which is reflected by the trough plasma concentration (Cmin), and to avoid adaptive resistance, those higher doses should be combined with extended dosing intervals [13, 35, 36]. In this context, several studies evaluating EDI regimens in adults have demonstrated increased bactericidal activity and trends toward decreased amino glycoside toxicity when intervals between dose administrations are extended [32, 37, 38, 39].
Additionally, all amino glycosides exhibit a post- antibiotic effect, which results from drug binding to the bacterial 30S ribosomal subunit that result in deficient synthesis of bacterial proteins. This longer drug-free period of EDI in relation to MDD reduces/reverses the adaptive resistance form that is developed after initial exposure of bacteria to amikacin; on the other hand, during that period, the post-antibiotic effect is guaranteed, which means that suppression of bacterial growth continues after drug administration stops and plasma concentrations are below the MIC. Employing distinct administration regimens will obviously require different therapeutic plasma ranges regarding Cmax and Cmin. Therefore, according to the international guidelines and Portuguese population, the standard therapeutic range concentrations should be [14, 40]:
- MDD → Cmax: 30-40 μg/mL; Cmin: 8-10 μg/mL
- EDI → Cmax: 50-64 μg/mL; Cmin: < 3 μg/mL
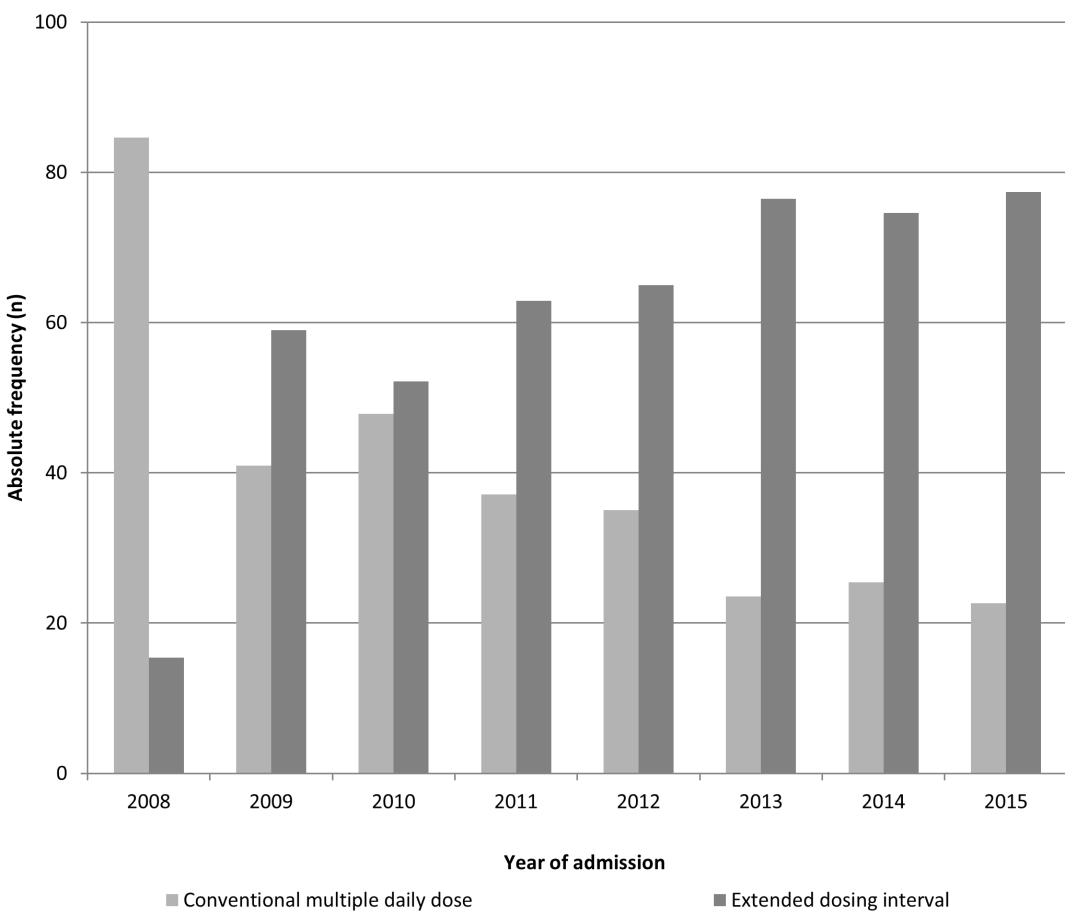
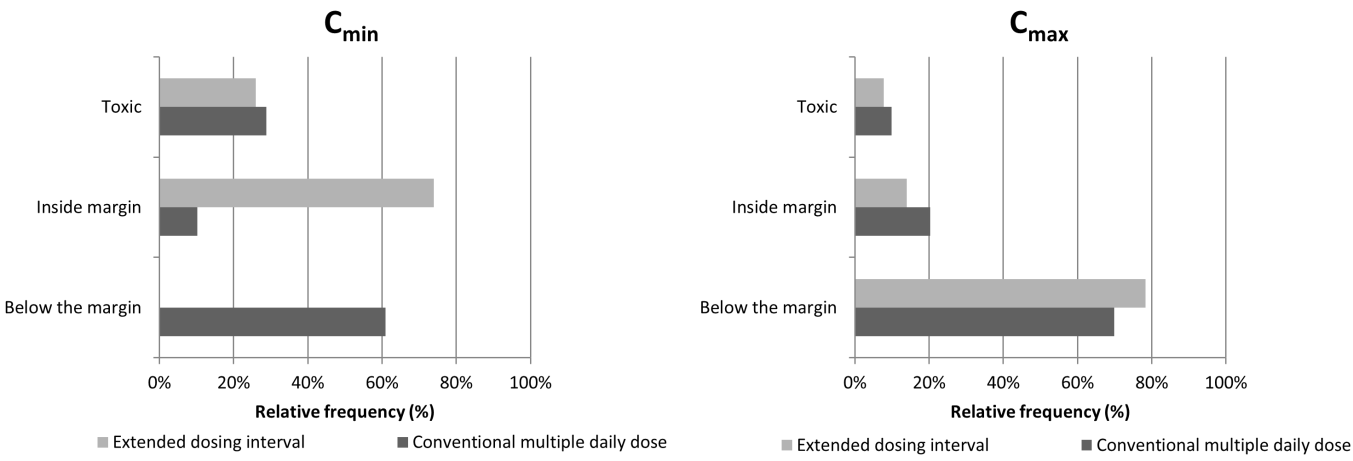
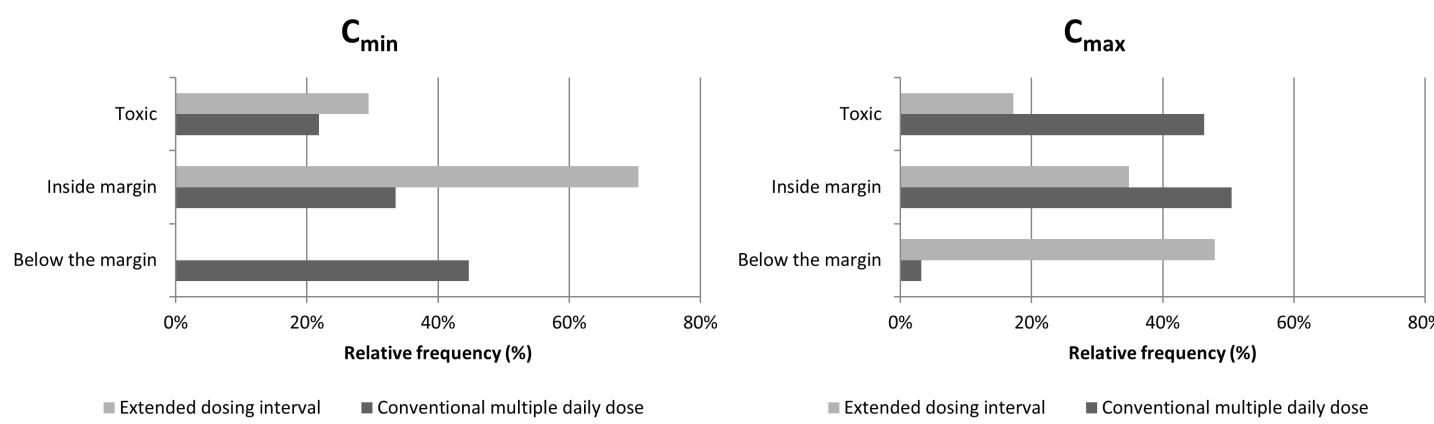
Figure 2: Absolute frequency (n) regarding the amikacin regimen that was instituted (extended drug interval versus multiple daily dose) between 2008 and 2015 Under this scope, it was decided to assess whether the concentrations measured in plasma samples from the patients within the present study were in or out of those standardized in literature. This evaluation considered the regimens “a priori” and “a posteriori” and the results are represented in Figures 3 and 4, respectively. Accordingly, it is evident that the first dose administered to the patients is in at least in 70% of the clinical situations originates sub therapeutic Cmax, independently of the administration regimen type (MDD or EDI). On the other hand, considering the concentrations achieved after clinical adjustment (Figure 4), it is noteworthy that the incidence of sub therapeutic values of Cmax reduced considerably in MDD (≈ 3.19 %) ant almost 50% regarding the EDI. This clearly corroborates that amikacin pharmacokinetic monitoring has advantages particularly in respect to the decrease of suboptimal concentrations which are not effective and only contribute to increase the bacterial resistance against the drug.
It is important to state that a very wide variety of doses daily administered was identified both in MDD and EDI regimens due to the intra- and inter-individual variability which require the individualization of the therapy. Thus, observing Table 3, it is evident that the doses administered are substantially higher in young adults than those administered in elderly, probably because the former exhibit an increased value of CLcr, suggesting that amikacin is faster eliminated. On the other hand, it is important to emphasize that although Cmax did not varied substantially and mean values kept in therapeutic ranges in all age groups, the same did not occur when considering Cmin. In fact, it is evident that elderly people cannot eliminate amikacin as faster as the young patients and the drug concentrates in the organisms achieving Cmin higher than 3 μg/mL even after smaller doses have been administered. In addition, Table 4 exhibits that the dose of amikacin must be decreased in patients with renal function impairment (GFR < 60 mL/min 1.73 m2) in order to achieve therapeutic Cmax levels. However, the correspondent values found for Cmin must be highlighted as they are substantially higher than those found in non-renal patients (7.1521 ± 6.5612, 4.2814 ± 4.2732 and 3.1452 ± 3.8743 μg/mL; Table 4), emphasizing that renal patients are more susceptible to accumulate amikacin, which may further impair their renal function.
essential to define the dose to be administered and the interval to be instituted between two consecutive administrations taking into account the capacity of each particular patient to eliminate amikacin [41]. Thus, in the following section, pharmacokinetic behaviour of amikacin was estimated for each patient and compared in accordance to their age and renal function.
| Weight | Dose | Cmax | Cmin | ||||||||||||||||||||||
|---|---|---|---|---|---|---|---|---|---|---|---|---|---|---|---|---|---|---|---|---|---|---|---|---|---|
| n | Age (years) | Height (cm | ) | C | Lcr (mL/min | ) | |||||||||||||||||||
| (kg) | (mg/kg/di) | (μg/mL) | (μg/mL) | ||||||||||||||||||||||
| 18-34 years | 37 | x̅ | 28.19 | 63.7216 | 167.3225 | 24.3452 | 127.1923 | 43.1885 | 1.8214 | ||||||||||||||||
| σ | 3.56 | 7.3327 | 7.921 | 12.8785 | 14.7942 | 17.7936 | 2.1532 | ||||||||||||||||||
| Max. | 34 | 79 | 181 | 64.5212 | 149.9853 | 97.7 | 12.9 | ||||||||||||||||||
| Min. | 23 | 51.4 | 149 | 10.4236 | 29.5625 | 8.8 | 0.1 | ||||||||||||||||||
| 35-49 years | 120 | x̅ | 42.18 | 62.5363 | 166.8118 | 23.9412 | 111.4036 | 39.6345 | 3.3513 | ||||||||||||||||
| σ | 4.6 | 6.2941 | 5.9836 | 14.1125 | 24.6885 | 15.9326 | 4 | ||||||||||||||||||
| Max. | 49 | 76 | 180 | 85.7136 | 151.9742 | 91.6 | 23.3 |
Table 3: Characterization of each sub-population defined in accordance to patient’s age.
| Min. | 35 | 45 | 152 | 4.5541 | 57.3832 | 12.1 | 0.1 | ||
|---|---|---|---|---|---|---|---|---|---|
| 50-64 years | 118 | x̅ | 59.19 | 63.1415 | 166.7325 | 17.6312 | 92.2715 | 43.2242 | 3.0431 |
| σ | 17.31 | 8.7112 | 8.4314 | 4.9634 | 27.0323 | 19.6534 | 3.5425 | ||
| Max. | 64 | 80 | 182 | 33.3331 | 150.1912 | 128.4 | 25.8 | ||
| Min. | 50 | 45 | 150 | 6.6712 | 39.2044 | 12.9 | 0.05 | ||
| 65-79 years | 294 | x̅ | 72.78 | 63.2923 | 166.7647 | 18.0236 | 86.3126 | 40.3427 | 4.8421 |
| σ | 4.32 | 7.0901 | 7.3926 | 7.8001 | 25.2614 | 17.0936 | 5.1201 | ||
| Max. | 79 | 80 | 185 | 61.5443 | 147.9426 | 107 | 44.6 | ||
| Min. | 65 | 43 | 148 | 4.5542 | 36.1645 | 8.7 | 0.05 | ||
| >80 years | 224 | x̅ | 85.48 | 63.3012 | 165.9441 | 15.3723 | 67.8263 | 40.7345 | 6.4432 |
| σ | 4.44 | 7.4332 | 7.6823 | 5.6645 | 23.1845 | 16.8421 | 5.3481 | ||
| Max. | 97 | 77 | 185 | 37.5 | 147.3823 | 146.3 | 33 | ||
| Min. | 80 | 45 | 145 | 4.5712 | 33.5114 | 13.1 | 0.05 |
Table 4: Characterization of each sub-population defined in accordance to patient’s age.
Max: maximum value; Min: minimum value; mean value; σ: standard deviation Table 3: Characterization of each sub-population defined in accordance to patient’s age.
| Age | Weight | Height | Dose | CLcr | Cmax | Cmin (μg/mL) | |||||||||||||||||
|---|---|---|---|---|---|---|---|---|---|---|---|---|---|---|---|---|---|---|---|---|---|---|---|
| GFR | |||||||||||||||||||||||
| (years) | (kg) | (cm) | (mg/kg/da) | (mL/min) | (μg/mL) | ||||||||||||||||||
| <60 mL/min/1.73m2 | x̅ | 79.6 | 61.1942 | 163.0621 | 15.3901 | 48.5516 | 44.8521 | 7.1521 | |||||||||||||||
| σ | 10.97 | 7.4442 | 7.6123 | 7.1023 | 7.0737 | 17.3432 | 6.5612 | ||||||||||||||||
| Max. | 97 | 75 | 182 | 54.5523 | 59.9241 | 100 | 44.6012 | ||||||||||||||||
| Min. | 37 | 43 | 148 | 4.5501 | 33.5123 | 14.1025 | 0.5 | ||||||||||||||||
| ≥60 e <120 mL/min/1.73m2 | x̅ | 67.97 | 63.1112 | 166.6226 | 18.2832 | 87.7132 | 39.9641 | 4.2814 | |||||||||||||||
| σ | 15.81 | 7.4312 | 7.4912 | 7.8801 | 17.2652 | 17.3163 | 4.2732 | ||||||||||||||||
| Max. | 96 | 80 | 185 | 64.2915 | 119.6236 | 146.3026 | 34.3012 | ||||||||||||||||
| Min. | 23 | 45 | 149 | 4.5501 | 60.0124 | 8.7027 | 0.05 | ||||||||||||||||
| ≥120 mL/min/1.73m2 | x̅ | 52.11 | 65.772 | 170.4501 | 22.4821 | 134.02 | 40.2136 | 3.1452 | |||||||||||||||
| σ | 17.14 | 6.1511 | 4.9901 | 13.1032 | 8.6013 | 16.9245 | 3.8743 | ||||||||||||||||
| Max. | 88 | 79 | 181 | 85.7114 | 151.9723 | 93.7031 | 23.3031 | ||||||||||||||||
| Min. | 23 | 54.5 | 160 | 7.6923 | 120.0421 | 8.8045 | 0.05 |
Table 5: Characterization of each sub-population defined in accordance to patient’s glomerular filtration rate (GFR).
Max: maximum value; Min: minimum value; x̅: mean value; σ: standard deviation Table 4: Characterization of each sub-population defined in accordance to patient’s glomerular filtration rate (GFR).
Amikacin Pharmacokinetics of Patient Population
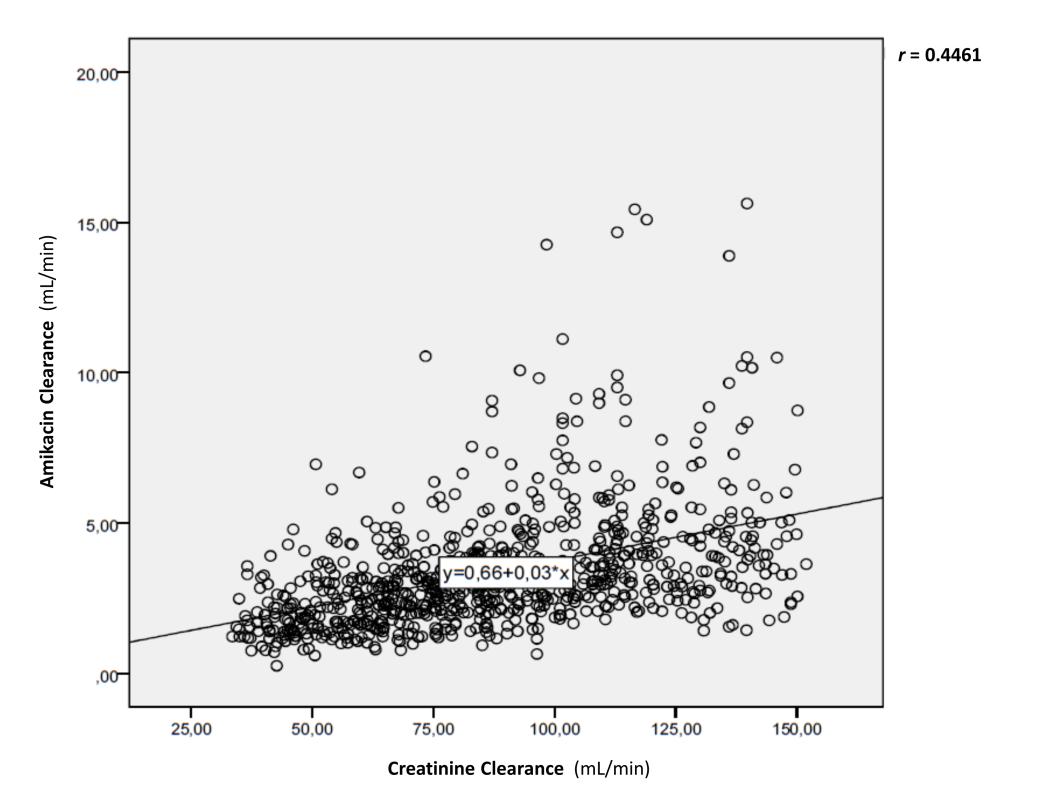
In order to estimate the principal pharmacokinetic parameters of amikacin, including apparent volume of distribution (Vd), elimination constant (ke), t1/2 and clearance of amikacin, PKS and the Sawchuk and Zaske methods, were employed and the parametric t-Student test, for two paired specimens, was conducted to verify whether there were differences amongst the values achieved by each model. For all the pharmacokinetic parameters, were always higher than 0.05, suggesting that no statistically significant differences existed between both methods. Sawchuk and Zaske model was, hence, selected to estimate the pharmacokinetic parameters of amikacin in the present study population. One of the principal aims of the present study included the evaluation of the correlation between changes in CLcr and amikacin pharmacokinetic parameters in order to identify the major determinants of those changes. Thus, the influence of several independent variables (age, weight, BMI, CLcr) in the values of the pharmacokinetic parameters of amikacin was investigated; those with higher Pearson’s correlation factor are represented in Figures 5 and 6. Accordingly it is evident the negative influence of age in clearance of amikacin; this means that the elimination rate of the amino glycoside tends to decrease as the patient’s age enhances, contributing to an increased t1/2 and higher risk of drug accumulation. On the other hand, Figure 6 shows the positive correlation of dispersion pattern between the clearance of amikacin and CLcr, which characterizes the renal function impairment. This means that, the clearance of amikacin decreases as the CLcr diminishes. Thus, the aforementioned correlation between amikacin’s clearance, age and CLcr, together with the differences found in section 3.3 regarding the doses administered and the correspondent plasma concentrations achieved, led us to assess the amikacin pharmacokinetic parameters in specific subpopulations taking into account the age and the renal functional of the initial population. These parameters are described in Tables 5 and 6, respectively; while table 7 takes into account the influence of both characteristics simultaneously. Nevertheless the limitations of using serum concentration of creatinine as a biomarker for renal function in the elderly, it is particularly important when evaluating amikacin pharmacokinetics because this drug is almost exclusively eliminated by renal glomerular filtration. Herein, based on serum concentrations of creatinine, CLcr and GFR were estimated and allowed the creation of sub-populations with distinct renal function and ages. After demonstrating normality and homogeneity of variances, the ANOVA test was used to assess the existence of statistical differences between the pharmacokinetic parameters found for the distinct subpopulations. The aforementioned groups presented statistically significant differences considering ke, t1/2 and CL (p < 0.01), but not for the Vd (p > 0.05). With regard to t1/2, the average value presented for the sub-population with GFR lower than 60 mL/min/1.73 m2 is considerably higher than the reference value (2-3 hours). The patients of this sub-population were subjected to an EDI regimen, and, therefore, the distribution phase tends to be more prolonged, originating a higher t1/2 which will require a longer period of time between two consecutive administrations. On the other hand, in accordance to Table 7, as the age within each sub- population increases, amikacin clearance decreases ant t1/2. For patients with renal impairment higher doses were required as age increased as well as ampler administration intervals were also needed. Thus, the existence of renal lesions associated with the advanced age of the population reduces the individual capacity to eliminate amikacin. In opposition, nor age or CLcr (GFR) seemed to influence the Vd of the drug, which seems to remain independent, suggesting the existence of other factors path physiological, namely fluid-therapy, administration of diuretic drugs, hyperventilation. Thus, renal function and age must be taken into account when prescribing amikacin and optimizing its posology.
| Age | Dose (mg/kg/day) | Vd (L/kg) | ke (h-1) | CL (mL/min) | t1/2 (h) | |||||||||||||
| 18-34 years | x̅ | 17.5564 | 0.3812 | 0.2212 | 5.0212 | 3.82 | ||||||||||||
| σ | 5.6142 | 0.1521 | 0.1135 | 2.9532 | 1.58 | |||||||||||||
| Max. | 36 | 0.4332 | 0.2641 | 6.0012 | 4.35 | |||||||||||||
| Min. | 3 | 0.3327 | 0.1821 | 4.0427 | 3.3 | |||||||||||||
| 35-49 years | x̅ | 16.9153 | 0.3715 | 0.2126 | 4.5321 | 4.24 | ||||||||||||
| σ | 5.9152 | 0.1214 | 0.1142 | 2.4625 | 2.07 | |||||||||||||
| Max. | 59.8802 | 0.4012 | 0.2241 | 4.9823 | 4.61 | |||||||||||||
| Min. | 7 | 0.3512 | 0.1932 | 4.0926 | 3.86 | |||||||||||||
| 50-64 years | x̅ | 5.6391 | 0.3712 | 0.1625 | 3.5839 | 5.07 | ||||||||||||
| σ | 4.9609 | 0.1023 | 0.0812 | 2.0027 | 1.99 | |||||||||||||
| Max. | 32 | 0.3823 | 0.1832 | 3.9526 | 5.43 | |||||||||||||
| Min. | 4 | 0.3514 | 0.1541 | 3.2278 | 4.71 | |||||||||||||
| 65-79 years | x̅ | 15.3289 | 0.4012 | 0.142 | 3.2715 | 6.19 | ||||||||||||
| σ | 6.0371 | 0.1614 | 0.0732 | 1.8752 | 3.19 | |||||||||||||
| Max. | 54 | 0.4136 | 0.1541 | 3.4936 | 6.55 | |||||||||||||
| Min. | 1.5 | 0.3726 | 0.1325 | 3.0627 | 5.82 | |||||||||||||
| ≥ 80 years | 14.5822 | 0.3823 | 0.1237 | 2.5136 | 7.52 | |||||||||||||
| σ | 8.618 | 0.1412 | 0.0739 | 1.2978 | 4.19 | |||||||||||||
| Max. | 32 | 0.4025 | 0.1348 | 2.6832 | 8.07 | |||||||||||||
| Min. | 5 | 0.3623 | 0.1142 | 2.3415 | 6.96 |
Table 6: Amikacin pharmacokinetic parameters achieved for each sub-population defined in accordance to patients’ age.
CL: clearance; Ke: elimination constant: Max: maximum value; Min: minimum value; t1/t2: half-life time; Vd: apparent volume of distribution; x̅: mean value; σ: standard deviation Table 5: Amikacin pharmacokinetic parameters achieved for each sub-population defined in accordance to patients’ age.
<60 mL/min/1.73m2 ≥60 e <120 mL/min/1.73m2 ≥120 mL/min/1.73m2 CL: clearance; Ke: elimination constant: Max: maximum value; Min: minimum value; t1/t2: half-life time; Vd: apparent volume of distribution; x̅: mean value; σ: standard deviation Table 6: Pharmacokinetic parameters of amikacin for each subpopulation created in accordance to patient’s renal function given by glomerular filtration rate (GFR) Dose (mg/kg/day) Vd (L/kg) ke (h-1) CL (mL/min) t1/2 (h) x̅ 10.8626 0.3812 0.1021 2.1632 8.38 σ 5.438 0.1634 0.05 1.1241 4.22 Max. 32 1.1524 0.4214 6.9532 23.8 Mín. 1.5 0.0923 0.0332 0.2627 1.6 x̅ 16.1710 0.3836 0.1621 3.4634 5.64 σ 7.6681 0.1412 0.0934 1.9901 3.03 Max. 64 1.6237 0.7414 15.4436 28 Mín. 4 0.1024 0.0231 0.652 0.9 x̅ 19.7387 0.3725 0.1941 4.5014 4.47 σ 8.8931 0.1124 0.1032 2.3941 1.92 Max. 84 0.8414 0.5942 15.6321 11.8 Mín. 3 0.1204 0.0634 1.4342 1.2
| GFR (mL/min/1.73m2) | Age (years) | Dose (mg/kg/day) | t /t (h) 1 2 | Vd (L/kg) | CL (mL/min) | ||||||||||||
| <60 | 18-34 | - | - | - | - | ||||||||||||
| 35-49 | - | - | - | - | |||||||||||||
| 50-64 | 10.35 | 6.38 | 0.3514 | 2.5812 | |||||||||||||
| 65-79 | 11.58 | 8.65 | 0.4121 | 2.2434 | |||||||||||||
| >80 | 13.8 | 8.6 | 0.3804 | 2.0615 | |||||||||||||
| ≥60 and <120 | 18-34 | 16.38 | 3.68 | 0.4021 | 4.3335 | ||||||||||||
| 35-49 | 15.32 | 4.22 | 0.3734 | 4.3514 | |||||||||||||
| 50-64 | 16.02 | 5.01 | 0.3732 | 3.5234 | |||||||||||||
| 65-79 | 15.92 | 5.75 | 0.4014 | 3.4902 | |||||||||||||
| >80 | 14.37 | 6.82 | 0.3832 | 2.7932 | |||||||||||||
| ≥120 | 18-34 | 17.93 | 3.9 | 0.3732 | 5.4047 | ||||||||||||
| 35-49 | 18.11 | 4.17 | 0.3814 | 4.8525 | |||||||||||||
| 50-64 | 16.7 | 4.18 | 0.3632 | 4.6936 | |||||||||||||
| 65-79 | 16.56 | 5.43 | 0.3742 | 3.3457 | |||||||||||||
| >80 | 15.35 | 5 | 0.2827 | 3.5737 |
Table 7: Mean values of the pharmacokinetic parameters of amikacin taking into account the renal function, given by glomerular fi
Conclusion
Despite the introduction of new antimicrobial agents, amikacin has maintained an important role in the treatment of severe bacterial infections. In the present investigation, this was especially true for multiple drug- resistant pathogens, such as Acinetobacter baumannii, and Klebsiella pneumonia. Optimal dosage of amikacin is complicated by its narrow therapeutic window, requiring PDM to predict drug exposure when attempting to reduce the risk of nephrotoxicity. In the present study this was clearly demonstrated for elderly and renal patients. Although the rationale for EDI regimen was herein clearly preferred relatively to EDI, the present study demonstrated a wide range regarding the dose administered due to the significant intra- and inter-individual variability found. At the end, it was herein demonstrated, that as age increases and/or renal function decreases, the clearance of amikacin diminished and the t1/2 augmented, although no differences were found on the Vd. This suggests that in elderly and renal patients, doses of amikacin should be lower than those administered to young adults with no commitment of renal activity. Nevertheless, administration interval may have to be prolonged to guarantee no toxic accumulation of amikacin.
References
-
de With K, Allerberger F, Amann S, Apfalter P, Brodt HR, et al. (2016) Strategies to enhance rational use of antibiotics in hospital: a guideline by the German Society for Infectious Diseases_._ Infection 44(3): 395-439.
-
Salehifar E, Rafati MR (2015) Extended-Interval Dosing of Aminoglycosides in Pediatrics: A Narrative Review. Journal of Pediatrics Review 3(2): e2652.
-
Llanos-Paez CC, Staatz CE, Lawson R, Hennig S (2017) A Population Pharmacokinetic Model of Gentamicin in Pediatric Oncology Patients To Facilitate Personalized Dosing. Antimicrob Agents Chemother 61(8): e00205-17.
-
Germovsek E, Kent A, Metsvaht T, Lutsar I, Klein N, et al. (2016) Development and Evaluation of a Gentamicin Pharmacokinetic Model That Facilitates Opportunistic Gentamicin Therapeutic Drug Monitoring in Neonates and Infants_._ Antimicrob Agents Chemother 60(8): 4869-77.
-
Sime FB, Roberts MS, Tiong IS, Gardner JH, Lehman S et al. (2015) Can therapeutic drug monitoring optimize exposure to piperacillin in febrile neutropenic patients with haematological malignancies? A randomized controlled trial. J Antimicrob Chemother 70(8): 2369-2375.
-
Milovic M, Popov I, Jezdic S, Stojanovic S, Stankovic V, et al. (2010) Monitoring levels of nephrotoxicity of different aminoglycosides during febrile neutropenia caused by nephrotoxic chemotherapy: a single centre study. J Buon 15(2): 297-302.
-
Hayashi Y, Lipman J, Udy AA, Ng M, McWhinney B, et al. (2013) beta-Lactam therapeutic drug monitoring in the critically ill: optimising drug exposure in patients with fluctuating renal function and hypoalbuminaemia_._ Int J Antimicrob Agents 41(2): 162-166.
-
Casu GS, Hites M, Jacobs F, Cotton F, Wolff F, et al. (2013) Can changes in renal function predict variations in beta-lactam concentrations in septic patients? Int J Antimicrob Agents 42(5): 422-428.
-
Takahashi Y, Takesue Y, Takubo S, Ishihara M, Nakajima K, et al. (2013) Preferable timing of therapeutic drug monitoring in patients with impaired renal function treated with once-daily administration of vancomycin. J Infect Chemother 19(4): 709-716.
-
Puttonen J, Kantele S, Kivikko M, Häkkinen S, Harjola VP, et al. (2007) Effect of severe renal failure and haemodialysis on the pharmacokinetics of levosimendan and its metabolites_._ Clin Pharmacokinet 46(3): 235-246.
-
Kato H, Hagihara M, Hirai J, Sakanashi D, Suematsu H, et al. (2017) Evaluation of Amikacin Pharmacokinetics and Pharmacodynamics for Optimal Initial Dosing Regimen_._ Drugs RD 17(1): 177-187.
-
Roberts JA, Norris R, Paterson DL, Martin JH (2012) Therapeutic drug monitoring of antimicrobials_._ Br J Clin Pharmacol 73(1): 27-36.
-
Germovsek E, Barker CI, Sharland M (2017) What do I need to know about aminoglycoside antibiotics? Arch Dis Child Educ Pract Ed 102(2): 89-93.
-
Turnidge J (2003) Pharmacodynamics and dosing of aminoglycosides. Infect Dis Clin North Am 17(3): 503-528.
-
Rea RS, Capitano B, Bies R, Bigos KL, Smith R, et al. (2008) Suboptimal aminoglycoside dosing in critically ill patients_._ Ther Drug Monit 30(6): 674- 681.
-
Blot SI, Pea F, Lipman J (2014) The effect of pathophysiology on pharmacokinetics in the critically ill patient--concepts appraised by the example of antimicrobial agents. Adv Drug Deliv Rev 77: 3-11.
-
Udy AA, Roberts JA, Boots RJ, Paterson DL, Lipman J (2010) Augmented renal clearance: implications for antibacterial dosing in the critically ill_._ Clin Pharmacokinet 49(1): 1-16.
-
Cockcroft DW, Gault MH (1976) Prediction of creatinine clearance from serum creatinine. Nephron 16(1): 31-41.
-
Schwandt A, Denkinger M, Fasching P, Pfeifer M, Wagner C, et al. (2017) Comparison of MDRD, CKD- EPI, and Cockcroft-Gault equation in relation to measured glomerular filtration rate among a large cohort with diabetes. J Diabetes Complications 31(9): 1376-1383.
-
Levey AS, Stevens LA, Schmid CH, Zhang YL, Castro AF, et al. (2009) A new equation to estimate glomerular filtration rate. Ann Intern Med 150(9): 604-612.
-
Sawchuk RJ, Zaske DE (1976) Pharmacokinetics of dosing regimens which utilize multiple intravenous infusions: gentamicin in burn patients. J Pharmacokinet Biopharm 4(2): 183-195.
-
Nuttall FQ (2015) Body Mass Index: Obesity, BMI, and Health: A Critical Review. Nutrition Today 50(3): 117-128.
-
Direção Geral Da Saúde (2011) Orientação nº 29/2011 - Princípios Gerais de Antibioterapia.
-
Freifeld AG, Bow EJ, Sepkowitz KA, Boeckh MJ, Ito JI, et al. (2011) Clinical practice guideline for the use of antimicrobial agents in neutropenic patients with cancer: 2010 update by the infectious diseases society of america. Clin Infect Dis 52(4): e56-93.
-
Perez F, Endimiani A, Bonomo RA (2008) Why are we afraid of Acinetobacter baumannii? : Expert Rev Anti Infect Ther 6(3): 269-271.
-
Perez F, Hujer AM, Hujer KM, Decker BK, Rather PN, et al. (2007) Global challenge of multidrug-resistant Acinetobacter baumannii_._ Antimicrob Agents Chemother 51(10): 3471-3484.
-
Bailie GR, Uhlig K, Levey AS (2005) Clinical practice guidelines in nephrology: evaluation, classification, and stratification of chronic kidney disease. Pharmacotherapy 25(4): 491-502.
-
National Kidney Foundation (2002) Clinical Practice Guidelines For Chronic Kidney Disease: Evaluation, Classification and Stratification. Am J Kidney Dis 39(2): S1-266.
-
Levey AS, Coresh J, Balk E, Kausz AT, Levin A, et al. (2003) National Kidney Foundation practice guidelines for chronic kidney disease: evaluation, classification, and stratification. Ann Intern Med 139(2): 137-147.
-
Goolsby MJ (2002) National Kidney Foundation Guidelines for chronic kidney disease: evaluation, classification, and stratification_._ J Am Acad Nurse Pract 14(6): 238-242.
-
Seeley RR, Aparelho Urinário (2007) Lusodidacta. Pp: 959-991.
-
Rodriguez JC, Schoenike S, Scott GB, Rossique- Gonzalez MT, Gomez-Marin O (2003) An Evaluation of Gentamicin, Tobramycin, and Amikacin Pharmacokinetic/Pharmacodynamic Parameters in HIV-Infected Children. J Pediatr Pharmacol Ther 8(4): 274-283.
-
Jenkins A, Thomson AH, Brown NM, Semple Y, Sluman C, et al. (2016) Amikacin use and therapeutic drug monitoring in adults: do dose regimens and drug exposures affect either outcome or adverse events? A systematic review_._ J Antimicrob Chemother 71(10): 2754-2759.
-
Smits A, Kulo A, van den Anker J, Allegaert K (2017) The amikacin research program: a stepwise approach to validate dosing regimens in neonates_._ Expert Opinion on Drug Metabolism & Toxicology 13(2): 157-166.
-
Samardzic J, Allegaert K, Wilbaux M, Pfister M, van den Anker JN (2016) Quantitative clinical pharmacology practice for optimal use of antibiotics during the neonatal period. Expert Opin Drug Metab Toxicol 12(4): 367-375.
-
Touw DJ, Westerman EM, Sprij AJ (2009) Therapeutic drug monitoring of aminoglycosides in neonates_._ Clin Pharmacokinet 48(2): 71-88.
-
Najmeddin F; Ahmadi A, Mahmoudi L, Sadeghi K, Khalili H, et al. (2014) Administration of higher doses of amikacin in early stages of sepsis in critically ill patients_._ Acta Med Iran 52(9): 703-709.
-
Zazo H, Martin-Suarez A, Lanao JM (2013) Evaluating amikacin dosage regimens in intensive care unit patients: a pharmacokinetic/pharmacodynamic analysis using Monte Carlo simulation. Int J Antimicrob Agents 42(2): 155-160.
-
Freeman CD, Nicolau DP, Belliveau PP, Nightingale CH (1997) Once-daily dosing of aminoglycosides: review and recommendations for clinical practice. J Antimicrob Chemother 39(6): 677-686.
-
Stanford Hospital Clinics Aminoglycoside Dosing Guidelines. 2013.
-
Huth ME, Ricci AJ, Cheng AG (2011) Mechanisms of aminoglycoside ototoxicity and targets of hair cell protection. Int J Otolaryngol 19.
- Effects of 5-HTP and Melatonin on the Sleep Cycle of Medical Students
- Adsorption of Bisphenol A on NH4OH- Modified Rice Husk and Sugar Cane Bagasse Biochar
- Comparative Assessment of the Reinforcement Efficiency of Palm Fruit Fibre and Coconut Fibre in High Density Polyethylene (HDPE) Matrix Composite
- Importance of Bio Compounds Naturally Present in Food with Functionality in Animal Metabolism
- Sub-Acute Study on the Cardiotoxic Effects of Monosodium Glutamate Ingestion in Albino Rat
- Weight Management and Its Natural Solutions: A Review