Comparative Bioequivalence Studies of Two Metformin Extended- Release Formulations in Healthy Thai Volunteers
Metformin is a first-line treatment for type 2 diabetic mellitus commonly used as a monotherapy or in a combination with other antidiabetic drugs. To control blood glucose levels, patients should be able to access to the treatment continuously. Thus, the Government Pharmaceutical Organization (GPO) had developed a generic metformin extended-release formulation as a low-cost alternative for patients and physicians. Two bioequivalence studies were conducted under fasting and fed conditions to compare the rate and extent of absorption between the test (Metformin XR 1000 mg) and reference (Glucophage XR 1000 mg) formulations. The study design for both studies was comparative randomized, open-label, single-dose, two-way crossover. Twenty-four subjects and fourteen eligible subjects were enrolled in the single-dose fasting and fed studies, respectively. Plasma concentrations of metformin were determined using a validated liquid chromatography tandem mass spectrometry method. The primary pharmacokinetics parameters including AUC0-tlast, AUC0−∞ and Cmax were statistically compared. The 90% confidence intervals of the geometric least squares mean ratio of log-transformed AUC0-tlast, AUC0−∞ and Cmax between the formulations were within 80.00-125.00% of bioequivalence criteria for both fasting and fed studies. The pharmacokinetic parameters following oral administration under fasting and fed conditions were comparable suggesting insignificant food effect on the absorption. The safety of metformin extended-release formulations was evaluated in healthy Thai subject. The test and reference products were well tolerated by the study subjects and no serious adverse events were reported in both studies. Based on the statistical indices, it was concluded that two metformin extended-release formulations were bioequivalent.
Introduction
Metformin is an anti-hyperglycemic agent which belongs to a class of medications called biguanides. It is commonly used as a first-line treatment for type 2 diabetic mellitus (DM) as a monotherapy or in a combination with other antidiabetic agents to achieve target glycemic control [1]. Metformin affects glucose metabolism via AMP-activated protein kinase (AMPK) activation in the liver and intestine [2], thus reducing hepatic glucose production, decreasing intestinal absorption of glucose and as well as enhancing insulin sensitivity [3, 4].
Metformin is mainly absorbed in the small intestine with oral bioavailability about 55%. It does not bind to plasma protein and is considerably distributed to tissues after oral administration. Food slightly decreases metformin absorption, however, taking with meals is recommended to reduce gastrointestinal side effects [5]. Metformin is excreted unchanged in the urine via tubular secretion accounted for approximately 79% of the dose whereas it does not undergo hepatic metabolism or biliary excretion [3]. Thus, dose adjustment is required in patients with renal impairment.
Metformin tablets are available as immediate-release and extended-release formulations. Both formulations have shown similar systemic exposure under the same total daily dose. However, an extended-release formulation seems to improve gastrointestinal tolerability and patient compliance [6]. As it is suggested that type 2 DM patients should continue the treatment as long as it is tolerated and not contraindicated [1], accessibility to continued-use medication is essential. The Government Pharmaceutical Organization (GPO) had developed a generic metformin extended-release formulation (Metformin XR 1000 mg) as a low-cost alternative for patients and physicians. The bioequivalence studies were conducted under fasting and fed states to compare the pharmacokinetic parameters describing the rate and extent of absorption between the test (Metformin XR 1000 mg, GPO) and reference (Glucophage XR 1000 mg, Merck Sante s.a.s) formulations. The bioequivalence would support interchangeability and registration of the generic product.
Materials and Methods
Study Products
The study products used in both studies were metformin hydrochloride 1000 mg extended-release tablets. The test product was Metformin XR 1000 mg (Batch number: S580238, manufactured by the Government Pharmaceutical Organization, Thailand) and the reference product was Glucophage XR 1000 mg (Batch number: Y00742, manufactured by Merck Sante s.a.s., France).
Study Subjects
Sample size calculation was based on T/R ratio ranging from 0.95-1.05 and 20% dropouts. Bioequivalence would be established within the acceptance limit of 80.00-125.00% with a power of at least 90% and a significant level of 5% [7]. The sample size for the fasting study considered approximately 18% intra-subject variability [8] which yielded a sample size of 24 subjects including dropouts. In contrast, the sample size for the fed study was calculated considering 12.7% intra-subject variability for Cmax obtained from the fasting study. Therefore, total sample size of 14 subjects were enrolled for concluding bioequivalence in the fed study.
The subjects enrolled in the single-dose fasting and fed studies were healthy Thai males and females at the age between 18 and 55 years, having a body mass index (BMI) between 18.0 and 25.0 kg/m2. Enrolled subjects were screened for healthiness through medical history, physical and laboratory examinations. In case of female subjects, they were not pregnant or breastfeeding and agreed to use an acceptable method of birth control throughout the course of the study.
The subjects having history of hypersensitivity to metformin or its excipients or any allergic reactions after taking any medications were excluded from the studies. Moreover, the subjects with positive test result for hepatitis virus and HIV, recent participation in any other clinical trials or blood donation prior to start of the studies were not enrolled. The subjects were instructed to abstain from alcohol drinking, smoking and consumption of xanthine containing products (e.g., coffee, tea, chocolates) or product containing grapefruit, pomelo and orange prior to dosing and for entire duration of the trials. The subjects were well informed and gave written informed consent before participation in the studies at Clinical Research Center, Medical Life Science Institute, Department of Medical sciences, Ministry of Public Health, Thailand.
Study Design
Two separate comparative, randomized, single-dose, two-way crossover bioequivalence studies were conducted under fasting and fed conditions. For the fasting study, the subjects fasted overnight for at least 10 hours before dosing. On the other hand, the subjects had high fat and high calorie meal at 30 minutes before dosing in the fed study. In both studies, the test or reference product was given to subjects with 240 mL of 20% glucose solution in water as per the randomization schedule. Thereafter, 60 mL of a 20% glucose solution in water was administered every 15 minutes for 4
hours after dosing to prevent hypoglycemia caused by the study drug. A washout period between two study periods were at least 7 days for both studies. The subjects were thoroughly monitored for any adverse events throughout the studies. The protocols were approved by the Institute for the Development of Human Research Protections (IHRP), Department of Medical Sciences, Ministry of Public Health, Thailand. The studies were conducted as per the protocol, ICH ‘Guidance on Good Clinical Practice’, Declaration of Helsinki and the standard operation procedures of Clinical Research Center, Medical Life Science, Department of Medical Sciences, Ministry of Public Health, Thailand.
Blood Sampling
Twenty-four blood samples were collected over 36 hours and 48 hours post-dose for the fasting and fed studies, respectively. Blood samples were collected through indwelling intravenous cannula in a forearm vein of the subjects and transferred to the collection tubes containing K2EDTA as an anticoagulant. The collected samples were placed in wet ice water bath until centrifugation at 3,000±100 relative centrifugal force (rcf) for 5 minutes at below 10°C to separate plasma. The separated plasma was divided in two aliquots for subsequent analysis. The samples were stored at -65±10°C until completion of analysis.
Sample Preparation and Quantification
Metformin in the plasma samples was extracted using simple protein precipitation method. Briefly, internal standard solution containing about 500 ng/mL of metformin-d6 was added, followed by acetonitrile. The samples were centrifuged at 4000 ± 100 rcf for 5 minutes at 10°C. The supernatant was transferred into vial for analysis. The study samples were processed along with the calibration standards and quality control samples for acceptability of the analytical run. The plasma concentrations of metformin were determined using a validated 8-point calibration curve ranging from 25.095 to 2003.402 ng/mL.
The samples were analyzed through liquid chromatography tandem mass spectrometer (LC-MS/MS): NexeraTM, Shimadzu Corporation, Japan couple with with TSQ Quantum Ultra, Thermo Fisher Scientific, USA. Chromolith® High Resolution RP-18e 100 x 4.6 mm column was used as the stationary phase. The mobile phase was a mixture of 0.3% formic acid solution (v/v) and acetonitrile at a ratio of 50:50 (v/v) pumped at a flow rate of 1 mL/minute. The temperature of autosampler and column oven was set at 4°C and 40°C, respectively. Mass detector with the electrospray ion source was operated in a positive ion mode. Multiple reaction monitoring transitions were m/z 130.190 to 71.370 for metformin and m/z 136.210 to 77.380 for metformin-d6.
Data acquisition and chromatographic data evaluation were performed using XcaliburTM version 3.0.63.3 and LCquanTM version 2.9.0.34. The samples were analyzed as per in-house SOPs of GPO complying with Guideline on bioanalytical method validation of European Medicines Agency (EMA) [9] and the U.S. FDA Guidance for Industry on Bioanalytical Method Validation [10].
Incurred Sample Reanalysis (ISR)
Incurred sample reanalysis was performed to confirm the reliability of the concentration data. Study samples having concentration close to maximum concentration and in the elimination phase in each period were chosen. According to EMA guideline on bioanalytical method validation [9], at least 10% of first 1000 samples and at least 5% of the samples exceeding 1000 samples were reanalyzed. The results of ISR were not included for pharmacokinetic calculation.
Pharmacokinetic and Statistical Analysis
The pharmacokinetic parameters were calculated by non-compartmental analysis using Phoenix WinNonlin Software version 6.3 (Pharsight Corporation, USA). The area under the plasma concentration versus time curve from time zero to the last measurable concentration (AUC0−tlast) was calculated by linear trapezoidal method. The area under the plasma concentration versus time curve from time zero to infinity (AUC0−∞) was calculated using last measurable concentration and terminal elimination rate constant (λz). The maximum concentration (Cmax) was obtained directly from the pharmacokinetic profile. The AUC0-tlast, AUC0−∞ and Cmax were the primary parameters used for bioequivalence acceptance. In addition, time at which Cmax is observed (tmax), λz, half-life (t1/2) and %AUC extrapolation were reported as the secondary parameters.
The comparison of pharmacokinetic parameters and analysis of variance (ANOVA) were carried out using PROC GLM of SAS® Version 9.3 (SAS Institute Inc., USA). ANOVA model included sequence, formulation and period as fixed effects, and subject (sequence) as a random effect. Sequence effect was tested using subject (sequence) as an error term. An F-test was used to describe the statistical significance of the effects involved in the model at a significant level of 5%. Two one-sided tests for bioequivalence were performed and 90% confidence intervals (CIs) for the ratios of geometric least squares mean of log-transformed primary pharmacokinetic parameters between the formulations were calculated. The bioequivalence was to be concluded when the 90% CIs for the primary pharmacokinetic parameters were within 80.00- 125.00%. Wilcoxon signed-rank test was used to compare median tmax of the test and reference product at significant level of 5%.
Results
Demographic Characteristic of Subjects
In the fasting study, 24 subjects were enrolled and randomly divided into two groups, reference-test (RT) and test-reference (TR). However, 2 subjects were withdrawn in period I due to emesis within 24 hours after dosing.
Therefore, 22 subjects completed the study, and their data were used for pharmacokinetic and statistical analysis (Figure 1). In similar fashion, 14 subjects were enrolled and randomized into two groups in the fed study. There were no withdrawal and dropout in this study. The demographic data of enrolled subjects are summarized in Table 1.
| Single-dose fasting study (Mean ± SD, N=24) | Single-dose fed study (Mean ± SD, N=14) | |
|---|---|---|
| Age (years) | 37.3 ± 8.6 | 32.4 ± 11.2 |
| Weight (kg) | 60.0 ± 8.7 | 67.9 ± 8.0 |
| Height (m) | 1.65 ± 0.08 | 1.72 ± 0.06 |
| BMI (kg/m²) | 22.0 ± 1.9 | 22.8 ± 2.0 |
Table 1: Demographic characteristics of enrolled subjects.
Sample Analysis and ISR
Total of 1065 samples from the fasting study were analyzed in 14 analytical runs. Four samples accounted for 0.4% of total samples were reanalyzed due to inconclusive run. For the samples collected in the fed study, total of 672 samples were analyzed in 8 analytical runs and there was no reanalyzed sample. The precision and accuracy of the assay were ensured by the calibration curve standards and the quality control samples in the analytical runs. The analysis details of both studies are presented in Table 2.
| Single-dose fasting study | Single-dose fed study | |
|---|---|---|
| Number of samples | 1065 | 672 |
| Number of analytical runs | 14 | 8 |
| Between-run precision of the calibration curve standards | 1.2% to 2.5% of the CV | 0.6% to 2.4% of the CV |
| Between-run accuracy of the calibration curve standards | 99.0% to 101.7% of nominal concentrations | 98.8% to 101.0% of nominal concentrations |
| Correlation coefficient (r²) | > 0.99 | > 0.99 |
| Between-run precision of the quality control samples | 6.0% to 7.0% CV | 1.5% to 3.0% CV |
| Between-run accuracy of the quality control samples | 96.2% to 97.2% of nominal concentrations | 96.7% to 97.9% of nominal concentrations |
Table 2: The analysis details of study samples.
All study samples were analyzed within 153 days of validated long-term stability of drug in matrix.
There were 134 samples and 84 samples chosen from the fasting study and fed study, respectively for ISR. The results showed that 99.3% of reanalyzed concentrations of ISR samples from the fasting study differed from their original concentrations less than ±20%. Similarly, 98.8% of ISR samples from the fed study met the acceptance criteria of having percent concentration difference within ±20%. The ISR results suggested that the analytical method was reliable and reproducible.
Pharmacokinetic and Statistical Analysis
Pharmacokinetic parameters of metformin administered in both studies are summarized in Table 3.
| Parameter (Unit) | Single-dose fasting study (Mean ± SD, N=22) | Single-dose fed study (Mean ± SD, N=14) | ||
|---|---|---|---|---|
| Test | Reference | Test | Reference | |
| AUC (ng.hr/mL) 0-tlast | 10876 ± 3935 | 10605 ± 3567 | 11007 ± 3568 | 10450 ± 2769 |
| AUC (ng.hr/mL) 0-∞ | 11396 ± 3970 | 10967 ± 3600 | 11511 ± 3708 | 10978 ± 2834 |
| C (ng/mL) max | 818 ± 185 | 908 ± 249 | 884 ± 208 | 863 ± 187 |
| Median t (hr) max (Min , Max) | 10 (3,16) | 9 (4,12) | 8.5 (5.5,12) | 8.5 (6,10) |
| λ (1/hr) z | 0.14 ± 0.04 | 0.15 ± 0.04 | 0.17 ± 0.04 | 0.17 ± 0.04 |
| t (hr) 1/2 | 5.61 ± 3.07 | 5.15 ± 1.74 | 4.36 ± 1.14 | 4.46 ± 1.29 |
| Extrapolated AUC (%) | 4.77 ± 2.90 | 3.48 ± 1.41 | 3.30 ± 1.41 | 4.79 ± 3.67 |
Table 3: Pharmacokinetic parameters of metformin under fasting and fed conditions.
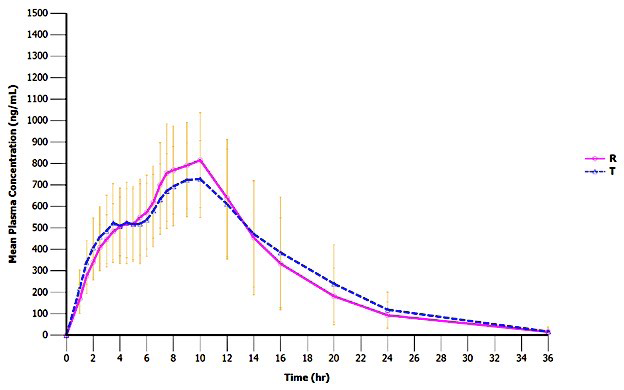
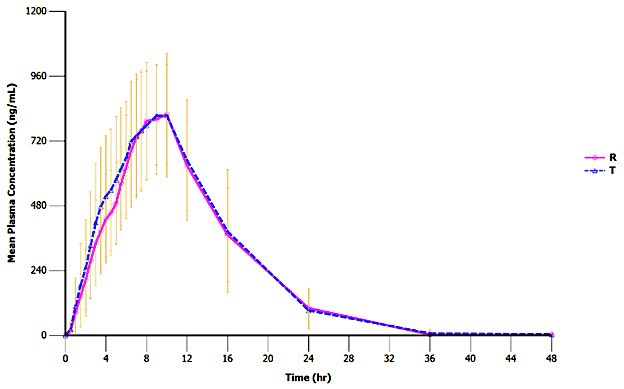
According to the data, approximately 800-900 ng/mL of Cmax was found at around 9 hours after administration of the test and reference products under fasting conditions. Elimination half-life was around 5 hours for both formulations. Approximately 11000 ng.hr/mL of the AUC0−∞ was reported with less than 5% of mean extrapolation from AUC0-tlast. The pharmacokinetic parameters were comparable when the products were administered under the fed conditions.
In the fasting study, the ANOVA showed statistical significant of formulation effect on the log-transformed Cmax and period effect on the log-transformed AUC0-tlast and AUC0−∞ (p-value < 0.05, Table 4).
| Parameters | Ratio of Geometric least squares mean (90% CI) | Power | Intra subject CV (%) | ANOVA (p-value) | ||
|---|---|---|---|---|---|---|
| Sequence | Formulation | Period | ||||
| ln (AUC ) 0-tlast | 101.9 (97.37-106.70) | 100.0% | 8.8 | 0.5158 | 0.4791 | 0.0195 |
| ln (AUC ) 0−∞ | 103.3 (98.54-108.39) | 100.0% | 9.2 | 0.5286 | 0.2467 | 0.0214 |
| ln (C ) max | 91.2 (85.39-97.39) | 100.0% | 12.7 | 0.3856 | 0.0253 | 0.1460 |
Table 4: Statistical comparison of log-transformed primary pharmacokinetic parameters between the test and reference formulations
No effect of period, formulation and sequence was observed on any primary pharmacokinetic parameters in the fed study (Table 5).
| Parameters | Ratio of Geometric least squares mean (90% CI) | Power | Intra subject CV (%) | ANOVA (p-value) | ||
|---|---|---|---|---|---|---|
| Sequence | Formulation | Period | ||||
| ln (AUC ) 0-tlast | 104.5 (98.80-110.45) | 100.0% | 8.3 | 0.2614 | 0.1878 | 0.0832 |
| ln (AUC ) 0−∞ | 101.8 (96.23-107.71) | 100.0% | 8.2 | 0.2495 | 0.5869 | 0.1214 |
| ln (C ) max | 102.0 (92.61-112.43) | 98.1% | 14.5 | 0.1712 | 0.7167 | 0.8936 |
Table 5: Statistical comparison of log-transformed primary pharmacokinetic parameters between the test and reference formulations
The 90% CIs of the geometric least squares mean ratio between the formulations calculated for log-transformed AUC0-tlast, AUC0−∞ and Cmax of both studies were within the acceptance range of 80.00-125.00%. Wilcoxon signed-rank
Tolerability
All adverse events are listed in Table 6.
test indicated that there was insignificant difference in median tmax between the test and reference products in both studies (p > 0.05).
| Adverse event | Incidence in single-dose fasting study | Incidence in single-dose fed study | ||
|---|---|---|---|---|
| Test | Reference | Test | Reference | |
| Nausea | 2 | 0 | 0 | 0 |
| Abdominal distension | 2 | 3 | 0 | 1 |
| Vomit | 1 | 1 | 0 | 0 |
| Difficult to swallow saliva | 1 | 2 | 0 | 0 |
| Low blood sugar level | 1 | 0 | 0 | 1 |
| Dizziness | 0 | 1 | 0 | 1 |
| Total | 7 | 7 | 0 | 3 |
Table 6: List of adverse events.
In the fasting study, 7 adverse events were reported in 4 subjects after taking the test product whereas 7 adverse events were reported in 3 subjects after taking the reference product. In the fed study, 3 adverse events were reported in 2 subjects after taking the reference product and no adverse events were reported in any subjects after taking the test product. All adverse events were probably related to the study drug. They were mild in the intensity which could resolve without any medication treatment. Most common adverse event in these studies was abdominal distension.
Discussion
The bioequivalence of two metformin extended-release formulations was evaluated under both fasting and fed conditions with the consideration that food may affect the performance of a modified formulation [11]. These studies showed that the pharmacokinetics of the test product were comparable to the reference products regardless of food intake. Although, it has been reported that the bioavailability of metformin immediate-release formulation is decreased when taking with food [12], these studies demonstrated insignificant food effect on the absorption of extended- release formulations which were in agreement with other bioequivalence studies [13, 14, 15]. However, the fed study was designed to collect blood samples for longer duration than in the fasting study based on the assumption that food might delay drug absorption. No serious adverse events were reported in both studies; however, more incidence of gastrointestinal side effects was reported in the fasting study comparing with the fed study. This finding supported the recommendation of taking metformin with food although there was no food effect was observed on the pharmacokinetics of the modified-release formulation.
More number of subjects were enrolled in the fasting study based on previously reported intra-subject variability [8]. There were 2 dropouts in the fasting study, but the bioequivalence was established with adequate power (Table 4). By assuming similar intra-subject variability as calculated for the fasting study, the sample size was reduced to 14 subjects in the fed study. All 14 subjects provided evaluable data for pharmacokinetic and statistical analysis which meet the minimum requirements of stringent regulatory authorities [16]. In addition, the bioequivalence was established with the power of greater than 90% under fed conditions (Table 5). The data from the single-dose studies were used to estimate the degree of drug accumulation at the steady state by calculating the AUC covering dosing interval at 24 hours after dosing (AUC0-24h) [17]. The results showed that the mean AUC0-24h was more than 80% of the AUC0−∞ for both test and reference products indicating that a low extent of accumulation was expected for these formulations which were in agreement with the literature data [18]. Therefore, the single-dose studies conducted under fasting and fed conditions adequately demonstrate bioequivalence of metformin extended-release formulation and the multiple- dose study is not required [11, 17].
From the ANOVA, significant period effect was observed on AUC0-tlast and AUC0−∞ in the fasting study. The clinical protocol was strictly followed for both study periods. The mean extrapolated AUC were less than 5% indicating that the sampling time points were appropriately assigned. This is thus convincing that the AUCs were reliably estimated.
A washout period of 7 days was sufficient for complete drug elimination, as evident by undetected concentration in any pre-dose samples in period II. Furthermore, the analytical method used to determine metformin plasma concentrations was validated as per international guidelines [9, 10]. The samples of the same subjects collected from both study periods were analyzed altogether to ensure that all samples were treated in the same manner. The formulation effect was also detected on Cmax which can be explained by higher variation between the treatments comparing with variation within the treatments. Even though the period and formulation effects existed, it did not affect the results of the fasting study as the bioequivalence was concluded by 90% CIs for the ratio of geometric least squares means of AUC0-tlast, AUC0−∞ and Cmax which were within the acceptance criteria of 80.00-125.00%.
Conclusion
The bioequivalence of metformin modified-release formulations was evaluated via single-dose studies under both fasting and fed conditions. The pharmacokinetics of metformin from both studies were comparable suggesting insignificant food effect. As no accumulation was expected, the results of the single-dose studies were justified to demonstrate that the test formulation, Metformin XR 1000 mg was bioequivalent to the reference formulation, Glucophage XR 1000 mg in terms of rate and extent of absorption.
Acknowledgement
This study was supported by the Government Pharmaceutical Organization (GPO), Thailand.
References
-
American Diabetes Association (2021) 9. Pharmacologic approaches to glycemic treatment: standards of medical care in diabetes-2021. Diabetes Care 44(1): S111-S124.
-
Gong L, Goswami S, Giacomini KM, Altman RB, Klein TE (2012) Metformin pathways: pharmacokinetics and pharmacodynamics. Pharmacogenet Genomics 22(11): 820-827.
-
Dumitrescu R, Mehedintu C, Briceag I, Purcărea VL, Hudita D (2015) Metformin-clinical pharmacology in PCOs. J Med Life 8(2): 187-192.
-
Rena G, Hardie DG, Pearson ER (2017) The mechanisms of action of metformin. Diabetologia 60(9): 1577-1585.
-
Graham GG, Punt J, Arora M, Day RO, Doogue MP, et al. (2011) Clinical pharmacokinetics of metformin. Clin Pharmacokinet 50(2): 81-98.
-
Jabbour S, Ziring B (2011) Advantages of extended- release metformin in patients with type 2 diabetes mellitus. Postgrad Med 123(1): 15-23.
-
Zhang P (2003) A simple formula for sample size calculation in equivalence studies. J Biopharm Stat 13(3): 529-538.
-
Friedrich C, Brand T, Ring A, Meinicke T (2014) Bioequivalence of Glucophage® (metformin) tablets from Europe and the United States tested in healthy volunteers. J Bioequiv Availab 6(2): 61-66.
-
EMA (2011) Guideline on bioanalytical method validation. European Medicines Agency, Committee for Medicinal Products for Human Use (CHMP), London, pp: 2-23.
-
U.S. Food and Drug Administration (2018) Guidance for industry: Bioanalytical method validation. Center for Drug Evaluation and Research (CDER) Center for Veterinary Medicine (CVM), Silver Spring, pp: 1-41.
-
EMA (2010) Guideline on the investigation of bioequivalence. European Medicines Agency, Committee for Medicinal Products for Human Use (CHMP), London, pp: 2-27.
-
Sambol NC, Brookes LG, Chiang J, Goodman AM, Lin ET, et al. (1996) Food intake and dosage level, but not tablet vs solution dosage form, affect the absorption of metformin HCl in man. Br J Clin Pharmacol 42(4): 510-512.
-
Boulton DW, Smith CH, Li L, Huang J, Tang A, et al. (2011) Bioequivalence of saxagliptin/metformin extended- release (XR) fixed-dose combination tablets and single- component saxagliptin and metformin XR tablets in healthy adult subjects. Clin Drug Investig 31(9): 619- 630.
-
Chang M, Liu X, Cui D, Liang D, LaCreta F, et al. (2015) Bioequivalence, food effect, and steady-state assessment of dapagliflozin/metformin extended-release fixed- dose combination tablets relative to single-component dapagliflozin and metformin extended-release tablets in healthy subjects. Clin Ther 37(7): 1517-1528.
-
Choi HY, Noh YH, Kim YH, Kim MJ, Lee SH, et al. (2014) Effects of food on the pharmacokinetics of gemigliptin/ metformin sustained-release 50/1,000 mg (25/500 mg x 2 tablets) fixeddose combination tablet in healthy male volunteers. Int J Clin Pharmacol Ther 52(5): 381-391.
-
Galgatte UC, Jamdade VR, Aute PP, Chaudhari PD (2014) Study on requirements of bioequivalence for registration of pharmaceutical products in USA, Europe and Canada. Saudi Pharm J 22(5): 391-402.
-
Scheerans C, Heinig R, Mueck W (2014) Proposal for defining the relevance of drug accumulation derived from single dose study data for modified release dosage forms. Biopharm Drug Dispos 36(2): 93-103.
-
Timmins P, Donahue S, Meeker J, Marathe P (2005) Steady-state pharmacokinetics of a novel extended- release metformin formulation. Clin Pharmacokinet 44(7): 721-729.
- Effects of 5-HTP and Melatonin on the Sleep Cycle of Medical Students
- Adsorption of Bisphenol A on NH4OH- Modified Rice Husk and Sugar Cane Bagasse Biochar
- Comparative Assessment of the Reinforcement Efficiency of Palm Fruit Fibre and Coconut Fibre in High Density Polyethylene (HDPE) Matrix Composite
- Importance of Bio Compounds Naturally Present in Food with Functionality in Animal Metabolism
- Sub-Acute Study on the Cardiotoxic Effects of Monosodium Glutamate Ingestion in Albino Rat
- Weight Management and Its Natural Solutions: A Review