Measles Epidemic Influenced by COVID-19 Epidemic
In Western Pacific, the number of measles cases dropped precipitously in early 2020. As the coverage of measles vaccine remained almost unchanged, the precipitous drop of the measles cases could not be attributed to measles vaccine. It was probably brought about by physical distancing and other measures to prevent spread of SARS-CoV-2. SARS-CoV-2 cases increased wave by wave, while the number of the deaths divided by that of the patients declined. The decline of the casefatality rate could not be attributable to SARS-CoV-2 vaccine, because the trend emerged from the start of the epidemic, far ahead of introduction of SARS-CoV-2 vaccine.
Introduction
In 2005, the WHO Regional Committee for the Western Pacific established 2012 as the target year for measles elimination (resolution WPR/RC56.R8) [1]. In 2020, measles cases decreased abruptly particularly in Europe. The decline could be “the calm between the storms” [2]. As the decline of measles epidemic coincided with the start of COVID-19 epidemic, possible relation between the decline of measles epidemic and the start of COVID-19 epidemic was examined for countries in Western Pacific. For the analysis, countries in Western Pacific were grouped into those in Northern hemisphere, which are China, Japan, Republic of Korea and Mongolia; those near the equator, which are Brunei Darussalam, Cambodia, Lao PDR, Malaysia, Philippines, Papua New Guinea and Viet Nam; and those in Southern hemisphere, which are Australia and New Zealand.
Data Source
- Distribution of measles cases by country and by month, 2011-2022 https://www.who.int/teams/immunization- vaccines-and-biologicals/immunization-analysis-and- insights/surveillance/monitoring/provisional-monthly- measles-and-rubella-data
- Measles-containing-vaccine second-dose (MCV2) immunization coverage by the nationally recommended age (%) https://www.who.int/data/gho/data/ indicators/indicator-details/GHO/measles-containing- vaccine-second-dose-(mcv2)-immunization-coverage- by-the-nationally-recommended-age-(-)
- Coronavirus disease (COVID-19) Weekly Epidemiological Update https://www.who.int/emergencies/diseases/ novel-coronavirus-2019/situation-reports.
- Coverage of coronavirus (COVID-19) vaccinations https://ourworldindata.org/covid-vaccinations The data were downloaded in June 2022
Measles
The number of the patients per month was plotted in the vertical axis in the logarithmic scale along month in the horizontal axis. As shown in Figure 1, measles cases dropped precipitously in early 2020 in Europe (panel A) as well as in Western Pacific (panel B1 for countries in Northern hemisphere, panel B2 for countries near the equator, and panel B3 for countries in the Southern hemisphere). The precipitous drop of the number of the measles cases coincided with the start of COVID-19 epidemic (see the rightward arrow between panel A and panel B1). Coverage of measles vaccine (%) in respective years of 2019, 2020 and 2021 was 85, 85, 85 for Belgium: 93, 93, 93 for Germany: 87, 87, 87 for UK: 86, 86, 86 for France: 88, 86,86 for Italy: 97, 97, 97 for Russian Federation in Europe; and 98, 98, 99 for China: 96, 96, 96 for Rep Korea: 93, 95, 95 for Japan: 81, 96, 94 for Mongolia in Northern hemisphere; 98, 97, 99 for Brunei Darussalam:
82, 80, 71 for Cambodia: 56, 64, 50 for Lao PDR: 87, 84, 84 for Malaysia: 69, 68, 65 for Philippines: 20, 27, 20 for Papua New Guinea: 92, 93, 85 for Viet Nam near the equator; 94, 94, 94 for Australia and 90, 91, 82 for New Zealand. As the coverage of measles vaccine remained almost unchanged from 2019 to 2020, the drop of the measles cases was not attributable to the vaccine. It was probably brought about by physical distancing (https://www.who.int/westernpacific/ emergencies/covid-19/information/physical-distancing) and other measures (e.g., wearing a mask) to prevent spread of SARS-CoV-2.
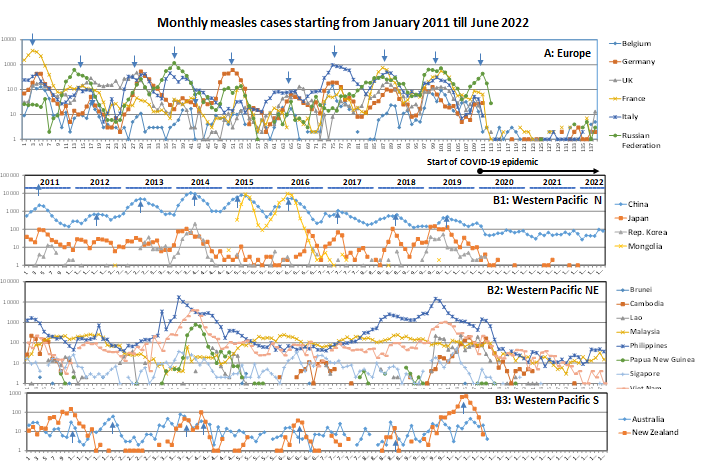
Figure 1: Measles in Europe and in Western Pacific from 2011 to 2022. The number of measles cases per month in the logarithmic scale is plotted in vertical axis along months from January 2011 to June 2022 for countries in Europe (panel A) and for countries in Western Pacific (panels B-D). The leftward arrow between panel A and panel B1 indicates the start of COVID-19 epidemic.
COVID-19
Figure 2 shows epidemic curves of COVID-19 from 3 January 2020 to 23 August 2022. Vaccination against SARS- CoV-2 started in February 2021 (https://ourworldindata. org/covid-vaccinations). Panel A shows epidemic curves of COVID-19 for Belgium, Germany, France, Italy and Russian Federation in Europe. The epidemic curves were synchronized. Epidemic curves of countries in Western Pacific are shown in Panels B, C and D. They were wavy with 4-7 peaks as in Europe but were less synchronized. In all of the countries, the number of the deaths divided by the number of the patients (D/P) declined wave by wave: the lowest value of D/P attained was 0.000001 for Papua New Guinea and Philippines. The decline of D/P could not be attributable to the vaccine because the trend emerged far ahead of the start of the vaccination (see the rightward arrow “Vaccination” in each panel in Figure 2).
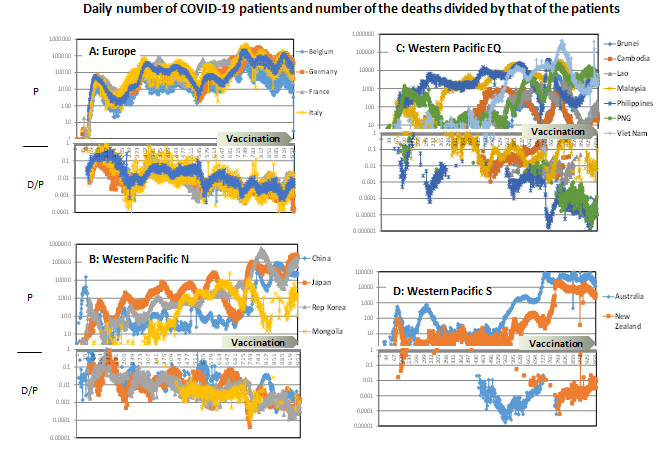
Figure 2: Epidemic curves of COVID-19. The number of the patients (P) and the number of the deaths divided by the number of the patients (D/P) were plotted in the vertical axis in the logarithmic scale against days starting from 20 February 2021 in the horizontal axis. Start of vaccination against SARS-CoV2 is indicated by a rightward arrow in each panel. Panel A: countries in Europe; panels B, C and D: countries in Northern hemisphere, those near the equator, and those in Southern hemisphere in Western Pacific.
Discussion
The above data suggested that physical distancing and other measures conducted to stop COVID-19 epidemic prevented the spread of measles but not that of COVID-19. The case-fatality rate of SARS-CoV-2 infection in terms of D/P declined wave by wave. As this trend emerged far ahead of the vaccination (Figure 2), the decline of case-fatality rate could not be attributable to the vaccine but to emergence of SARS- CoV-2 variants that grew better in upper respiratory tract. Patients infected by attenuated variants are more mobile and spread the virus more efficiently. The mutant could be a cold mutant because temperature is lower in nasal cavity than in deep lung. Actually, Stauft CB, et al. [3] reported that later SARS-CoV2 isolates replicated better at lower temperature than at higher temperature. The wave-by-wave attenuation of SARS-CoV-2 was probably brought about by evolution as quasi-species [4] which may be the reason why COVID-19 epidemic could not be stopped by vaccination and other measures.
References
-
WHO Western Pacific Region (2018) Guidelines on verification of measles and rubella elimination in the Western Pacific Region. In: 2nd (Edn.), Manila, Philippines.
-
Durrheim DN, Baker MG, Capeding MR, Goh KT, Lee D, et al. (2022) Accelerating measles elimination in the Western Pacific Region during the calm between the storms. The Lancet Regional Health-Western Pacific 23: 100495.
-
Stauft CB, Sangare K, Wang TT (2022) Differences in New Variant of Concern Replication at Physiological Temperatures In Vitro. J Infect Dis.
-
Yoshikura H (2022) Synchronization of COVID-19 Epidemic among Different Prefectures and Different Age Groups in Japan. Epidemol Int J 6(S1): 000S1-019.
- Epidemiological Surveillance and Rumors on Social Media
- Awareness and Treatment of Uncontrolled Hypertension in US Overweight/Obese Youths Aged 16–24 Years, NHANES 2021–2023
- Strengthening EPI Through Parental Engagement: Lessons from Dhaka Slums for IA-2030
- Mothers Knowledge of the Prevalence, Causes, Effects, Prevention and Control of Diarrhoea among Children in Ife East Local Government Area, Ile Ife, Osun State, Nigeria
- Covid-19 Reinfections Case Series from October 2023 to October 2024 in A General Medicine Office in Toledo (Spain)
- Water Contact! One Risk Too Many: Risk Factors Associated with Schistosoma haematobium infection in Osun State, Nigeria