Spatial Analysis of the Hepatitis C Epidemic in Bengbu, China between 2013 and 2022: A Retrospective Study
This study aimed to reveal the epidemiological trends and spatial distributions of hepatitis C, in Bengbu, China during 2013- 2022, and provide a scientific reference for HCV prevention, intervention, and treatment. 3034 HCV cases were identified (2013-2022). The number of HCV cases increased from 28 in 2013 to 832 in 2018 and decreased from 832 in 2018 to 431 in 2022. Among the HCV cases recorded during study period, 25.54% were 45–54 years old, 60.31% were farmers, and 52.04% were male. Spatial analysis showed that the cases were concentrated in eastern towns. Spatial-temporal clustering was concentrated in the center of Bengbu, such as Lilou, Hongye, Huangzhuang and Jiefang. Spatial regression analysis showed that per capita gross domestic product and sex ratio had statistically significant positive correlations with HCV infection. Frontline health workers can provide targeted health education and strengthen interventions for the target population.
Introduction
In the 1970s, a type of hepatitis known as non-HAV and non-HBV was discovered, and it was identified and named hepatitis C virus (HCV) after twenty years [1]. HCV can cause acute and chronic hepatitis, leading to fibrosis, cirrhosis and hepatocellular carcinoma [2]. Since 1990, screening for HCV has been mandatory in China (usually before blood donation or blood transfusion) [3] and more cases have been discovered. Although the incidence rate of hepatitis C in China has decreased from 1990 to 2022, it remains the fourth most common infectious disease [4].
Bulletin of the National Health Commission of the People’s Republic of China, 2018). The numerous hepatitis C cases in China, owing to the population base, seriously hamper economic development and endanger public health.
Studies have shown that there are differences in the incidence of HCV infection among different regions in China [4]. However, Bengbu has a high number of cases of hepatitis C. Hepatitis C, like other infectious diseases, is associated with social, geographical, historical and economical factors years [1, 5]. Currently, most studies have focused on HCV genotype distribution and antivirals [6, 7, 8]. Spatiotemporal research on HCV infections is scarce. Importantly, targeted prevention and treatment of hepatitis C in real-world settings can effectively suppress infection [9].
Spatial analysis has been used in HCV research to identify high-risk and spatial-temporal clusters, assess the geographical distribution of infections, and explores the spatial relationship between HCV and social factors [10, 11]. Understanding the long-term trends and spatial clusters of hepatitis C cases in Bengbu will provide scientific evidence for public health professionals and policymakers to develop appropriate targeted responses, including effective project planning and implementation of interventions.
Our study had two main goals. First, we aimed to explore the distribution of demographic information on HCV infection at the township level from 2013 to 2022. Second, to better understand the spatial changes in local HCV, we evaluated the possible clusters and social factors affecting hepatitis C cases during this study period to indicate the direction of future prevention and control priorities.
Methods
Ethics statement
The study does not involve ethical issues.
Study area
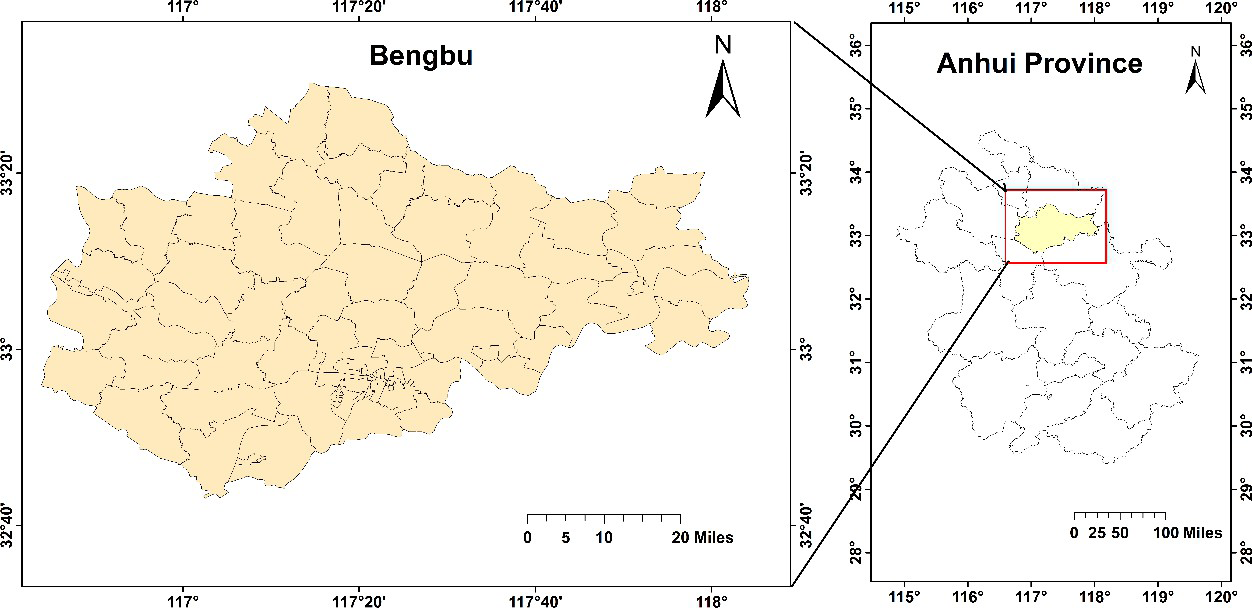
Bengbu, located in northern Anhui Province (Figure 1) (32°43’–33°30’ N, 116° 45’-118°04’ E), covers an area of 5,952 km2 and has a population of 3,317,000. The Huai River flows from west to east in Bengbu and most of its jurisdiction lies at the southern end of the Huaibei Plain. Bengbu has 67 townships and 13 urban streets (at the same level as townships and villages). All HCV cases that occurred in these areas were included in the study.
Datasets
HCV-reported cases were obtained from surveillance data of the online direct reporting system of the China Disease Prevention and Control Information System. The Infectious Disease Management Authority of the (Author’s unit: Hidden) organized and analyzed the city’s hepatitis C reporting data and used the detailed address of the current residence as the geographical location of the case, specifically at the township level. A standardized infectious disease report card was used to gather information on sociodemographic characteristics (age, sex, and occupation), risk behavior, and disease classification. Data for this study were collected via telephone or face-to-face contact with the patients. Data on population and gross domestic product (GDP) per capita were obtained from the Bengbu Municipal Bureau of Statistics and other online sources.
Data management
HCV case data reported in 2013-2022 and recorded in the system were included in this study, excluding duplicates, unknown residence, and having stayed for less than 6 months. We removed personally identifiable information as well as detailed home and contact information to respect the privacy of those who have entered. We checked each township’s national standard geographical code to exclude unknown townships. We downloaded basic electronic map data from the National Geographic Information System of China and used ArcGIS (version 10.4; Esri Inc., Redlands, California) to create the maps. SPSS (version 22.4; SPSS IBM Inc., Armonk, New, USA) was used to analyze demographic data.
Spatial autocorrelation
The global and local Moran indices were used as measures of autocorrelation [12, 13]. We used the global Moran index to determine whether HCV clustering occurred at the population level. The local Moran’s index was used to identify the location where specific local clustering occurred. Four types of spatial autocorrelation were found:
- low-high, with low values surrounded by high values;
- high-high, with high values surrounded by high values;
- high-low, with high values surrounded by low values; and
- low-low, with low values surrounded by low values.
We defined positive spatial autocorrelation as the association of areas with similar values (high-high and low-low) and negative autocorrelation as the association of areas with different values (low, high, and low). Our research focuses on high-high regions. The global Moran’s I is between -1 and 1, with a negative correlation if I < 0 and P< 0.05, and a positive correlation if I > 0 and P < 0.05, indicating that the infection is not randomly distributed; if I = 0 or I is any value and P > 0.05, it indicates that there is no correlation, and the infection is considered to be randomly distributed. The higher the absolute I value, the greater the spatial correlation.
Temporal-Spatial Clustering Analysis
Spatial Scan Statistics (SaTScan) software (version 10.1; www.satscan.org) was used for simultaneous detection of disease clusters in time and space [14] we divided all the research data into three files:
- A case file containing the case identification code, number, and time information
- A geographic file containing the case identification code and coordinate information (coordinate information was converted from map “surface” data obtained by downloading ArcGis10.4 software to coordinate information data, represented by “black dots” in the Cartesian coordinate system)
- A population file containing the case identification code and corresponding population information.
A retrospective spatiotemporal scan analysis combined with a Poisson distribution model was used in this study. Clustering was considered statistically significant if the P value was <0.05, assuming α =0.05. Spatial Regression Analysis Using GeoDa version1.20 (http://geodacenter.github.io/ download_windows.html) was used to determine the spatial correlation between HCV cases and four socio-environmental factors [15, 16, 17].
- sex ratio: the total number of male cases in each township as the numerator, female as the denominator;
- age (years): average age of cases in each township;
- population density: the total population of each research area is taken as the numerator and the area is the denominator (persons/km2).
- GDP per capita in 2019 (Yuan per person).
Results
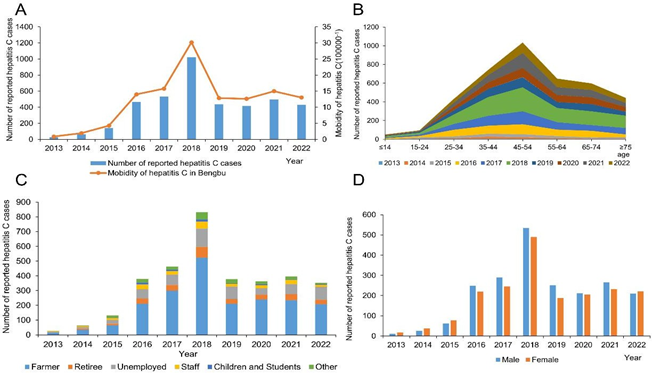
A total of 3,832 HCV cases were identified and reported to the system in Bengbu from 2013 to 2022. This study excluded 798 duplicate cases (20.82%) without district information, leaving 3,034 cases (79.18%) for analysis. During the study period, 76 villages (streets) reported cases of HCV infection. The number of newly reported cases has increased dynamically from 28 in 2013 to 832 in 2018 and decreased from 832 in 2018 to 431 in 2022. The annual reported incidence rates (RIR) (number of newly reported cases/total population) were 0.87/100000, 1.93/100000, 4.25/100000, 13.99/100000, 15.75/100000, 30.16/100000, 12.84/100000, 12.62/100000, 14.98/100000 and 13.03/100000. Highest number of case reports in 2018, the proportion was 28.60%. Among analyzed cases, 25.54% were 45–54 years old, 18.33% were aged 35–44 years, 60.31% were farmers, and 52.04% were male.
Geographical distribution and trend analysis
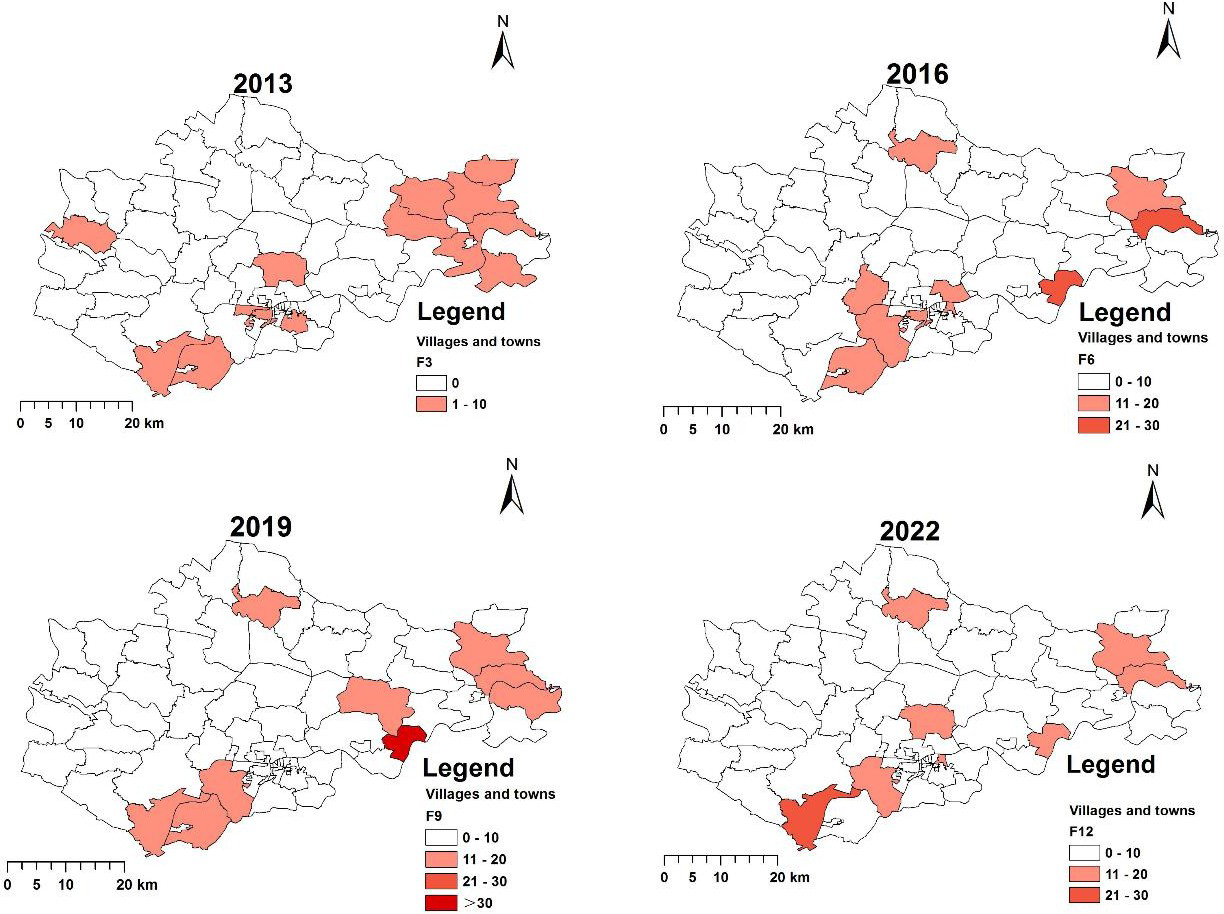
In 2018, 33 villages and towns reported HCV cases, whereas in 2013 and 2022, HCV cases were found in only 16 and 10 villages and towns, respectively (Figure 1 and Figure 2). In 2013, no villages in Bengbu reported >10 cases, whereas in 2018, 33 villages or towns (e.g., Xiaoxu, Xinji, Chengguan and Zhuding) reported >10 cases.
The rate of HCV infection has steadily increased between 2013 and 2022. There were >1000 cases in 2018, 36.71 times the number in 2013. There were >400 cases in 2022, 15.29 times the number in 2013 (P<0.05; Figure 3A). The median age was 52-53 years during the study period. The number of cases between 45 and 54 years increased demonstrably, but the proportion of cases aged 45-54 increased from 25% in 2013 to 25.7% in 2022, with no statistical difference (P>0.05; Figure 3B). There were >500 cases in 2018, 32.69 times number in 2013. Similarly, there were >200 cases in 2022 and 13 cases in 2013 (P<0.05; Figure 3C). Meanwhile, the proportion of cases among individuals with a male increased from 39.29% in 2013 to 52.15% in 2022(P<0.05; Figure 3D).
Spatial analysis
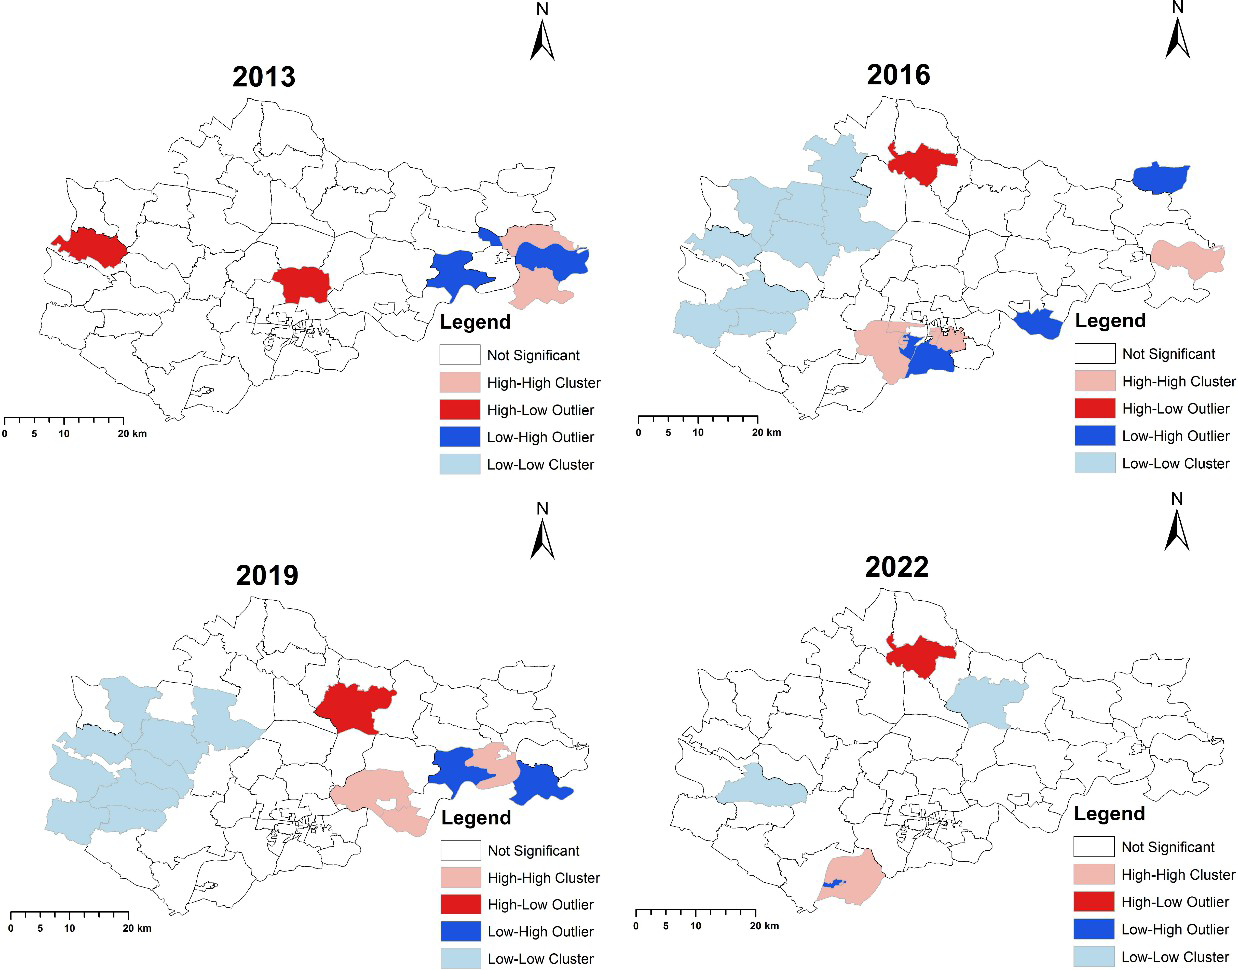
General spatial autocorrelation was performed annually for HCV cases (Table 1). During the period 2013-2019, all Moran index values were larger than zero, with z value > 1.96 (P < 0.05). The results indicated potential clustering of the HCV epidemic in the entire city every year. Meanwhile, the Moran index values in 2020 and 2021 were greater than zero, and the z values were <1.96 (P>0.05); in 2022, the Moran index value was less than zero, and the z value was >-1.96 (P>0.05). The results indicate that the HCV epidemic in Bengbu did not cluster in these three years.
| Year | Global Moran’s | Z Value | P Value |
|---|---|---|---|
| 2013 | 0.221 | 2.608 | <0.05 |
| 2014 | 0.125 | 2.235 | <0.05 |
| 2015 | 0.113 | 20144 | <0.05 |
| 2016 | 0.140 | 2.447 | <0.05 |
| 2017 | 0.147 | 2.963 | <0.05 |
| 2018 | 0.253 | 4.248 | <0.05 |
| 2019 | 0.150 | 2.691 | <0.05 |
| 2020 | 0.008 | 0.289 | >0.05 |
| 2021 | 0.089 | 1.127 | >0.05 |
| 2022 | -0.060 | -0.479 | >0.05 |
Table 1: Results of general spatial autocorrelation for newly reported HCV cases in Bengbu city, 2013–2022.
Spatial clustering of HCV cases
and the eastern part of Wuhe County, including Qinji, Hubin, Changhuaiwei, Xiaobengbu, and Zhuding. In 2019, the high- high cluster spread further southwest of Wuhe, including Toupu, Mohekou, and Linbeihuizu. Low-low clusters were formed in 2019 in western Bengbu, including Baoji, Feihe, Feinan, Heliu, Lanqiao, Wanfu, Xuwei, Longkang, and Shuangqiao (Figures 2 & 4).
The local Moran’s index was also used to determine the clustering of the annual population of HCV cases by year. In 2013, the high-high clusters were mainly located in eastern Bengbu, including Xiaoxi and Chengguan. After 2015, the high-high clusters spread to southern Bengbu
Spatial-temporal Clusters
Spatiotemporal clustering analysis was used to examine one cluster from 2013 to 2022 (Table 2 and Figure 3). The cluster (focusing on clusters with high relative risk) was located in Lilou, Huangzhuang, Huaiheshequ, Changqing, Gaoxinjishukaifqu, Huaibin, Yuhuixu, Qingnian, Wei’er, Shengli, Longhu, Qinji, Hongyecun, Daxin, Mohekou, Yanan, Tianqiao, Xuehua, Dongfeng, Zhihuai, Dongsheng, Jiefang, and Caoshan from 2016 to 2020, with a relative risk of 5.98(P<0. 001).
| Cluster | Dates | Townships(Streets) in Cluster | Coordinates/ radius | Relative risk | Log likelihood ratio | P-value |
|---|---|---|---|---|---|---|
| 1 | 2016-2020 | Lilou, Huangzhuang, Huaihshequ, Changqing, Gaoxinjishukaifaqu, Hubin, Yuhuixu, Qingnian, Wei’er, Shengli, Longhu, Qinji, Hongyecun, Daxin, Mohekou, Yaan, Tianqiao, Xuehua, Dongfeng, Zhihuai, Dongsheng, Jiefang and Caoshan | (32.883263 N, 117.348228 E)/8.51 Km | 5.98 | 1079.68 | <0.001 |
Table 2: Retrospective space-time analysis of HCV cases using discrete Poisson model in Bengbu city, 2013-2022.
Spatial scanning analysis of HCV cases at the township level in 2013, 2016, 2019, and 2022 in Bengbu showed that the number of clusters did not change by year (Figure 4). The cluster in 2013 was distributed in the eastern part of Bengbu, such as Yuhuixu, Huangzhuang, Wei’er Road, Qingnian, Lilou, Caoshan, Xuehua, Longhu, Shengli, Dongsheng, Hongyecunand all villages in Wuhe country. The clusters in 2016 and 2019 were located in the center of Bengbu. The cluster in 2022 will spread to the eastern part of Bengbu, similar to that in 2013.
Spatial regression analysis
We analyzed the spatial correlation between newly detected HCV cases and population density, per capita gross domestic product (GDP), sex ratio (male: female), and average age in Bengbu (Table 3). Four factors were analyzed using ordinary least squares, spatial lag, and spatial error models. The spatial error model was found to be more appropriate than others. These two factors (per capita GDP and sex ratio) were positively associated with identified HCV cases.
| Variable | Ordinary Least Squares | Spatial Lag Model | Spatial Error Model | ||||||
|---|---|---|---|---|---|---|---|---|---|
| Co-efficient | t Static | p value | Co-efficient | Z Value | P Value | Co-efficient | Z Value | P Value | |
| Population Density | -0.00017 | -0.8047 | 0.4236 | -0.000169 | -0.812 | 0.4169 | -0.00026 | -1.471 | 0.14129 |
| Pwe capita gross domestic product | -6.86632 | -2.3709 | 0.0203 | -7.06394 | -2.53 | 0.0114 | -8.07661 | -2.92754 | 0.00342 |
| Sex ratio(Male: Female) | 33.9618 | 3.52919 | <0.001 | 34.3953 | 3.698 | <0.001 | 31.5501 | 3.4806 | <0.001 |
| Age | 0.271974 | 0.58024 | 0.5635 | 0.25928 | 0.5699 | 0.5687 | 0.492219 | 1.18022 | 0.23791 |
| R-squared® | 0.577802 | 0.581698 | 0.607872 | ||||||
| Log Likelihood | -389.08 | -388.8 | -387.234 | ||||||
| AIC(Akaike info criterion) | 788.16 | 789.601 | 784.467 | ||||||
| SC(Schwarz reaction) | 800.07 | 803.893 | 796.377 |
Table 3: Result of spatial regression analysis of reported HCV cases in Bengbu City, 2013-2022.
Discussion
We analyzed the spatiotemporal distribution of HCV infections in Bengbu over the past 10 years. The results showed a significant increase in the number of HCV cases from 2013 to 2018, and a slight decrease in 2022. The majority of reported cases were in the age groups of 45-54 years; the proportion of farmers was relatively high, HCV cases were gradually higher in men than in women, and spatial analysis indicated significant aggregation of HCV cases in certain areas. The spatial cluster range increased and then decreased. We also found a positive correlation between per capita GDP, sex ratio, and HCV-reported cases in Bengbu.
HCV cases increased rapidly during 2013-2022 in Bengbu, which could be explained in several ways. First, since 2012, the quality of hepatitis C data reporting has improved with the establishment of a hepatitis C Prevention and Control agency in China [18]. Second, the online direct reporting system covers all levels of health care institutions [19], which makes the sources of data more comprehensive.
Third, the publication of the “2018 New Diagnostic Standards for Hepatitis C” could be another important reason [20], that could explain the higher number of HCV cases in 2018. Further targeted disease surveillance could help reduce the spread of hepatitis C [21].
Meanwhile, we found that the majority of HCV cases were concentrated in people aged 45-54 years, with the main population being farmers and more males than females. These results are consistent with previous research [22, 23]. Our analysis showed that the reasons for this phenomenon were the hidden nature of hepatitis C and the low income of farmers, lack of health services, and lack of targeted publicity and education [24, 25, 26, 27]. Education of the target population and improvement in the level of healthcare services can be effective in reducing the transmission and incidence of hepatitis C.
Spatial autocorrelation during 2013-2022 revealed the spread of the HCV epidemic in central Bengbu to most villages and towns. Spatial-temporal scanning identified windows that were mainly concentrated between 2016 and 2020, suggesting a rapid epidemic increase during this period. Although Coronavirus Disease 2019 (COVID-19) has shifted the landscape of HCV service delivery and created unique opportunities for HCV elimination in correctional settings in some countries6, meanwhile, COVID-19 has accelerated decentralized HCV testing implementation strategies. This could lead to an increase or decrease in the number of reported cases of HCV infections. This explains the lack of a spatial correlation in hepatitis C cases after 2020.
Spatial regression analysis revealed a significant positive correlation between GDP per capita, sex ratio, and HCV infection. This is similar to recent research results in Japan and Egypt. In Japan [28], spatial regression analysis showed that the deprivation level derived from the sum of poverty scores was significantly and positively associated with HBsAg positivity and HCV prevalence. In Egypt [29, 30], men are more likely to be infected with hepatitis B virus than women. In our current study, even with direct-acting antiviral agents, they still caused a significant economic burden for the elderly population in some townships. These are some of the reasons for the current status of hepatitis C infection. We should continue to focus on these issues to improve the health of the population.
Our study has some limitations. First, during the period of spatial correlation research, China had a serious COVID-19 outbreak, which, to some extent, limited HCV screening, which may lead to bias in case reporting. Second, when we analyzed the factors related to HCV infection in Bengbu, the factors we studied were all selected according to previous studies. However, there are many causes of HCV infection, and it is impossible to include all of them. Third, spatial autocorrelation is influenced by the scale and zoning effects. In this study, we used villages as the spatial unit of analysis. Different spatial statistics may be obtained if county-level analysis is used. Fourth, for spatial regression, we used the total number of male cases in each township as the numerator; if it is not the total number of males, this may introduce bias to the research. Finally, we did not perform further spatiotemporal prediction analyses on this basis. Next, we will compare the prevention and control work with the spatial-temporal prediction results to summarize the HCV prevention and control measures suitable for Bengbu, and even atypical areas in the world. We provide scientifically valuable guidance and references for HCV prevention and treatment.
Conclusion
In summary, there has been an increase in HCV infections in Bengbu in recent years. Most cases of HCV infection occurred in patients aged 45–54 years and were localized to the center of Bengbu. Focus on targeted interventions and preventive plans for the middle-aged and elderly population in key identified areas to help control the spread of the disease in Bengbu.
Data Availability Statement The authors do not have permission to share data.
Fundings This research did not receive any specific grant from funding agencies in the public, commercial, or not-for-profit sectors.
Declaration of Competing Interest The authors declare no financial or commercial conflict of interest.
Acknowledgements Expressing Gratitude to Frontline Workers in Bengbu.
References
-
Manns MP, Maasoumy B (2022) Breakthroughs in hepatitis C research: from discovery to cure. Nature reviews Gastroenterology & hepatology 19(8): 533-550.
-
Jahan S, Ashfaq UA, Qasim M, Khaliq S, Saleem MJ, et al. (2012) Hepatitis C virus to hepatocellular carcinoma. Infectious agents and cancer 7(1): 2.
-
Wang FS, Fan JG, Zhang Z, Gao B, Wang HY (2014) The global burden of liver disease: the major impact of China. Hepatology 60(6): 2099-2108.
-
Yue T, Zhang Q, Cai T, Xu M, Zhu H, et al. (2022) Trends in the disease burden of HBV and HCV infection in China from 1990 -2019. International journal of infectious disease 122: 476-485.
-
Tucker JD, Ahmad A, Mulu A, Muyoyeta M, Hassan MRA, et al. (2022) Hepatitis C testing, treatment and prevention in low- and middle-income country prisons. Nature reviews Gastroenterology & hepatology 19: 484- 485.
-
Scullard GH, Pollard RB, Smith JL, Sacks SL, Gregory PB, et al. (1981) Antiviral treatment of chronic hepatitis B virus infection. I. Changes in viral markers with interferon combined with adenine arabinoside. The Journal of infectious diseases 143(6): 772-783.
-
MacGregor L, Martin NK, Mukandavire C, Hickson F, Weatherburn P, et al. (2017) Behavioural, not biological, factors drive the HCV epidemic among HIV-positive MSM: HCV and HIV modelling analysis including HCV treatment-as-prevention impact. International journal of epidemiology 46(5): 1582-1592.
-
Dusheiko G, Dibisceglie A, Bowyer S, Sachs E, Ritchie M, et al. (1985) Recombinant leukocyte interferon treatment of chronic hepatitis B. Hepatology 5(4): 556-560.
-
Alberts CJ, Clifford GM, Georges D, Negro F, Lesi OA, et al. ( 2022) Worldwide prevalence of hepatitis B virus and hepatitis C virus among patients with cirrhosis at country, region, and global levels: a systematic review. The lancet Gastroenterology and hepatology 7(8): 724- 735.
-
Lu L, Jia M, Ma Y, Yang L, Chen Z, et al. (2008) The changing face of HIV in China. Nature 455: 609-611.
-
Bautista CT, Sateren WB, Sanchez JL, Singer DE, Scott P (2008) Geographic mapping of HIV infection among civilian applicants for United States military service. Health place 14(3): 608-615.
-
Akmatov MK, Holstiege J, Dammertz L, Heuer J, Kohring C, et al. (2022) Epidemiology of Lyme borreliosis based on outpatient claims data of all people with statutory health insurance, Germany, 2019. Euro surveillance 27(32): 2101193.
-
Ganasegeran K, Jamil MFA, Appannan MR, Ch’ng ASH, Looi I, et al. (2022) Spatial Dynamics and Multiscale Regression Modelling of Population Level Indicators for COVID-19 Spread in Malaysia. International journal of environmental research and public health 19(4): 2082.
-
Liu L, Guo B, Li W, Zhong B, Yang W, et al. (2018) Geographic distribution of echinococcosis in Tibetan region of Sichuan Province, China. Infectious diseases of poverty 7(1): 104.
-
Wei X, Zhao J, Yang L (2020) Cost-effectiveness of new antiviral treatments for non-genotype 1 hepatitis C virus infection in China: a societal perspective. BMJ global health 5(11): e003194.
-
Meffre C, Larsen C, Perin A, Bouraoui L, Delarocque Astagneau E (2003) Surveillance of screening for hepatitis C through the laboratory network RENA-VHC, France, 2000-2001. Euro surveillance 8(5): 101-107.
-
Meyer M, Bondy L, Koivu S, Koval J, Scarffe AD, et al. (2020) New hepatitis C diagnoses in Ontario, Canada are associated with the local prescription patterns of a controlled-release opioid. Journal of viral hepatitis 227(8): 774-780.
-
Gao Y, Feng XF, Wen J, Hei HX, Ding GW, et al. (2019) Spatio-temporal distribution and correlation of reported cases of hepatitis C and HIV/AIDS in China, 2012-2017. Chinese Journal of Epidemiology 40(2): 155-159.
-
He N, Detels R (2005) The HIV epidemic in China: history, response, and challenge. Cell research 15(11-12): 825- 832.
-
Ye Z, Cheng H, Liu J, Gong J, Yin M (2023) Epidemic characteristics and spatiotemporal clustering analysis of hepatitis C in Jiangxi Province from 2016 to 2021. Disease Surveillance 38(3): 294-298.
-
Bauer UE, Briss PA, Goodman RA, Bowman BA (2014) Prevention of chronic disease in the 21st century: elimination of the leading preventable causes of premature death and disability in the USA. Lancet 384(9937): 45-52.
-
Liu J, Fan PY, Xue XJ, Sun DY, Sun GQ, et al. (2016) Characteristics of long-term non-progressors and HIV controllers among HIV-infections in Henan, China. Zhong hua liu xing bing xue za zhi 37(2): 227-231.
-
Tessema B, Yismaw G, Kassu A, Amsalu A, Mulu A, et al. (2010) Seroprevalence of HIV, HBV, HCV and syphilis infections among blood donors at Gondar University Teaching Hospital, Northwest Ethiopia: declining trends over a period of five years. BMC infectious diseases 10: 111.
-
de Castro Rocha DFN, da Cunha Rosa LR, de Almeida Silva C, de Oliveira BR, Martins TLS, et al. (2018) Epidemiology of HIV, syphilis, and hepatitis B and C among manual cane cutters in low-income regions of Brazil. BMC infectious diseases 18(1): 546.
-
Vermeiren AP, Dukers Muijrers NH, van Loo IH, Stals F, van Dam DW, et al. (2012) Identification of hidden key hepatitis C populations: an evaluation of screening practices using mixed epidemiological methods. PloS one 7(12): e51194.
-
Csete J, Kamarulzaman A, Kazatchkine M, Altice F, Balicki M, et al. (2016) Public health and international drug policy. Lancet 387(10026): 1427-1480.
-
Guerra-Veloz MF, Han K, Oakes K, Robertson D, Mohamed A, et al. (2022) Results of a Model of Delivering Hepatitis C Care in a Homeless Metropolitan Population in England. The American journal of gastroenterology 118(6): 991- 1000.
-
Okui T, Nakashima N () Analysis of the association between areal socioeconomic deprivation levels and viral hepatitis B and C infections in Japanese municipalities. BMC public health 22: 681.
-
Ismail SA, Cuadros DF, Benova L (2017) Hepatitis B in Egypt: A cross-sectional analysis of prevalence and risk factors for active infection from a nationwide survey. Liver international: official journal of the International Association for the Study of the Liver 37(12): 1814-1822.
-
Overview of the National Epidemic of Statutory Infectious Diseases in December (2018) Bulletin of the National Health Commission of the People’s Republic of China. 183(12): 30.
- Epidemiological Surveillance and Rumors on Social Media
- Awareness and Treatment of Uncontrolled Hypertension in US Overweight/Obese Youths Aged 16–24 Years, NHANES 2021–2023
- Strengthening EPI Through Parental Engagement: Lessons from Dhaka Slums for IA-2030
- Mothers Knowledge of the Prevalence, Causes, Effects, Prevention and Control of Diarrhoea among Children in Ife East Local Government Area, Ile Ife, Osun State, Nigeria
- Covid-19 Reinfections Case Series from October 2023 to October 2024 in A General Medicine Office in Toledo (Spain)
- Water Contact! One Risk Too Many: Risk Factors Associated with Schistosoma haematobium infection in Osun State, Nigeria