MicroRNA 221 Expression by Leukocytes Correlates with the Clinical Severity of Sickle Cell Disease
Objective: The severity of sickle cell disease (SCD) increases with neutrophil count and expression of adhesion molecules by leukocytes. Intercellular adhesion molecule one (ICAM-1) on vascular endothelium mediates leukocyte adherence to the blood vessel wall. This contributes to vaso-occlusion and tissue damage in SCD. Micro-RNA 221 (MIR 221) regulates the gene for ICAM-1. The purpose of this study was to evaluate the relationship between the severity of SCD and expression of MIR 221 by leukocytes. Methods: SCA severity scores were determined in 73 HbSS patients during steady state; and leukocyte expression of MIR 221, complete blood count and plasma level of soluble ICAM-1 (sICAM-1) measured during vaso-occlusive crisis and steady state. Sample estimates inferred to target population with a p value set at 0.05. SCA severity score was correlated to laboratory parameters. Results: Median values of MIR221 increased from mild (3092 copies/ng of cDNA) through moderate (4004 copies/ng) to severe SCA (median 5587 copies/ng, p< 0.05). Spearman’s correlation coefficient (Rho) between severity scores in severe SCA and steady state MIR 221 was high at 0.9. Conclusion: Leukocyte MIR 221 is a strong correlate of SCA severity, and a candidate biomarker for assessing the disease severity in the clinical setting.
Introduction
The severity of sickle cell disease (SCD) increases with absolute neutrophil count [1] and expression of adhesion molecules by leukocytes [2]. Intercellular adhesion molecule 1 (ICAM-1) on vascular endothelium mediates leukocyte adherence to the blood vessel wall (cell, cell interaction). This contributes to vaso-occlusion, the main mechanism of tissue damage in SCD. Endothelial activation leads to increased expression of adhesion molecules, such as ICAM-1, on vascular endothelial cells, and promotes adhesion of blood cells to blood vessel endothelium [3]. Significant activation of vascular endothelium occurs in sickle cell anaemia (SCA); during both crises and steady state [4]. ICAM-1 gene expression is regulated mainly by Micro-RNA 221 (MIR 221); and to a lesser extent by MIR 17, 222, 339 and HDL transferred MIR 223 [5]. There are many determinants of sickle cell severity but not much is known of the regulators of cell- cell interaction and their effect on SCA severity [6].
The relationship between the severity of SCD and the quantity of MIR 221in leucocytes, absolute neutrophil count (ANC) in peripheral blood, plasma concentrations of soluble ICAM 1 (sICAM 1) and C-reactive protein (CRP) was evaluated in this study.
Patients and Methods
Following IRB approval (NHREC/05/01/2008B- FWA00002458-IRB00002323) and informed consent by appropriate persons, 25 healthy HbAA control persons and 73 HbSS patients in vaso-occlusive crisis (45M, 28F; age 2-18 yrs.) were enrolled consecutively while on admission for vaso-occlusive crisis at the University of Nigeria Teaching Hospital, Enugu. The study exclusion criteria were: blood transfusion in the preceding 3 months, pregnancy, on-going treatment with hydroxycarbamide (hydroxyurea) and co-existing chronic diseases such as diabetes mellitus. Information from medical records and clinical assessment was used to determine the SCA Severity Score according to the instrument previously described and validated by Cameron, et al. [7]. This instrument assigns scores to age at which the first symptom of SCD occurred, number of hospital admissions due to SCD per year, number of vaso- occlusive crisis per year, number of major organ complications of SCD, pneumococcal sepsis, and the degree of failure to thrive assessed with patient’s height and weight percentiles. A total score up to 4 indicates mild, 5 to 8 moderate, and 9 to 21 severe SCD. Absolute neutrophil count (ANC) and Hb level were determined with an automated blood analyzer, plasma level of soluble ICAM-1 (sICAM-1) by enzyme-linked immunosorbent assay (ELISA), and expression of MIR 221 in leukocytes by polymerase chain reaction with a fluorescent probe to enable quantification. To obtain a composite picture of the relationship between study parameters, 4 mL of venous blood from each patient was analyzed during vaso- occlusive crisis; and four weeks after the crisis had resolved (steady state). To help evaluate the degree of resolution of the crisis and the level of inflammation in each patient, the concentration of C-reactive protein was measured by ELISA in blood samples taken during crisis and later in steady state.
Laboratory Procedures
Three milliliters (3mL) of blood was put in an ethylene diamine tetra acetic acid (EDTA) bottle and used for full blood count, blood film, MIR 221 quantitation and Hb genotype. One milliliter (1 mL) of blood was put in a plain bottle, the serum separated and used to determine sICAM 1 and CRP levels.
RNA Extraction, Synthesis of Complementary DNA and miR221 Quantification
The work bench was prepared with Virkon R solution and gloved hands sprayed with nuclease decontamination solution (IDT). About 5mls of cold amonium chloride pH 7.4 (red cell lysis buffer) was added to each patient’s blood sample in a test tube, placed in ice for 10 minutes, centrifuged at 4000 rpm for seven minutes and the red supernatant decanted. This procedure was repeated three times to ensure all red cells were lysed. The pellet at the bottom of the test tube (which included the white blood cells) was mixed with 10mls of sterile phosphate buffered saline (PBS) at pH 7.2 by vortexing; then centrifuged at 4000 rpm for seven minutes. It was remixed with 5mls of sterile PBS, centrifuged for 5 minutes at 4000 rpm, and the supernatant decanted. One milliliter (1mL) of Guanodium Isothiocyane (GITC) solution and 10 µl of 2-ß- mercaptoethanol (BME) was added to the pellet to lyse the white blood cells. The resulting GITC lysate, rich in nucleic acids from the white blood cells, was stored frozen at -20ºC till further processing. A control material was made by mixing GITC and BME (without a blood sample). The mixture was homogenized using bacillus calmette guerine (BCG) needle and syringe; and also stored frozen at – 20ºC.
To extract RNA from the GITC lysate, 350µL of absolute ethanol was added. Ethanol causes RNA to be trapped to the side of the tube. This was mixed three times before being transferred to a Spin column that has two parts: the flow through tube and collecting tube. The effluent in the follow through tube was washed with 700µL of wash buffer one and centrifuged at 10,000 rpm for a minute. The flow through tube was transferred to a new collecting tube and spun at 40,000rpm for four minutes allowing the ethanol evaporate. The white substance trapped in the silica membrane of the flow through tube was washed with 35µL of nuclease free water by centrifugation. The water elutes the RNA into a 1.5mL Eppendorf tube. Since RNA is easily degradable, it was used to synthesize the more stable complimentary DNA (cDNA) which was stored.
MIR221 primer prepared by Safety molecular pathology laboratory (UK) that is linked to afluorescent probe (which undergoes colour change and enables quantification) was mixed with 0.2mls of stored cDNA. The primer’s forward sequence from 5’- ………gatttctgtgttcgttagg and reverse 5’- …….ctacctggaaacatgttctc.
A transcriptase was added to synthesize RNA. The mixture was placed in the automated Applied Biosystem Incorporated (ABI) 1720 thermal cycler (UK) to run multiple cycles of heating and cooling. The quantity of MIR221 was read off automatically by the machine and reported in transcript copies per µg of cDNA. For the purpose of normalization of result, equal amount of RNA was used in making cDNA then equal volume of cDNA i.e. 5µL was used such as to satisfy the standard operation protocol for RNA extraction.
ELISA Test for Soluble ICAM-1
A commercially available ICAM-1 ELISA kit manufactured by Biosensis (Catalogue Number BEK- 2023-2P; Batch Number BA01-30-2023TK 260912) was used to measure serum concentrations of ICAM-1, following the manufacturer’s instructions. The microwell plates were read in the Diagnostic Automation Reader (DAR) 800, made by Diagnostics Automation Inc. USA. The DAR 800 quantifies sICAM 1 in serum by measuring the optical density at 450nm. A concentration curve was plotted against known concentrations of the standard solutions. A graph of optical densities for samples gives the ICAM-1 concentration in pg/ml. The sICAM-1 kit has a sensitivity of <10pg/ml.
Data Analysis
The data obtained from this study were recorded and analyzed using Graphpad prism statistical package version 5.03 (www.graphpad.com) made by graphpad software Inc. California USA. The D’Agostino and Pearson’s Omnibus normality test was used to determine Gaussian and non-Gaussian distributed variables. Variables with Gaussian distribution are; sICAM-1 (control), CRP (crisis) and CRP (control), ANC (control), Haemoglobin levels among control, crisis and steady state groups. Non Gaussian distributed variables include; sICAM-1 (crisis), sICAM-1 (steady state), microRNA 221 (crisis),(steady state) and microRNA 221 among control group, CRP (steady state), ANC (crisis and steady state), and Age of the participants. The relationship between sICAM-1, absolute neutrophil count and microRNA 221 with severity score was evaluated using Pearson’s correlation for normally distributed variables; and Spearman’s correlation for non-parametric variables. Correlation values 0.3 and less indicated fair correlation, greater than 0.3 but less than 0.7 indicate moderate correlation and greater than 0.7 showed strong correlation. Paired comparison of continuous values obtained in crisis and steady state was done using the paired t-test. The Kruskal-Wallis test and the Mann- Whitney-Wilcoxon test was used for significance testing of non-parametric variables. The mean was used to compare parametric variables, the median for non- parametric variables. A‘p’ value less than 0.05 was accepted as an indication of statistical significance. Confidence interval and standard error were inferred from sample population. The values of sICAM 1 and microRNA 221 were put in log10 for ease of reading; without attempting to nest non parametric values.
Results
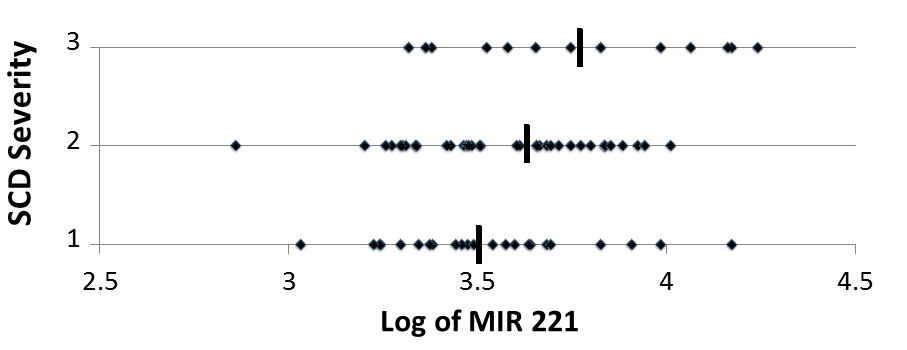
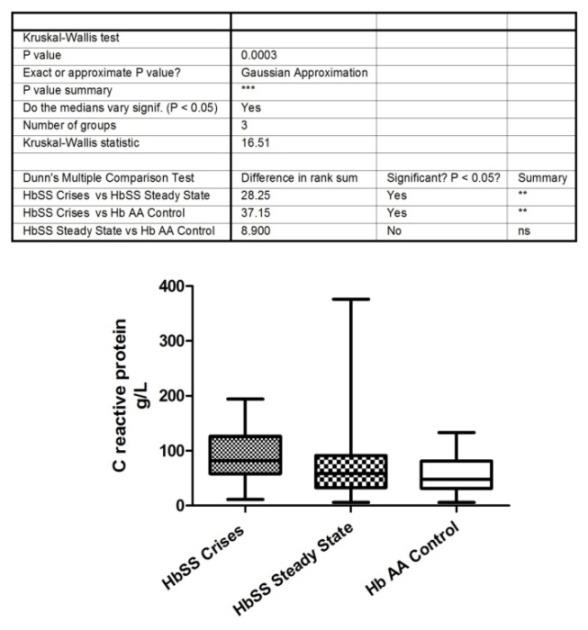
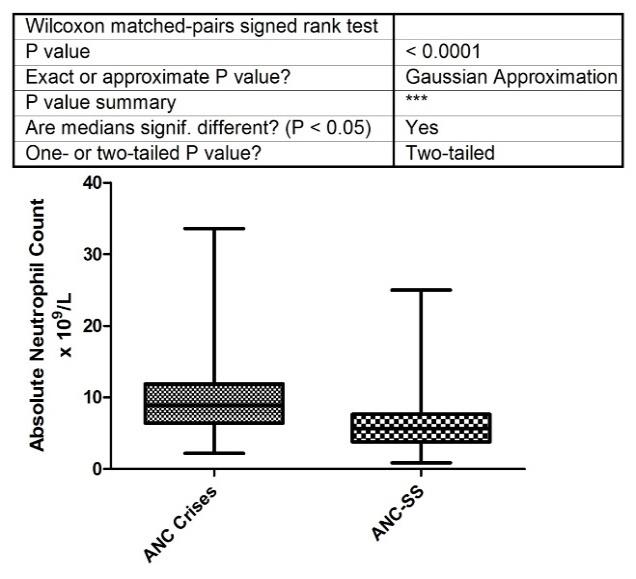
Based on Cameron Severity Scores, 25 patients had mild, 36 moderate and 12 had severe SCA. Four percent of those with mild disease had a major organ complication while 47.2% of those with moderate disease had a major organ complication, compared to 50% of those with severe disease. The mean severity score for all patients was 5.85± 2.31. The median leukocyte microRNA 221 of 3,092 copies/ngof cDNA in steady state was comparable to 3,764 copies/ng of cDNA in crisis (p = 0.6, Table 1). Both values were significantly higher than the median leukocyte MIR 221 of 1428 copies/ng of cDNA in healthy HbAA controls; p<0.0001.The quantity of MIR 221 in leukocytes in mild SCD (median 3092 copies/ng of cDNA) was significantly less than in moderate disease (median, 4004 copies/ng of cDNA) which was, in turn, lower than in severe SCD (median, 5587 copies/ng of cDNA, p < 0.05, Mann Whitney test, Figure 1). The Spearman’s correlation coefficient (Rho) between the Cameron Severity Scores in patients with severe SCD and the quantity of MIR 221 in leukocytes during steady state was high at 0.72 Table 2. The quantity of MIR 221 in leukocytes during steady state emerged as a stronger correlate of SCD severity than absolute neutrophil count Table 3. As crisis resolved and steady state returned, the inflammatory markers C- reactive protein (Kruskal-Wallis test, p = 0.0003) and absolute neutrophil count (Wilcoxon matched pairs test; p<0.0001) reduced significantly; Figure 2. Only one patient had a thalassemia mutation; - alpha 4.2
thalassemia deletion (he had moderate disease with score
of 5 on cameron’s scale). Control values from the twenty
five HbAA persons (mean± standard deviation/median);
MicroRNA 221 (1428±1675/1913 copies per ng of cDNA),
$$ s I C A M - 1 \quad (1 2 3 6 \pm 1 2 7. 9 / 1 2 3 7 \quad p g / m l), \quad A N C $$
(7.24±2.31/7.20 cellsx109), CRP (57.09±37.08 / 47.86
g/L), Hb conc. (67.16±17.36/64.0 g/L).
During Vaso-occlusive Crisis During Steady State
| Severity | ||||||||||||||||||||||||||||||||||||
|---|---|---|---|---|---|---|---|---|---|---|---|---|---|---|---|---|---|---|---|---|---|---|---|---|---|---|---|---|---|---|---|---|---|---|---|---|
| Parameter | I | CAM1 | MIR221 | CRP | ANC | Hb | Age | I | CAM1 | MIR221 | CRP | ANC | Hb | |||||||||||||||||||||||
| Score | ||||||||||||||||||||||||||||||||||||
| Unit of Measurement | pg/ml | copies/ ng of cDNA | g/L | x109/L | g/L | Years | n/a | pg/ml | copies/ng of cDNA | g/L | x109/L | g/L | ||||||||||||||||||||||||
| Mean | 1168 | 4700 | 92.55 | 9.68 | 73.44 | 9.04 | 5.85 | 920.6 | 4531 | 68.24 | 6.13 | 75.74 | ||||||||||||||||||||||||
| Std. | 1035 | 3242 | 47.89 | 5.32 | 13.83 | 4.92 | 2.31 | 492.8 | 3562 | 55.25 | 3.57 | 12.67 | ||||||||||||||||||||||||
| Median | 888.8 | 3764 | 82.05 | 8.91 | 73 | 8 | 6 | 920.7 | 3092 | 58.97 | 5.6 | 74 | ||||||||||||||||||||||||
| Minimum | 409.2 | 579 | 11.11 | 2.2 | 44 | 2 | 1 | 345.3 | 724 | 5.98 | 0.87 | 46 | ||||||||||||||||||||||||
| Maximum | 6145 | 16010 | 194 | 33.58 | 109 | 18 | 12 | 3702 | 17374 | 376.1 | 25.01 | 114 | ||||||||||||||||||||||||
| *C.I | 927- 1410 | 3927-5473 | 81.4- 103.7 | 8.4 -10.9 | 70.2- 76.6 | 7.7- 10.1 | 5.3-6.39 | 805.6- 1036 | 3586-5476 | 55.4-81 | 5.3-6.9 | 72.8- 78.7 | ||||||||||||||||||||||||
| **Normal Distribution | No | No | Yes | No | Yes | No | Yes | No | No | No | No | Yes |
Table 1: Study Parameters and Results of Normality (Gaussian distribution) Tests in 73 HbSS Patients.
ANC= Absolute neutrophil count, CRP= C-reactive protein, ICAM 1= Intercellular adhesive molecule 1, MIR221= microRNA 221, Hb = Haemoglobin. .*C.I = Confidence Interval **Determined using D’Agostino and Pearson’s Omnibus normality test Table 1: Study Parameters and Results of Normality (Gaussian distribution) Tests in 73 HbSS Patients.
During Vaso-occlusive Crisis During Steady State
| Spearman’s Correlation Coefficient (Rho) | Rho | ||||
|---|---|---|---|---|---|
| Severity | |||||
| MILD n =25 | 0.64 | 0.42 | |||
| MODERATE n=36 | 0.53 | 0.27 | |||
| SEVERE n =12 | 0.72 | 0.9 |
Table 2: Correlation of microRNA 221 in Leukocytes with Cameron’s severity score.
Parameter Spearman’s Correlation Coefficient P value Soluble ICAM 1 -0.01 0.97 MicroRNA 221 0.31 0.04 C - reactive protein 0.21 0.07 Absolute Neutrophil Count 0.27 0.54 Table 3: Spearman’s correlation coefficients for steady state values compared with Cameron’s Severity Scores in 73 HbSS patients.
Discussion
The unresolved issues of severity scoring in sickle cell disease [8] has discouraged the use of a single parameter. Many new scoring systems have incoperated laboratory parameters to clinical feature. The choice of the old Cameron score is due to its pure clinical leaning without laboratory encumberance and its high correlation to independent scores awarded by clinical haematologist on the bedside [7].
The strong correlation between the severity of SCA and the quantity of leukocyte MIR 221 in steady state suggests that leukocyte MIR 221 is a candidate biomarker for assessing the severity of SCA. The quantity of MIR 221 in leukocytes, unlike ANC, did not change significantly from crisis to steady state in this study; and could be a more consistent and stronger index of SCA severity than absolute neutrophil count. As a regulator of the gene for ICAM 1 which mediates leukocyte adhesion and contributes to vaso-occlusion (and organ damage), the role of MIR 221 in SCD deserves further evaluation. More studies of this adhesive protein gene regulator in SCD are required considering the clinical benefits of emerging treatment modalities that work by blocking intercellular adhesion molecules [9].
Absolute neutrophil count correlates with the clinical severity of SCD [2]. Despite this correlation, absolute neutrophil count is considered as being partially validated for evaluating the severity of SCD in children; with parameters such as fetal haemoglobin and lactate dehydrogenase [10]. Therefore, there is need to search for a biomarker to be used for assessing the severity of paediatric sickle cell disease. In this study, microRNA 221 was a better correlate of disease severity than absolute neutrophil count, CRP and sICAM 1 Table 3. The correlation of leukocyte microRNA 221 among the twelve candidates with severe SCD is stronger in steady state with Spearman’s coefficient of 0.9, compared with during crisis (Rho = 0.72; Table 2). That the correlation coefficient in steady state is higher than in crisis is a promising feature because steady state values have been found to be more important than crisis values in determining severity of disease in SCD [1]. This is because SCD patients are in steady state for a greater part of the year (for example) compared with crisis. This situation gives the clinician more time to determine and use biomarkers in assessing disease severity. It is of noteworthy that only about half of those with severe disease had developed an organ complication at the time of this study. This implies that the quantity of MIR 221 in leukocytes during steady state could be used to identify children with severe SCD before approximately 50% of them develop organ complications; and appropriate preventive measures taken. Considering that some of the organ complications of SCD are irreversible or even fatal, the potential of MIR 221 as a biomarker of severe SCD deserves further evaluation. The Spearman’s correlation coefficients (Rho) between MIR 221 and sICAM-1 were 0.26 and 0.28 in steady state and crisis respectively (Supplemental Tables). ICAM 1 on the cell surface membrane is in equilibrium with soluble ICAM-1 in plasma. If it is considered that MIR221 would affect the quantities of plasma and cell-bound ICAM-1 equally, then the Spearman’s Correlation Determinant values (Rho2 %) indicate that MIR221 accounts for 8% of soluble ICAM 1 in steady state, and 7% during crisis. This effect of MIR221 onplasma sICAM 1 level is significant because ICAM 1 expression is also regulated by three other microRNAs: 17, 222, and 339 [11]. Infact, MIR 221 is the principal regulator of ICAM 1 expression [12]. Independent observations by Baek, et al. [13] & Selbach, et al. [14] indicate that the maximum effect a microRNA can have on its target is 10-12% elevation or depression.
This implies that the 8% determinant coefficient of MIR 221 on ICAM-1 expression is substantial [15].
Acknowledgement
Mrs Nkemjika Uwaezuoke. Thank God Omeh, Oliver Orji, Ogo Obi, all members of staff of Safety Molecular Laboratory, Enugu, Nigeria. Professors Bede Ibe, Godswill Ibegbunam, Sunday Ocheni, Fidelis Njokanma and Drs Josephat Chinawa and Agozie Ubesie; for their independent review of the manuscript and study design. Conflict of Interest: No external funding was sourced or utilised. Project was funded by authors.
References
-
Okpala IE (2004) The intriguing contribution of white blood cells to sickle cell disorder- a red cell disorder. Blood Rev 18(1): 1865-1873.
-
Anyaegbu CC, Okpala IE, Aken’ova AY, Salimonu LS (1998) Peripheral blood neutrophils count and candidacidal activity correlate with the clinical severity of sickle cell anaemia. Eur J Haematol 60(4):267-268.
-
Valastyan S, Weinberg RA (2011) Roles of microRNAs in the regulation of cell adhesion molecules. J Cell Sci 124(7): 999-1006.
-
Morris CR (2008) Mechanism of vasculopathy in sickle cell disorder and thalassemia. Hematol Am Soc 33: 177-185.
-
Fatiha TK, Luisa ET, Carrier BW, Bassen MS, Culles L, et al. (2014) HDL- transferred MIR223 regulates ICAM 1 expression in endothelial cells. Nat Commun 5: 3292.
-
Steinberg MH (2005) Predicting clinical severity in sickle cell anaemia. Br J Haematol 129(4): 465-481.
-
Cameron FB, Christian E, Lobel SJ, Gaston M (1983) Evaluation of a clinical severity in sickle cell disorder. J Nat Med Assoc 75(5): 483-487.
-
Andreia C, Dias A, Morais A, Nunes B, Faustino P (2012) Sickle cell disease severity scoring: A yet unresolved problem. Eur J Haematol 89(6): 501-502.
-
Ataga KI, Kutlar A, Kantar J, Liles D, Cancado R, et al. (2017) Crizanlizumab for prevention of pain crisis in sickle cell disease. N Engl J Med 376: 429-439.
-
Pearson SR, Alkon A, Treadwell M, Brian Wolff, Keith Quirolo (2005) Autonomic reactivity and clinical severity in children with sickle cell disorder. Clin Auton Res 15(6): 400-407.
-
Bartel DP (2009) MicroRNAs: Target Recognition and regulatory function. Cell 136(2): 215-233.
-
Filipowicz W, Bhattacharyya SN, Sonenberg N (2008) Mechanisms of post transcriptional regulation by microRNAs: are the answers in sight? Nat Rev Genet 9(2): 102-114.
-
Baek D, Villen J, Shin C, Camargo FD, Gygi SP, et al. (2008) The impact of microRNA on protein output. Nature 455(7209): 64-71.
-
Salbach M, Schwanhauser B, Thierfelder N, Fang Z, Khanin R, et al. (2008) Wide spread changes in protein synthesis induced by microRNA. Nature 455(7209): 58-63.
-
Olusanya O, Okpere E, Ezimokhai M (1985) The importance of social class in voluntary fertility control in a developing country. W Afr JMed 4: 205- 211.
- How to Identify and Overcome Barriers in Developing Blood Systems?
- Why Was Transfusion Medicine Not Recognized as a Clinical Discipline?
- Outcomes of Lenalidomide Relapsed/Refractory Patients
- Is Transfusion Always Necessary?
- The Logistics of Production and Use of Blood and Blood Components
- The Challenge for Component Therapies