Assessing the Risk of Damages by Wild Boars (Sus Scrofa) in Italian Apennines. Preliminary Report
Wildlife, particularly wild ungulates, has experienced a significant demographic increase throughout Europe, especially in the last 30 years. The objective of this study was to create a preliminary impact map of wild boars (Sus scrofa) in the Molise region of the Italian Southern Apennines, and their correlation with road accidents. A GIS software was used to process a map, and the impact of wild boars was categorized based on land use. An analysis of the environmental characteristics of the neighboring raster was conducted, considering the presence of roads, particularly with respect to accident events. The geo- referenced damages were superimposed onto the impact risk map. The geo-referenced damages caused by wild boars indicate that they are primarily concentrated in areas where road accidents have occurred and where there is a high risk of impact. These maps serve as a valuable starting point for managing wild boars in the region by optimizing strategies from technical and economic perspectives. This process must include population control by evaluating the Annual Useful Increase index (IUA), based on processes related to birth-immigration and mortality-emigration of the species.
Introduction
Wild boars (Sus scrofa) are widely distributed across several European regions. They continue to spread due to agricultural changes and their high reproduction rates [1, 2]. This species is considered invasive and harmful to both agriculture and the environment [3, 4]. In fact, the wild boar has been listed among the “World’s Worst Invaders” by the IUCN’s group of invasive species specialists [5]. Wild boars are omnivorous generalists that act as both large predators and herbivores in their native and non-native ranges [6]. They have been documented preying on a variety of vertebrate and invertebrate species in island and continental ecosystems, disturbing nest sites and plant assemblages, and sometimes hybridizing with other endangered Suidae. In addition to competing with native fauna, they also act as vectors for disease transmission [7]. Their digging behavior often modifies habitat characteristics and can alter ecosystem structure [8, 9, 10, 11, 12, 13].
The presence of wild boars is particularly high in the Molise Region of Southern Italy due to agricultural changes and strong reforestation habitat [14, 15, 16]. Moreover, the increase in areas off-limits to hunting activity, linked to the rise of protected areas, has led to an increase in wild boar abundance [8] and human-wildlife conflicts in anthropized areas [1, 8]. However, Geographic Information System (GIS) software can be used to plan management strategies that reduce the species’ impact on the territory and promote a balance between the environment and human activities [17, 18, 19]. In 2013, the ISPRA (Italian Institute for Environmental Protection and Research) published guidelines for the management of ungulates, including wild boars [20]. These guidelines focus on the strategy for proper territorial management, mainly referring to wild boars through the use of information technology tools (GIS) and the development of repeatable techniques.
The objective of this study was to create a preliminary impact map of wild boars in the Molise Region, in accordance with the ISPRA protocols [20]. The impact areas were identified in relation to control interventions for the containment of species against agricultural crops and anthropized areas (art. 19 Italian Law L.N. 157/92, including legal rules for the protection of warm-blooded fauna and hunting in Italy), and in relation to the incidence of road accidents caused by wild boars [21, 22, 23]. Vehicle collisions with animals pose serious issues in countries with well- developed highways [24, 25]. Expanding wildlife populations and the development of urbanized areas reduce the potential contact distance between wildlife species and vehicles [26, 27]. Analyzing wildlife-vehicle collision hotspots is an effective way to determine which landscape (land-use) factors are most related to such collisions [28, 29, 30, 31]. In this study, the incidence of road accidents caused by wild boars in certain areas is useful to validate the data obtained from the impact map, verifying the possible overlapping between the data used to create the impact map and the data of the road accidents.
Materials and Methods
Study area
The study area is the Molise Region, which is located in central southern Italy, covering a surface area of 4.438 square kilometers. According to the most recent data [32], the region is predominantly mountainous (55,3%) and hilly (44,7%). The wooded areas are concentrated in the mountainous and high hilly territories where crops and landscapes have been abandoned. In these areas, urbanization is minimal, covering only 1,2% of the regional surface, while agricultural land covers 58,7%, and woods occupy 27,3%. Other land cover types include grasslands and pastures (8,7%), scrubs (3,3%), barren lands (0,4%), and water bodies (0,3%). The wooded Molise area comprises a total of 145.000 hectares [33], representing 32,8% of the total area of the Molise Region. This area constitutes about 1,4% of the total Italian wooded area. Of these, 144.500 hectares are classified as “Woods and other wooded lands” (99,4% of the total), while the remaining wood arboriculture systems cover approximately 800 hectares [34, 35].
Methods
The map of wild boar impacts was created using QGIS software v. 3.14. The study took into account data collected from the bibliography on the Mediterranean ecosystem to determine the impact of wild boar in different environments corresponding to the 44 land use categories [36]. Land use data was obtained from the Corine Land Cover 2018 dataset (version v.2020_20u1), which describes 44 different categories (Level III Corine Land use) [37, 38, 39]. To test the model used to determine the impact map, wild boar traffic accident data was considered. Geo-referenced data concerning road accidents in the Molise Region were provided by official regional documents during the period of 2018-2021 [40]. These data allowed the analysis of environmental characteristics of neighboring raster areas that considered the presence of roads with accidents caused by wild boars. The protocols were referred to the wildlife habitat suitability model of the Molise Region [41]. The geo-referenced damages were overlaid with the impact risk map. The analysis results were verified with R-cran using the “package_stats” [42]. Significant differences in environmental characteristics between roads with and without damages were verified using the Mann-Whitney U Test [43]. Subsequently, resource selection functions were formulated [44, 45] for damage presence/absence models [46]. The damage presence/absence model was created through binary logistic regression analysis (ARLB), which compared the environmental characteristics inside the cells with the presence of the road accident caused by the species with those of cells with no damage in the entire territory of the Molise region. ARLB is based on the following equation:
$$ P = \frac {\exp^ {y}}{\left(1 + \exp^ {y}\right)} $$
where P represents the probability of the event happening (in this case, the probability of damage) and y is the characteristic equation of multiple linear regression: y = β0 + β1x1 + …+ βnxn, where xn is the nth independent variable and βn is the standardized coefficient of the independent variables.
The variables to be included in the models were chosen using the Information-Theoretic Approach [47] and the Akaike criterion was used as a comparison parameter [48]. The model with the minimum AIC and subsequent elaborations was chosen as the best model. The reliability and effectiveness of the model were evaluated by testing various parameters, such as:
- Collinearity of the variables, using the Variance Inflation Factor (VIF) using 3 as the threshold value [49];
- Normality of the residues, through the Kolmogorov- Smirnov test [43];
- Autocorrelation of residuals, through the Durbin-Watson test [50];
- Discriminatory ability of the model through the ROC curve (Receiver Operating Characteristic plot) and the area.
- Under the curve (AUC, Area Under the Curve) [45, 51, 52];
• Variance explained, through Nagelkerke’s R2 [43].
The presence/absence model of damage (cells adjacent to the roads) was obtained by comparing the land use between 50 roads with the presence of damage and 20 roads with no damage. In particular, the percentage of the following land uses were compared: urbanized areas, non-irrigated arable land, vineyards, orchards, olive groves, meadows and pastures, heterogeneous agricultural areas, coniferous and mixed forests, and areas with sparse and evolving vegetation.
Results
Table 1 displays the impact values of wild boars in the Molise Region based on different land use categories. To define potential impact maps for each land use category, the first step involved geoprocessing operations. The Impact Table was obtained through the join field function, where potential impact values were linked to each polygonal vector file of land use [53]. Table 1 was planned following the Corine Land Cover project. It is a European project specially created for tracking and monitoring of land cover and land use characteristics with particular attention to the needs of environmental protection. This classification can be used without paid licenses as it is a sampling methodology of land use. In detail, it is a standardised classification for all European countries where the variables used at different levels (in this case 3) represent land use with degree of detail 3; from the level of macroclass 1 to the macroclass 3 the detail increases. The European land cover inventory is divided in 44 different land cover classes. In table 2 the Grid Code shows the progressive number of the different land uses.
| Corine Land Cover Legend | ||||
|---|---|---|---|---|
| Level 1 | Level 2 | Level 3 | Grid_C | Impact_ |
| ode | Wb | |||
| Artificial Surfaces | 1.1 Urban fabric | 1.1.1 Continuous urban fabric | 1 | 5 |
| 1.1.2 Discontinuous urban fabric | 2 | 5 | ||
| 1.2 Industrial , commercial and transport units | 1.2.1 Industrial or commercial units | 3 | 5 | |
| 1.2.2 Road and rail networks and associated land | 4 | 5 | ||
| 1.2.3 Port areas | 5 | 5 | ||
| 1.2.4 Airports | 6 | 5 | ||
| 1.3 Mine , dump and construction sites | 1.3.1 Mineral extraction sites | 7 | 5 | |
| 1.3.2 Dump sites | 8 | 5 | ||
| 1.3.3 Construction sites | 9 | 5 | ||
| 1.4 Artificial , non - agricultural vegetated areas | 1.4.1 Green urban areas | 10 | 5 | |
| 1.4.2 Sport and leisure facilities | 11 | 5 | ||
| Agricultural Areas | 2.1 Arable land | 2.1.1 Non - irrigated arable land | 12 | 5 |
| 2.1.2 Permanently irrigated land | 13 | 4 | ||
| 2.1.3 Rice fields | 14 | 4 | ||
| 2.2 Permanent crops | 2.2.1 Vineyards | 15 | 4 | |
| 2.2.2 Fruit trees and berry plantations | 16 | 4 | ||
| 2.2.3 Olive groves | 17 | 2 | ||
| 2.3 Pastures | 2.3.1 Pastures | 18 | 2 | |
| 2.4 Heterogeneous agricultural areas | 2.4.1 Annual crops associated with permanent crops | 19 | 2 | |
| 2.4.2 Complex cultivation patterns | 20 | 4 | ||
| 2.4.3 Land principally occupied by agriculture , with significant areas of natural vegetation | 21 | 4 | ||
| 2.4.4 Agro - forestry areas | 22 | 1 | ||
| Forest and Semi Natural Areas | 3.1 Forests | 3.1.1 Broad - leaved forest | 23 | 0 |
| 3.1.2 Coniferous forest | 24 | 0 | ||
| 3.1.3 Mixed forest | 25 | 0 | ||
| 3.2 Scrub and / or herbaceous vegetation associations | 3.2.1 Natural grasslands | 26 | 2 | |
| 3.2.2 Moors and heathland | 27 | U | ||
| 3.2.3 Sclerophyllous vegetation | 28 | 0 | ||
| 3.2.4 Transitional woodland - shrub | 29 | 0 | ||
| 3.3 Open spaces with little or no vegetation | 3.3.1 Beaches , dunes , sands | 30 | 3 | |
| 3.3.2 Bare rocks | 31 | 0 | ||
| 3.3.3 Sparsely vegetated areas | 32 | 0 | ||
| 3.3.4 Burnt areas | 33 | 0 | ||
| 3.3.5 Glaciers and perpetual snow | 34 | 0 | ||
| Wetlands | 4.1 Inland wetlands | 4.1.1 Inland marshes | 35 | 3 |
| 4.1.2 Peat bogs | 36 | 3 | ||
| 4.2 Maritime wetlands | 4.2.1 Salt marshes | 37 | 3 | |
| 4.2.2 Salines | 38 | 5 | ||
| 4.2.3 Intertidal flats | 39 | 3 | ||
| Water Bodies | 5.1 Inland waters | 5.1.1 Water courses | 40 | 0 |
| 5.1.2 Water bodies | 41 | 0 | ||
| 5.2 Marine waters | 5.2.1 Coastal lagoons | 42 | 0 | |
| 5.2.2 Estuaries | 43 | 0 | ||
| 5.2.3 Sea and ocean | 44 | 0 |
Table 1: Corine Land Cover legend in Molise Region [53].
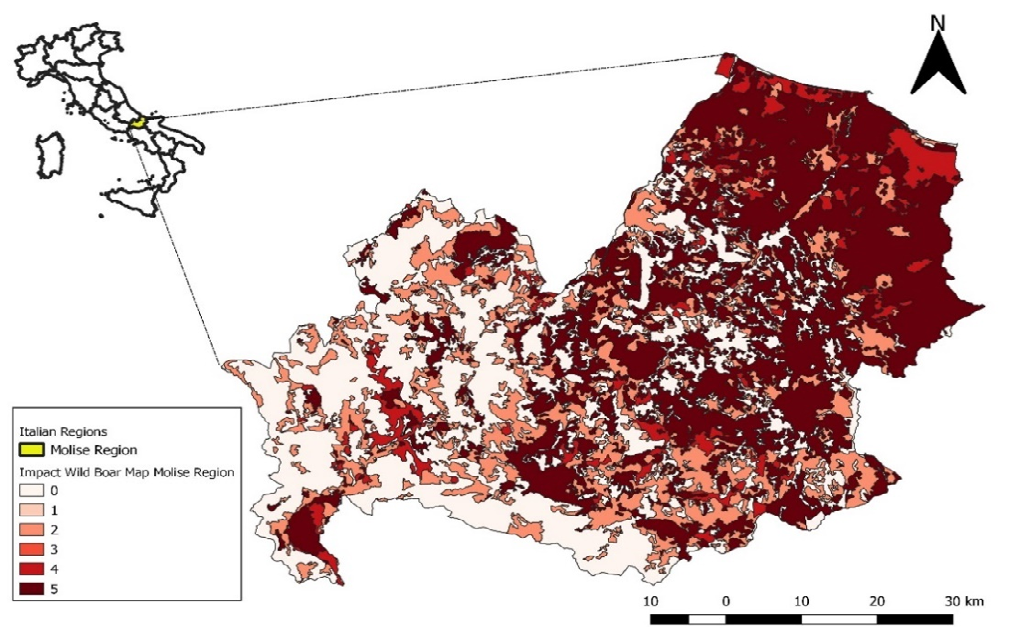
Values ranging from 0 (zero impact) to 5 (certain impact) have been assigned. The impact values were divided into the following categories: 5: urban and similar areas (certain impact); 4: valuable cultivated areas (very small impact); 3: cultivated areas (open) where impact is possible; 2: cultivated areas where the impact is low; 1: not significant impact; 0: null impact.
The polygonal vector file was produced for each area similar to the polygonal vector file of the Corine land Cover, with 5 additional fields coming from table 1 (5 certain impact, 0 zero impact) and connected to the target of wild boars studies.
The potential impact of wild boars at the regional level, obtained in raster format with 10m x 10m cells, indicates that they are particularly present in urban areas (specifically, Molise Center around the city of Campobasso) and in agricultural areas near the sea (Molise lowlands and coastal areas of the Adriatic Sea). Table 2 displays the data related to the areas (in hectares and percentages) in relation to different impact levels and categories. These values are crucial for identifying problem areas (also known as non- vocate) as defined by ISPRA [54].
| Impact level | Area (ha) | Area (%) | |
|---|---|---|---|
| No Impact | 0 | 147,896.99 | 33 |
| Not significant impact | 1 | 0.00 | 0 |
| Arable lands, low impact | 2 | 89,117.20 | 20 |
| Permanent crops, probable impact | 3 | 303.84 | 1 |
| Valuable cultivated areas, very probable impact | 4 | 27,478.99 | 6 |
| Urban areas, high impact | 5 | 178,813.80 | 40 |
Table 2: Different levels of impact referred to the different categories.
Regarding the wild boars, the polygons with higher levels of impact (levels 3-4-5, respectively for permanent crops, valuable cultivated areas, and urban areas) were selected. A new polygonal vector file was created, which allowed to identify only the areas where the wild boars had a significant impact. The polygons with codes for roads in a wooded environment (codes 122) and those with a surface area less than 1 hectare were removed. A buffer function was then applied to the remaining polygons, creating a buffer zone of
300 meters around them. Finally, the buffers were merged into a single file using the dissolving function. The file created for each impact area was identified as an “Intervention Area”. This process revealed that the intervention areas for wild boar control overlap with the areas where the risk of impact is the highest. By comparing the surfaces (ha and %), it was observed that the areas to be subjected to the control interventions represent only a part of the entire surface of the regional district (Table 3).
- Agricultural and Forest areas
- Total Surface ha ha
- 443,613.80
- 436,465.40
- 196,598.81
- 0
- 0.00
- 0.00
- 1
- 0.00
- 0.00
- 2
- 0.00
- 0.00
- 3
- 0.10
- 194.61
- 4
- 12.91
- 25,387.37
- 5
- 86.99
- 171,016.80
Table 3: Areas to be subjected to the control interventions.
| Environmental variable | Median | P | |
|---|---|---|---|
| 0 | 1 | ||
| Urban areas | 0.375 | 0.43 | 0.09 |
| Not irrigated arable lands | 10.66 | 16.41 | <0.001 |
| Vineyards and fruit trees | 0.2755 | 0.2985 | <0.001 |
| Olive groves | 1.8615 | 1.3965 | 0.012 |
| Permanent lands | 0.891 | 0.219 | <0.001 |
| Heterogenous agricultural areas | 7.31 | 7.285 | <0.001 |
| Wooded lands | 11.79 | 14.975 | <0.001 |
| Deciduous forest | 11.79 | 13.07 | <0.001 |
| Coniferous forest | 0.102 | 0.4105 | <0.001 |
| Mixed forest | 0.237 | 0.21 | <0.001 |
| Meadows and pastures | 1.777 | 2.105 | 0.176 |
| Areas with evolving vegetation | 1.325 | 1.57 | <0.001 |
| Sparsely vegetated areas | 0.077 | 0.2455 | <0.001 |
Table 4: Environmental characteristics between roads with the presence of damage and those with no damage
| Environmental Variable | β | ES | VIF |
|---|---|---|---|
| Intercepts | -0,1795 | 0,256 | // |
| Not irrigated arable lands | 0,008 | 0,004 | 1,278 |
| Vineyards and fruit trees | -0,176 | 0,1005 | 2,082 |
| Heterogenous agricultural areas | 0,0115 | 0,007 | 2,193 |
| Coniferous forest | 0,508 | 0,134 | 0,844 |
| Sparsely vegetated areas | 0,277 | 0,174 | 1,975 |
Table 5: Best model obtained from binary logistic regression analysis: coefficients (β), standard error (ES) and inflation factor
Table 4 presents the differences in environmental characteristics between roads with and without damage. Significant differences were observed in adjacent cells for the following variables: non-irrigated arable lands, vineyards and fruit trees, olive groves, meadows, heterogeneous agricultural areas, wooded areas, and areas with sparse and evolving vegetation. In fact, all these variables showed higher values in the road sections of municipalities with a high presence of damage.
The damages are positively influenced by non-irrigated arable land, heterogeneous agricultural areas, coniferous forests, and areas with sparsely vegetated areas. A negative influence was observed in vineyards and orchards, largely because they were not fenced (Table 5).
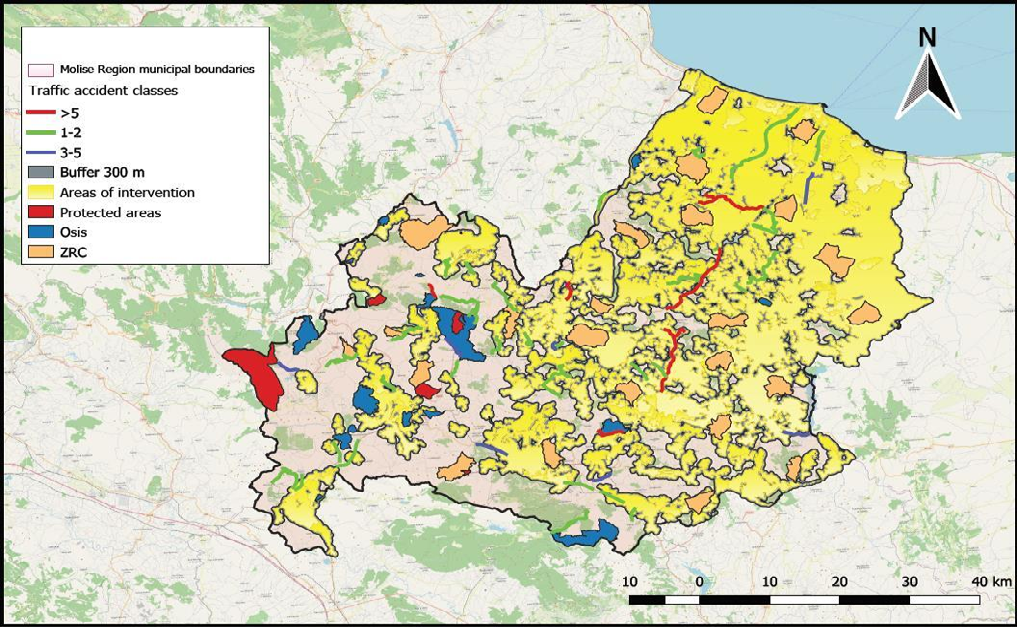
The variance inflation factor (VIF) did not show any correlation between the variables (VIF <3; Table 5). However, the model’s ability is weak and should be improved with more data for further verification, with an AUC of the ROC curve of 0.754 (P <0.001). The residuals are not normally distributed (Kolmogorov-Smirnov test of normality, D = 0.436, P <0.001) and are not autocorrelated (Durbin-Watson autocorrelation test, DW = 1.85, P = 0.343). The variance explained by Nagelkerke’s R2 is equal to 0.234. The layers of Protected Areas, Natural Reserves, Oases, and Restocking and Capture Areas (ZRC) have been merged with the intervention map. The areas of intervention overlap in most cases with the areas with road accidents because they act as a refuge effect [55] for the species. In these areas, wild boars are not disturbed by anthropogenic activity and have no pressure from hunting. It is believed that wild boars use these spaces as day shelters and/or breeding areas [5].
Discussion and Conclusions
In Europe the wild boar represents the most important cause of damage to crops and human beings in different forms. The risk of these damages will be managed starting by the study of local populations by using radio tracking and developing the maps of the damages. This can be obtained by improving the database of geospatial standardized values available for the different Italian regions. The development of a model based on the spatial analysis of the damage will allow to manage these populations in a constant way and, consequently, to increase the human intervention limiting the risk of damages.
The wild boars use to migrate towards human settlements because of the considerable increase of the number of animals. In Italy the damages to crops were 120 million of euro in the last seven years with an average value of 17 million of euros/year [54]. The considerable increase of the number of heads determined a strong impact on anthropic activities. The presence of wild boars in urban and peri urban areas was detected in many countries around the world. This situation was reinforced starting from the pandemic crisis [55]. In the following years it has been difficult to come back to the previous situation because wild boars constituted ecological corridors that strengthened their presence in the towns. Moreover, wild boars were more and more attracted by the towns also because of wrong local policies in waste management, neglected urban greenery which favored the constitution of ecological corridors. All
these elements caused some kind of “explosion” in the towns. Another factor that determined the migration of wild boars in urban areas, mainly in those closed to wooded natural areas, were linked to the considerable increase of wolves that represent a predator for wild boars that consequently, try to modify their behavior by moving to other places.
The literature gives much data about the different damages caused by wild boars; nevertheless, limited information is available on the possible solutions concerning the remedial measures to control the incidents of wild boar and the damages caused by these animals. The most important methods to limit the damages are:
- Invasive capture of wild boars through selective hunting and control.
- Supplementary supply of food in the woods to attract wild boars; this method is not a good solution because it is limited in the time and gives the possibility to increase the weight of the females stimulating the estrus cycle.
- Fences to prevent the access to agricultural crops.
- Need to study the crossing movements and the factors that influence them with the aim to create some green ways dedicated. This measure is possible only in countries and places where the anthropic presence is not very high.
This study suggests that detecting traffic accidents can be used as a method to confirm the excessive presence of wild boars in an area. The georeferenced damage caused by wild boars demonstrates that most of it is concentrated in areas where road accidents have occurred and where there is the greatest risk of impact. Impact maps of the ungulate are fundamental tools for defining areas unsuitable for the presence of the species because the conflict with human activities reaches intolerable levels. The maps can be regularly updated with data on abundance, distribution variation, and analysis of population dynamics over time. In the absence of precise data on the species’ density, threshold values for tolerable damage can be defined and used. Regarding the biological damage caused to habitats, it is also necessary to monitor the territory with test areas representative of the environmental variability. The goal is to control the population of wild boar through various actions, including:
- Assessing the distribution and abundance of the species based on territorial data.
- Conducting a careful assessment of the damage caused by the species.
- Creating a historical database to understand the evolution of the wild boar population over time.
- Defining immediate interventions in areas with a high risk of damage.
- Developing management forecasting models based on the evolution of the territory and data on the species.
The control of the species should focus on areas at risk through removal interventions [56], using various methodologies for fauna management [6, 57, 58, 59]. These maps provide a good starting point for land management and developing the best strategy from a technical and economic standpoint. In the future, the model will be tested not only on road accidents but also on regional data provided by official organizations. By identifying and narrowing down the problem, it will be possible to involve different organizations (public authorities, associations, hunting organizations, etc.) in cooperatively managing wild boar through the development of management plans to reduce damage.
References
-
Keuling O, Strauss E, Siebert U (2016) Regulating wild boar populations is “somebody else’s problem”! Human dimension in wild boar management. Sci Total Environ 554: 311-319.
-
Tack J (2018) Wild Boar (Sus scrofa) populations in Europe: a scientific review of population trends and implications for management. European Landowners’ Organization, Brussels, pp: 56.
-
Saez RC, Telleria JL (1986) The increased population of the wild boar (Sus scrofa) in Europe. Mammal Review 16: 97-101.
-
Bieber C, Ruf T (2005) Population dynamics in wild boar Sus scrofa: ecology, elasticity of growth rate and implications for the management of pulsed resource consumers. J Appl Ecol 42(6): 1203-1213.
-
IUCN World Commission on Protected Areas (WCPA) (2019) Task Force on Other Effective Area-based Conservation Measures, Recognizing and reporting other effective area-based conservation measures. Monographic Series no.3, Gland, Switzerland.
-
Oliver K, Sange MD (2018) Guidance on estimation of wild boar population abundance and density: methods, challenges, possibilities. EFSA supporting publication. EN-1449, pp: 48.
-
Carpio AJ, Apollonio M, Acevedo P (2021) Wild ungulate overabundance in Europe: Contexts, causes, monitoring and management recommendations. Mammal Rev 51(1): 95-108.
-
Massei G, Kindberg J, Licoppe A, Gacic D, Sprem N, et al. (2015) Wild boar populations up, numbers of hunters down? A review of trends and implications for Europe. Pest Manag Sci 71(4): 492-500.
-
Genov PV, Focardi S, Morimando F, Scillitani L, Ahmed A (2017) Ecological impact of wild boar in natural ecosystems. In: Ecology, conservation and management of wild pigs and peccaries. Melletti, M. et al. (Eds.), Cambridge University Press, pp: 404-419.
-
Valente AM, Acevedo P, Figueiredo AM, Fonseca C, Torres RT (2020) Overabundant wild ungulate populations in Europe: management with consideration of socioecological consequences. Mammal Rev 50: 353- 366.
-
Risch E, Boutin C, Roux P (2021) Applying life cycle assessment to assess the environmental performance of decentralized versus centralized wastewater systems. Water Research 196: 116991.
-
Coldiretti (2021) Covid: 2.3 million wild boars besiege cities and countryside.
-
Riga F, Genghini M, Cascone C, Di Luzio P (2011) Impact of ungulates on agricultural and forest crops: proposal for national guidelines. In: ISPRA Manuals and Guidelines, ISPRA, 68/2011.
-
Regione M (2014) Rural Development Programme (Regional)- Molise. Italy, pp: 1-641.
-
Regione M (2016-2021) Regional Faunistic Plan.
-
Regione Molise (2017) Regional Faunistic Plan, pp: 290.
-
Burrough PA (1986) Principles of Geographic Information Systems for Land Resource Assessment. Oxford Science Publications, New York, pp: 356.
-
Belda A, Zaragoza B, Martinez PJE, Peiro V, Ramon A, et al. (2012) Use of GIS to predict potential distribution areas for wild boar (Sus scrofa Linnaeus 1758) in Mediterranean regions (SE Spain). Italian Journal of Zoology 79(2): 252-265.
-
Giugni A, Ferretti M, Conti L (2016) GIS analysis applied to wildlife management. In: Impact risk maps of ungulates. GEOmedia 20(6): 28-33.
-
Raganella PE, Riga F, Toso S (2013) Guidelines for the management of ungulates. In: ISPRA Manuals and Guidelines, ISPRA 91/2013.
-
Istat (2021) Detection of road accidents with injuries to people: microdata for public use.
-
Rodriguez MB, Diaz VE, Marey PM (2013) Spatiotemporal analysis of vehicle collisions involving wild boar and roe deer in NW Spain. Accid Anal Prev 60: 121-133.
-
Svensson THG, Gren IM, Andersson H, Jansson G, Annika J (2014) Costs of Traffic Accidents with Wild Boar Populations in Sweden. Sweden.
-
Said MM, Mohd M, Faye I, Husain NA, Kamaruddin TT (2021) Review of Current Animal-Vehicle Collision (AVC) Studies. J Soc Automot Eng Malays 5: 64-71.
-
Bil M, Andrasik R, Dul’a M, Sedonik J (2019) On Reliable Identification of Factors Influencing Wildlife-Vehicle Collisions along Roads. J Environ Manag 237: 297-304.
-
Fedorca A, Fedorca M, Ionescu O, Jurj R, Ionescu G, et al. (2021) Sustainable Landscape Planning to Mitigate Wildlife–Vehicle Collisions. Land 10: 737.
-
Mateen A, Hanif MZ, Khatri N, Lee S, Nam SY (2022) Smart Roads for Autonomous Accident Detection and Warnings. Sensors 22(6): 2077.
-
Krukowicz T, Firla GK, Chrobot P (2022) Spatiotemporal Analysis of Road Crashes with Animals in Poland. Sustainability 14: 1253.
-
D’Amico M, Roman J, de los Reyes L, Revilla E (2015) Vertebrate Road-Kill Patterns in Mediterranean Habitats: Who, When and Where. Biol Conserv 191: 234-242.
-
Bartonicka T, Andrasik R, Dul’a M, Sedonik J, Bil M (2018) Identification of Local Factors Causing Clustering of Animal-Vehicle Collisions. J Wildl Manag 82: 940-947.
-
Aquino AGHEO, Nkomo SL (2021) Spatio-Temporal Patterns and Consequences of Road Kills: A Review. Animals 11(3): 799.
-
Ceralli D, Laureti L (2021) Carta della Natura della regione Molise: cartografia e valutazione degli habitat alla scala 1:25:000. In: Manuali e Linee guida ISPRA, ISPRA (Eds.), ISPRA Serie Rapporti 348/2021.
-
Gasparini P, Tabacchi G (2011) The National Inventory Of Forests And Forest Carbon Sinks. In: According to the Italian national forest inventory. Methods and results. The Ministry of Agricultural, Food and Forestry Policies, pp: 653.
-
QGis (2022) QGis 3.16 Desktop User Guide.
-
Johann F, Handschuh M, Linderoth P, Heurich M, Dormann CF, et al. (2020) Variability of daily space use in wild boar Sus scrofa. Wildlife Biology 2020(1): 1-12.
-
Laguna L, Barasona JA, Vicente J, Keuling O, Acevedo P (2021) Differences in wild boar spatial behaviour among land uses and management scenarios in Mediterranean ecosystems. Science of The Total Environment 796: 148966.
-
Copernicus (2014) The European Union Earth Observation programme.
-
ISTAT (2021) Borders of Administrative Units for Statistical Purposes as of 1 January 2023.
-
Regione Molise (1993) Norme per la protezione della fauna selvatica omeoterma e per il prelievo venatorio. Regional Law n. 19, August 10th, 1993.
-
Regione Molise (2021) Damage caused by wildlife crops, livestock, road users, map of roads most at risk.
-
Amico FD (2017) Modeling habitat suitability of the Molise region for some species of management and conservation concern. PhD Thesis, Università degli Studi di Parma, Dipartimento di scienze chimiche, della vita e della sostenibilità ambientale, pp: 83.
-
R Core Team R (2020) A language and environment for statistical computing. In: R Foundation for Statistical Computing, Vienna, Austria.
-
Legendre P, Legendre L (1998) Numerical ecology. In: 2nd edition (Edn.), Elsevier, pp: 853.
-
Boyce MS, McDonald LL (1999) Relating population to habitats using resource selection functions. Trends Ecol Evol 14(7): 268-272.
-
Boyce MS, Vernier PR, Nielsen SE, Schmiegelow FKA (2002) Evaluating resource selection functions. Ecological Modelling 157: 281-300.
-
MacKenzie DI (2005) What are the issues with ‘presence/ absence’ data for wildlife managers? Journal of Wildlife Management 69(3): 849-860.
-
Burnham KP, Anderson DR (2002) Model selection and multimodel inference: a practical information-theoretic approach. In: 2nd Editon (Edn.), New York: Springer- Verlag, pp: 515.
-
Akaike H (1973) Information theory as an extension of the maximum likelihood principle. In: Second International Symposium on Information Theory, Petrov B.N., Csaki F. (editors). Akademiai Kiado, pp: 267-281.
-
Zuur AF, Ieno EN, Elphick CS (2010) A protocol for data exploration to avoid common statistical problems: Data exploration. Methods in Ecology and Evolution 1(1): 3-14.
-
Quinn JP, Keough MJ (2002) Experimental Design and Data Analysis for Biologists. Cambridge University Press, pp: 1-557.
-
Fawcett T (2006) An introduction to ROC analysis. Pattern Recognition Letters 27: 861-874.
-
Pearce J, Ferrier S (2000) Evaluating the predictive performance of habitat models developed using logistic regression. Ecological Modelling 133(3): 225-245.
-
Bossard M, Feranec J, Otahel J (2000) CORINE land cover technical guide - Addendum 2000. In: Technical report No 40/2000. European Environment Agency, Copenhagen, pp: 105.
-
ISPRA (2009) Il Progetto Carta della Natura. Linee guida per la cartografia e la valutazione degli habitat alla Scala 1:50.000. In: Manuali e Linee guida ISPRA, ISPRA Eds., 48/2009.
-
Miraglia N, Brita AD (2022) Behavior of Wildlife Species in Urban Areas to Changing Conditions during COVID-19 Lockdowns: A Review. Journal of Applied Animal Welfare Science 25(2): 119-125.
-
Amici A, Serrani F, Rossi CM, Primi R (2012) Increase in crop damage caused by wildboard (Sus scrofa L.): “the refuge effect”. Agronomy for sustainable development 32(3): 683-692.
-
Perco F (2020) Technique and science of hunting management in Italy. A complexity to know. Greentime, pp: 414.
-
Mills LS, Doak DF, Wisdom MJ (2001) Elasticity analysis for conservation decision making: reply to Ehrlén et al. Conservation Biology 15(1): 281-283.
-
Brogi R, Apollonio M, Brivio F, Merli E, Grignolio S (2022) Behavioural syndromes going wild: individual risk-taking behaviours of free-ranging wild boar. Animal Behaviour 194: 79-88.
- Lessons to Learn: Trees are More than the Lungs of the World
- Community Forestry Enterprises as a Model for Sustainable Forest Development: The Case Of The "Baja Tarahumara" in Chihuahua, Mexico
- Ecological and Socio-Economic Impacts of Chromolaena odorata and Mesosphaerum suaveolens, Two Invasive Alien Species in Central and Southern Benin, West Africa
- Epigenetic Sustainability: Modeling the Human Factor as a Natural Resource through Science 4.0 and the NR3C1 Biological Pilot
- Growth-at-Risk: A Framework for Assessing Economic Vulnerability
- The Rural Territory as a Socioecological System for the Management of Public Policy for Sustainable Rural Development