Concentrations of Total Petroleum Hydrocarbons N-Alkanes in Surface Seawater from The Red Sea Coast of Hodeidah City, Yemen
Field work has been carried out to identify the occurrence of oil and oil by- product pollution from the Red Sea coast of Hodeidah city, was evaluated from December, 2021 to June, 2022. Surface seawater samples were collected from four stations and extracted using standard methods. The extracts were subsequently analyzed by gas chromatography-flame ionization detection. EPH aliphatic hydrocarbon standard 14 components (C9 – C36), high performance liquid chromatographic (HPLC) grade solvents and analytical grade reagents used for this work. The total concentration of aliphatic hydrocarbons n-alkanes (TPH) in surface seawater samples ranged from 9400.5 μg /l at Hodeidah harbor to 2409.7 μg /l at Hodeidah Power Plant in winter and from 4880.9 μg /l at Hodeidah Harbor to 1109.1 μg /l at Hodeida Power Plant in summer. This pollution is a consequence of localized oil operation and /or heavy ship traffic. The investigations in These locations can serve as a reference for future evaluations and studies.
Introduction
The onset of significant oil pollution can be traced back to the adoption of oil as a primary fuel source for maritime transport. This pollution escalated as industrial demands necessitated the transportation of goods across seawater bodies [1]. With the global economy increasingly reliant on international trade, the volume of goods transported between nations has surged. This upsurge has given rise to two principal sources of oil pollution: deliberate discharges and accidental spills of crude oil and oil derivatives [2].
More than half of the world’s proven oil reserves are located in the Arabian region, where exploration, production, processing, and transportation are concentrated. The majority of oil extracted from both onshore and offshore wells is earmarked for export (with less than 10% allocated for local refining and consumption). Annually, over 100 million tons of oil traverse the Red Sea, with the Arabian Sea and Gulf of Aden handling sixty percent of global oil shipments [3]. This regional dependency on oil and petrochemical industries has made ports focal points of activity. Despite their pivotal role in the regional economy, the production and transport of oil have emerged as significant sources of marine and coastal pollution. Approximately half of the oil destined for export from the Red Sea arrives at the Yanbu Port in Saudi Arabia via the Yanbu Petroline from the Gulf. Other oil export terminals can be found in Yemen, namely Ras Isa on the Red Sea, Bir Ali and Shihr on the Gulf of Aden coast, and the Sumed pipeline and terminal at Ain Sukhna, which transports oil to the Mediterranean. The Red Sea sees between 25,000 to 30,000 ship transits each year, mainly involving the transport of petrochemical products between Yanbu, the Suez Canal, and the Sumed pipeline [3].
The Hodeidah coast, including one of Yemen’s primary harbors on the Red Sea, plays a vital role in marine activities, fisheries, tourism, and serves as the entry point for humanitarian aid and approximately 70% of commercial imports into Yemen (UNICEF). The nearby port of Ras Isa, north of Al Hodeida, is the terminus of the Marib - Ras Isa oil pipeline from inland Yemen and is equipped with a significant storage and offloading vessel named FSO Safer. Hodeida’s coastline receives substantial quantities of petroleum and its by-products. Predominantly, common pollutants in the coastal areas of Hodeida stem from the discharge of ballast seawater effluent from the SAFER oil terminal at Ras Isa. A comparable issue is observed in the Gulf of Aden with vessels deballasting at the Aden refinery. However, the primary cause of oil pollution in Yemeni seawaters, particularly in the Red Sea, appears to be vessels deballasting during their transit. There are two power stations, Ras Katheb and Al- Mocha, which receive heavy fuel oil through underseawater pipelines, and incidents involving pipeline and loading hose accidents are frequent [4]. Additionally, sewage and wasteseawater treatment plants, along with trace metal compounds, contribute to the pollution.
Oil pollution has posed a serious threat to the coastal ecosystem of the Red Sea, affecting several coastal cities [5]. Preliminary surveys along Yemen’s Red Sea coast have shown the concentration of oil-related pollutants in specific regions, especially around oil loading terminals and certain industrial areas. Tar deposits on Yemeni beaches are widespread [6, 7].
Consequently, the findings of these investigations in the locations can serve as a reference for future evaluations and studies.
Material and Methods
Description of Study Area
The area under investigation is laying from the south eastern part of the Red Sea in the coast of Yemen, Hodeida City. It extends from Hodeidah Power Plant which is located at latitude 15° 00’ 20” N and longitude 42° 56’ 02” E to Fishing Port in the south at 14° 46’ 54” N latitude and 42° 56’ 50” E longitude. The distinctive areas are namely Al Hodeidah Harbor (st1), Hodeidah Power Plant (st2), Fishing Port (st3) and The Corniche of Al-Hodeidah (st4). Sampling was carried out on two seasons winter and summer during the year of 2021 and 2022.
Sample Collection
Samples were collected during the months of December 2021 and July 2022. Sampling locations were detected by using GPS localization system Figure 1. Triplicate seawater samples were collected from the surface - 5 cm of the surface seaseawater layers from two points (about 5 m apart) in each sampling station with precleaned amber bottles to obtain a representative station, each sample were collected in 1-liter amber glass bottles with Teflon-lined screw cap, a 5 mL of 1:1 hydrochloric acid (HCl) to a 1-liter sample was added immediately to the sample after collection to reduce the pH of the sample to less than 2.0 [8]. Collected samples were packed in icebox and transported immediately to the laboratory of (Yemen Standardization, Metrology and Quality Control Organization) for analysis. EPH aliphatic hydrocarbon standard 14 components (C9 – C36), high performance liquid chromatographic (HPLC) grade solvents and analytical grade reagents used for this work were sourced from Merck (Germany), Restek and Accustandard (USA).
Extraction of Petroleum Hydrocarbon from Surface Seawater Samples
A 1-liter of seawater sample was spiked with 1 mL of 10 𝜇g/mL 1-chlorooctadecane (COD) used as surrogate standard and subjected to liquid-liquid extraction method, extracted thrice in a separating funnel with 50 mL of n-hexane each time. The extracts were pooled together, dried with anhydrous sodium sulphate (20 g), and concentrated to approximately 2 mL using an air blowdown apparatus under a gentle stream of air, ready for column cleanup [8].
Silica Gel Cleanup and Separation.
The extracts were transferred into a 10 mm ID × 30 cm chromatographic column packed with 10 g alumina: Silica gel (80- 100 mesh). The extracts were sequentially eluted from the column with n-hexane. The eluates were concentrated to about 2 mL with an air blowdown apparatus under a gentle stream of air. Blank determinations were carried out by repeating the procedure with pre- extracted samples and analyzed by gas chromatography [8].
Gas Chromatography Analysis
All analyses were performed on (Shimadzu GC-2010 Plus) The chromatograph was equipped with a single injection connected with two parallel columns 30 m x 0.32 mm I.D., 0.25 µm film thickness Restek RTX-5, operated under the same conditions. Nitrogen (purity 99.9992%) was employed as a carrier gas. The oven temperature was at 60°C for time 1 min; to 290°C @ 8°C/min for 6.75 min; the total run time was 36.5 min, injection port temperature 285°C, Column Inlet Pressure 15 p.s.i.g, 315°C (FID) detector temperature and carrier gas linear velocity 50 cm/sec [8].
![Figure 1: Triplicate seawater samples were collected from the surface - 5 cm of the surface seaseawater layers from two points (about 5 m apart) in each sampling station with precleaned amber bottles to obtain a representative station, each sample were collected in 1-liter amber glass bottles with Teflon-lined screw cap, a 5 mL of 1:1 hydrochloric acid (HCl) to a 1-liter sample was added immediately to the sample after collection to reduce the pH of the sample to less than 2.0 [8]. Collected samples were packed in icebox and transported immediately to the laboratory of (Yemen Standardization, Metrology and Quality Control Organization) for analysis. EPH aliphatic hydrocarbon standard 14 components (C9 – C36), high performance liquid chromatographic (HPLC) grade solvents and analytical grade reagents used for this work were sourced from Merck (Germany), Restek and Accustandard (USA).](/fulltextimages/11403/fig_1.png)
The EPH (n-alkane) calibration standards curve are used to calibrate the GC/FID system. Calibration standards are prepared by serial dilution of the stock standard in the range of 1.0–20 𝜇g/mL using n-hexane as diluent. The curves were linear with correlation coefficients ranging from 0.9846 to 0.9919. Limits of detection (LOD) for n-alkanes were determined from 8 replicate injections of a middle level calibration standard. LOD was statistically calculated by multiplying the standard deviation of the instrument response by “𝑡” value at 99% confidence level.
Results
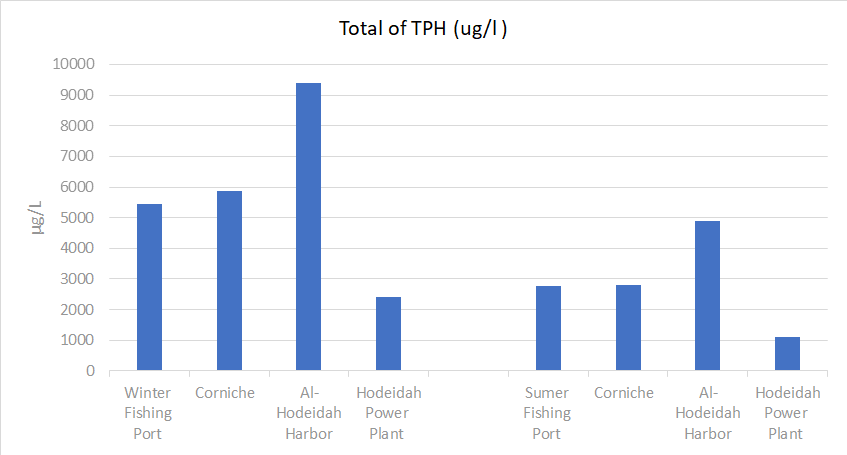
Total petroleum hydrocarbons n-alkanes (TPH) in the surface seawater of The Red Sea coast of Al-Hodeida city were evaluated in all the sampling points. The results covering two seasons (winter and summer) are summarized in Table 1 and spatial distribution of petroleum hydrocarbons in the seawater matrix is depicted in Figure 2.
| Winter | Summer | ||||||||
|---|---|---|---|---|---|---|---|---|---|
| Carbon Number | Name | Fishing Port | Corniche | Hodeidah Harbor | Power Plant | Fishing Port | Corniche | Hodeidah Harbor | Power Plant |
| 9 | n-Nonane | 371.1893 | 431.9247 | 801.2753 | 159.804 | 172.8523 | 206.2487 | 477.696 | 60.484 |
| 10 | n-Decane | 866.9157 | 994.9897 | 1874.572 | 403.4433 | 402.9827 | 486.0113 | 916.6667 | 173.4197 |
| 12 | n-Dodecane | 567.809 | 588.3773 | 1124.631 | 323.007 | 396.6423 | 386.7757 | 637.3627 | 113.626 |
| 14 | n-Tetradecane | 81.891 | 76.29833 | 161.9773 | 89.319 | 11.14933 | 14.849 | 44.22167 | 7.286 |
| 16 | n-Hexadecane | 172.0827 | 244.4503 | 493.3797 | 104.6113 | 60.18467 | 78.41633 | 233.4043 | 39.71967 |
| 18 | n-Octadecane | 225.592 | 353.7413 | 606.8237 | 158.0353 | 80.276 | 182.222 | 321.9147 | 73.68833 |
| 19 | n-Nonadecane | 243.4727 | 326.6597 | 474.7413 | 106.3203 | 189.356 | 205.7877 | 249.723 | 64.07433 |
| 20 | n-Eicosane | 221.3157 | 341.4843 | 605.2747 | 175.7003 | 88.16 | 177.3937 | 299.7433 | 106.487 |
| 22 | n-Docosane | 394.805 | 639.0687 | 816.2617 | 234.3953 | 394.6477 | 408.6267 | 495.9753 | 143.0763 |
| 24 | n-Tetracosane | 313.0147 | 486.261 | 916.1823 | 200.4817 | 111.2893 | 88.618 | 417.2797 | 117.988 |
| 26 | n-Hexacosane | 793.8623 | 554.564 | 761.9013 | 178.0503 | 204.616 | 136.3253 | 358.2887 | 78.939 |
| 28 | n-Octacosane | 762.2413 | 541.3133 | 499.485 | 153.3873 | 359.7153 | 206.5757 | 250.7287 | 61.22933 |
| 30 | n-Triacotane | 401.724 | 237.8783 | 233.6053 | 109.0973 | 262.8907 | 196.0723 | 149.2127 | 50.38267 |
| 36 | n-hexatriacotane | 45.886 | 38.15267 | 30.42767 | 14.11533 | 33.14267 | 25.837 | 28.75067 | 18.789 |
| Total | 5461.801 | 5855.164 | 9400.538 | 2409.768 | 2767.905 | 2799.759 | 4880.968 | 1109.189 |
Table 1: Seasonal variation of Total Petroleum Hydrocarbons N-Alkanes in Seawater Samples (μg/l).
| Area | Concentration (μg/l) | Source | |
|---|---|---|---|
| Alexandria coasts, Egypt | 2350.9 - 183817 | [9] | |
| Ubeji surface seawater, Warri, Nigeria | 73,500 | [10] | |
| Main Outfall Drain in Al-Nassiriya City, Southern Iraq | 0.01-8.76 | [11] | |
| The Red Sea, Saudi Arabia Coast | 147.2 - 174 | [12] | |
| Northwestern Arabian Gulf | 1.2-546 | [13] | |
| Deepseawater Horizon, Gulf of Mexico | 60,000-260,000 | [14] | |
| Strait of Johor, in Peninsular Malaysia | 25-2,795 | [15] | |
| Kara Sea | 8-408 | [16] | |
| Seawater of North Cape, Norway | 483 (mean) | [17] | |
| The Red Sea Coastal of Al Hodeidah City | 1109.1-9400.5 | Present study |
Table 2: Comparison of Petroleum Hydrocarbons Contents in Seawater Collected from different region of the world Unit= (μg/l).
Discussion
The concentration of Total Petroleum Hydrocarbons (TPH) in the study exhibited significant variation across the four locations, ranging from 9400.5 μg/l at Al-Hodeidah harbor to 2409.7 μg/l at Al-Hodeida Power Plant in winter, and from 4880.9 μg/l at Al-Hodeida Harbor to 1109.1 ug/l at Al-Hodeida Power Plant in summer (Table 1). It is a generally accepted criterion that seawater can be considered polluted when hydrocarbon concentrations exceed 2.0 μg/L [18]. Notably, the highest concentrations were consistently observed at Al-Hodeida harbor, followed by the Corniche of Al-Hodeida and the Fishing Port, as illustrated in Figure 2. These findings are indicative of TPH inputs resulting from direct discharges from boats with two-stroke engines and the deposition of fuel combustion residues from boats and vehicles, which were visibly observed during sampling activities. Boating activities, particularly instances of petroleum leakage and irresponsible disposal of engine oil from boats and ferries [19], are likely significant contributors to the recorded TPH levels in these areas. Additionally, frequent leaks from the reception of heavy fuel oil via pipelines at Al-Hodeidah harbor, as well as leaching processes, biological activity, and anchor disturbances in sediment, may reintroduce a minor quantity of TPH into the seawater column [20]. Despite the presence of oil basins beneath the harbors designed to contain oil leakage during crude oil and product unloading, human errors, negligence, and harbor traffic collectively contribute to petrogenic pollution. The higher values observed at Al-Hodeidah harbor and the Fishing Port can be attributed to the release of petroleum waste from ships and fuel handling operations. Among these sites, Al-Hodeidah Harbor, Corniche of Al- Hodeidah City, and the Fishing Port, which receive sewerage, stormseawater drains, and runoff from industrial (including the Fishing Port and Al-Hodeidah Harbor), residential, and commercial areas in Al-Hodeidah city, also contribute significantly to the TPH levels in these locations. The lowest concentrations of TPH were found at Hodeida power plant, which experiences fewer anthropogenic activities compared to the other locations in the study area. However, this power station is supplied by underseawater pipelines that receive heavy fuel oil, and frequent leaks and accidents occur in the pipelines and loading hoses. Additionally, a portion of TPH may originate from the cooling system seawater of the power plant, further contributing to the elevated TPH levels in this area [4].
Seasonal variation in Total Petroleum Hydrocarbons is evident, with concentrations being notably lower in summer compared to winter (Figure. 2). This discrepancy can be attributed to the greater discharge of total hydrocarbons during winter, primarily due to increased combustion processes and the heightened association of hydrocarbon compounds with atmospheric particles at lower ambient temperatures. Furthermore, hydrocarbon compounds deposited on land during the summer season do not reach the aquatic environment to the same extent as during winter when runoff from the land is more extensive, driven by rainstorms in the region [21]. Temperature is known to influence the activity of oil-degrading bacteria in seawater [22], with higher activity observed in summer. The photo- oxidation of oil components in a seawater environment is another contributing factor [23]. Intense solar radiation, coupled with relatively high-seawater temperatures and a higher rate of evaporation characteristic of subtropical climates, could account for the lower levels of hydrocarbon compounds in the seawater [24, 25, 26].
Conclusion
Petroleum hydrocarbons in the surface seawater on the Al-Hodeidah coast is caused by frequent inputs from localized sources such as sewerage, direct discharge of boats with two-stroke engine and the deposition of fuel combustion of boats and vehicles, frequently leakage from receiving heavy fuel oil via pipeline at Al-Hodeidah harbor. The distribution and concentrations of petroleum hydrocarbons depends on anthropogenic activities in locations, as well as the physic- chemical and biological factors.
Recommendations
These data are the first of their kind for this area and should furnish valuable information for future studies, both that they provide as the background values in the event of a major oil pollution incident. Continuous monitoring for petroleum hydrocarbons pollution in The Red Sea Coast of Al-Hodeidah is highly needed. Applying several technical and operational measures can reduce inputs from localized sources of pollution.
Acknowledgements
The authors wish to express their sincere gratitude and appreciation to Dr. Hagib, A. Al-Hagibi, Department of Environmental Science, Faculty of Petroleum and Natural Resources and anonymous reviewers for valuable comments and suggestions to improve the manuscript. Special thanks and gratitude are due to (The American Institute for Yemeni Studies for financial supported). Special thanks and gratitude also are due to (Yemen Standardization, Metrology and Quality Control Organization) for their help and supported.
References
-
National Research Council (1985) Oil in the Sea: inputs, fate s and effects. National Academy Press, Washington, DC.
-
Clark RB (2001) Marine Pollution. 5Ed. Oxford University Press Inc., New York.
-
Regional Organization for the Conservation of the Environment of the Red Sea and Gulf of Aden (PERSGA) (1998) Strategic Action Programme for the Red Sea and Gulf of Aden.
-
Al-Shwafi N (2008) Petrolum Hydrocarbons Pollution and Hydrographical studies on Mangrove and Coral Reef Environment in Yemeni Coast Red Sea. Journal of Hahdramout of Univ 15: 243-260.
-
Gladstone W, Tawfiq N, Nasr D, Andersen I, Cheung C, et al. (1999) Sustainable use of renewable resources and conservation in the Red Sea and Gulf of Aden: issues, needs and strategic actions. Ocean & Coastal Management 42(8): 671-697.
-
Al-Shwafi N (2001) Beach tar along the Red Sea Coast of Yemen Quantitative Estimation and Qualitative Determination, Ph.D. Thesis Dep. Earth and Environmental Science Fac Sci Sana’a Univ, pp: 196.
-
Rushdi AI, Ba-Issa AA, Ba-Bagi A (1991) Preliminary investigations of oil.
-
Massachusetts Department of Environmental Protection (2019) Method for the Determination of Extractable Petroleum Hydrocarbons (EPH).
-
Omayma EA, Sawsan AM, Abd ER, Mousa M (2015) Monitoring and Assessment of Petroleum Hydrocarbons in Surface Seaseawater along Alexandria Coasts, Egypt. International Journal of Environment 4: 70-86.
-
Adewuyi GO, Etchie OT, Ademoyegun OT (2011) Determination of total petroleum hydrocarbons and heavy metals in surface seawater and sediment of Ubeji River, Warri, Nigeria. Bioremediation Biodiversity and Bioavailability 5(1): 46-51.
-
Maktoof A, ALKhafaji BY, Al-Janabi ZZ (2014) Evaluation of total hydrocarbons levels and traces metals in seawater and sediment from main outfall drain in Al- Nassiriya City/Southern Iraq. Natural Resources 5(13): 795-803.
-
Awad H (1990) Hydrocarbon content in Red Sea surface seawaters and fishes in the region between Jeddah and Yanbu, Saudi Arabia. In: Proceedings of the First Conference on Environmental Sciences: 27-33.
-
El Samra MI, Emara HI, Shunbo F (1986) Dissolved petroleum hydrocarbon in the northwestern Arabian Gulf. Marine Pollution Bulletin 17(2): 65-68.
-
Sammarco PW, Kolian SR, Warby RA, Bouldin JL, Subra WA, et al. (2013) Distribution and concentrations of petroleum hydrocarbons associated with the BP/ Deepseawater Horizon Oil Spill, Gulf of 108 Mexico. Marine Pollution Bulletin 73(1): 129-143.
-
Abdullah R, Woon WC, Bakar RA (1996) Distribution of oil and grease and petroleum hydrocarbons in the Straits of Johor, Peninsular Malaysia. Bulletin of Environmental Contamination and Toxicology 57(1): 155-162.
-
Korshenko IM, Plotnikova T, Luchkov V (2005) Marine Seawater Pollution, Annual Report 2003, Hydrometeoizdat, St. Petersburg, Russia.
-
Reddy M, Quinn JG (1999) GC-MS analysis of total petroleum hydrocarbons and polycyclic aromatic hydrocarbons in seaseawater samples after the North Cape oil spill. Marine Pollution Bulletin 38(2): 126-135.
-
Keizer PD, Gordon DC (1973) Detection of trace amounts of oil in sea seawater by Fluorescence spectroscopy. J Fish Res Bd Can 30(8): 1039-1045.
-
DOE (2005) Malaysia Environmental Quality Report.
-
Neff JM (1979) Polycyclic Aromatic Hydrocarbons in the Aquatic Environment: Sources, Fates, and Biological Effects, Applied Science Publishers.
-
Al-Saad HT, Farid WA, Al-Adhub AY (2011) Distribution and seasonal variations of n-alkanes in some species of mollusks from Shatt Al Arab River. Mesopotamian Journal of Marine Science 26(2): 182-196.
-
Abdul–Retha AN (1997) Distribution and activity of oil degrading bacteria and its role in bioremediation of oil pollution in the North West Arabian Gulf region. Ph.D. thesis, College of Science, Basrah University, 135 p.
-
Ehrhardt M, Patrick G (1993) On the composition of dissolved and particulate association fossil fuel residence in Mediterranean Surface-seawater. Mar Chem 42(1): 57-70.
-
Bedair HM, Al-Saad HT (1992) Dissolved and particulate adsorbed hydrocarbons in the seawaters of Shatt al-Arab River, Iraq. Seawater Air Soil Pollution 61(3-4): 397-408.
-
Al-Saad HT, Al-Timari AAK (1993) Seasonal variation of dissolved normal alkanes in the seawater marshes of Iraq. Mar Poll Bull 26: 207-212.
-
Al–Saad HT (1995) Distribution and sources of hydrocarbons in Shatt Al– Arab estuary and N.W. Arabian Gulf. Ph.D. thesis, Basrah University, pp: 186.
- Lessons to Learn: Trees are More than the Lungs of the World
- Community Forestry Enterprises as a Model for Sustainable Forest Development: The Case Of The "Baja Tarahumara" in Chihuahua, Mexico
- Ecological and Socio-Economic Impacts of Chromolaena odorata and Mesosphaerum suaveolens, Two Invasive Alien Species in Central and Southern Benin, West Africa
- Epigenetic Sustainability: Modeling the Human Factor as a Natural Resource through Science 4.0 and the NR3C1 Biological Pilot
- Growth-at-Risk: A Framework for Assessing Economic Vulnerability
- The Rural Territory as a Socioecological System for the Management of Public Policy for Sustainable Rural Development