The Use of UAV in Mapping and Inventorying Mangrove Forest for Handling Climate Change
Mangrove forest are known to play a pivotal role in supporting the global carbon cycle by effectively mitigating greenhouse emissions and reducing the impact of climate change. However, the current conditions have increased concerns due to the escalating degradation of these ecosystems for development purposes. An area of particular concern is Tanjung Lalansoi, Osi Island, Eti Village, West Seram District. This region has the potential to harbor mangrove forest to store Biomass and Carbon. To address these environmental challenges, the use of remote sensing technology using Unmanned Aerial Vehicle (UAV) hold great potential due to its advantages. These include its cost-effectiveness and ability to provide spatial and up-todate data with high resolution. Therefore, this study aims to assess the ability of UAV to map mangrove forest, analyze Objectbased UAV imagery (ACUBO), as well as determine the relationship between tree height and diameter in the field and on UAV. Field surveys were carried out to obtain data on mangrove species and other supporting vegetation parameters, such as tree height and diameter. The results were used to perform accuracy tests between objects on UAV and in the field, as well as the calculation of biomass reserve and carbon content in the study area. The results on ACUBO for mangrove species showed an Overall Accuracy of 92.98%, with Producer Accuracy of 78%, 97%, 96.63%, and 85% in B. gymnorrhiza, C. tagal, R. stylosa, and R. apiculta, respectively. Meanwhile, User Accuracy of 88.89%, 97.73%, 73%, and 85.92% was obtained in B. gymnorrhiza, C. tagal, R. stylosa, and R. apiculata, respectively. This study revealed that there was a close relationship between tree height in UAV and the field, as shown in the regression equation Y = 0.0386 + 1.135X with R2 = 0.90. There was also a close association between the diameter in UAV and the field, and this was indicated by the regression equation Y = 4.638 +0.5588 X with R2 = 0.87.
Introduction
Unmanned Aerial Vehicle (UAV), commonly known as drone, is an aircraft with great potential for conducting large- scale and detailed surveys of natural resources. Furthermore, this aircraft is adept at producing high-resolution maps, accurate models, and telemetry data. Several studies have also reported its utility for filmmaking and video shooting in the film industry. UAV can be equipped with special equipment for special tasks, such as firefighting high-rise buildings, as well as advanced military equipment for bolstering national defense and security. At present, nations across the globe are grappling with the escalating concern of global warming, which is the major cause of climate change. This apprehension is well-founded because climate change causes various damages in the form of progressive and frequent natural disasters. The primary catalyst behind this phenomenon is the escalating accumulation of greenhouse gases (GHG) in the atmosphere. This accumulation is caused by the use of fossil fuels, along with the emission of pollutants and waste from industrial and household sources, as well as transportation facilities. The adverse effects of deforestation and the degradation of forest also play a contributory role.
The correlation between deforestation, forest degradation, and the absorption and emission of GHG in an area is undeniable. Forest that are consistently preserved and enhanced in quality possess a significant ability to absorb GHG, thereby combatting climate change. Meanwhile, the escalating prevalence of deforestation and forest degradation, often driven by land conversion for other purposes, such as infrastructure expansion and urban settlements, invariably leads to increased release of these gases. This, in turn, fuels the far-reaching impacts of global climate change. The aspiration of addressing this problem encompasses the achievement of a scenario, where the rate of GHG absorption is higher than the level of emissions. The achievement of this equilibrium relies on the implementation of strategies to curtail emissions, particularly from forestry and land sectors. In this context, various countries must strive to integrate specific targets into their national development plans. These targets are expected to delineate the trajectory towards achieving a state where the absorption of these gases overtakes their release. This method allows for ongoing national development, while concurrently prioritizing efforts to achieve GHG balance. Furthermore, this initiative, within the context of climate change, is recognized as the FOLU Net Sink program. Several reports have shown that the availability of high-resolution maps from both satellite and UAV imagery is needed in tackling climate change.
The ability of forest, specifically mangrove forest, to serve as carbon reservoirs is remarkable, with estimated storage reaching 1.023 Mg/hectare [1]. According to Giri C [2], mangrove forest are characterized by dominant woody vegetation thriving in tropical regions across more than 100 countries and territories around the world. Despite their ecological significance, these regions continue to experience an alarming decline in quality due to several factors, including increased land use change, deforestation, and climate change. These change can potentially alter the role of mangrove forest as the source of carbon sequestration [3]. In the context of forest inventory, remote sensing has harnessed diverse satellite imagery, spanning from low to high resolutions. According to Buzatu A [4], satellite imagery is a valuable resource for acquiring spatial and temporal information, particularly through vegetation analysis and biophysical indices. The application of remote sensing methods can be used to monitor forest health, as evidenced by the study conducted on the level of tree defoliation caused by the gypsy moth (Lymantria dispar) in the Oltenia region of Romania. This method shows both effectiveness and ease of implementation, serving as a complementary tool to field- based efforts aimed at monitoring and assessing the impact of L. dispar infestations.
Although satellite imagery is a valuable tool, it often faces limitations due to cloud cover, particularly in tropical regions. Apart from satellite imagery, UAV is another technology that is capable of producing highly detailed images with high resolution. At present, UAV equipped with cameras have gained significant traction in small-scale forest inventories due to its cost-effectiveness and adaptability [5]. The use of this technology has showcased its potential in capturing high-resolution images that can be used to identify mangrove species [6]. Moreover, a recent prevalent method involves the use of an object-based method combined with high-resolution imagery to accurately map mangrove species [7]. For example, Wang D [8] reported that this method had a higher level of accuracy compared to the pixel-based method using the 0.5 m Pleiades-1 image.
The use of UAV imagery stands as a crucial dimension in identifying mangrove vegetation. The identification of distinct species holds significant importance in the field of forest management, as their characteristics can provide the necessary information about geomorphic and environmental conditions and change [9]. However, the task of accurately mapping mangrove continues to present challenges [10, 11]. The primary obstacle lies in the intricate nature of conducting the process for each tree, considering their potential diminutive size compared to image resolution. Furthermore, the complex aspect arises due to the propensity of mangrove tree species to thrive within mixed communities, where closely related genera and species exhibit similar spectral reflections. This indicates that mapping mangrove with drones requires a study on determining the classification of species and testing their accuracy, calculation of the crown cover area and tree height extraction with UAV Imagery, the relationship between crown diameter at UAV and in the field, and the association between tree height at UAV and in the field.
Materials and Methods
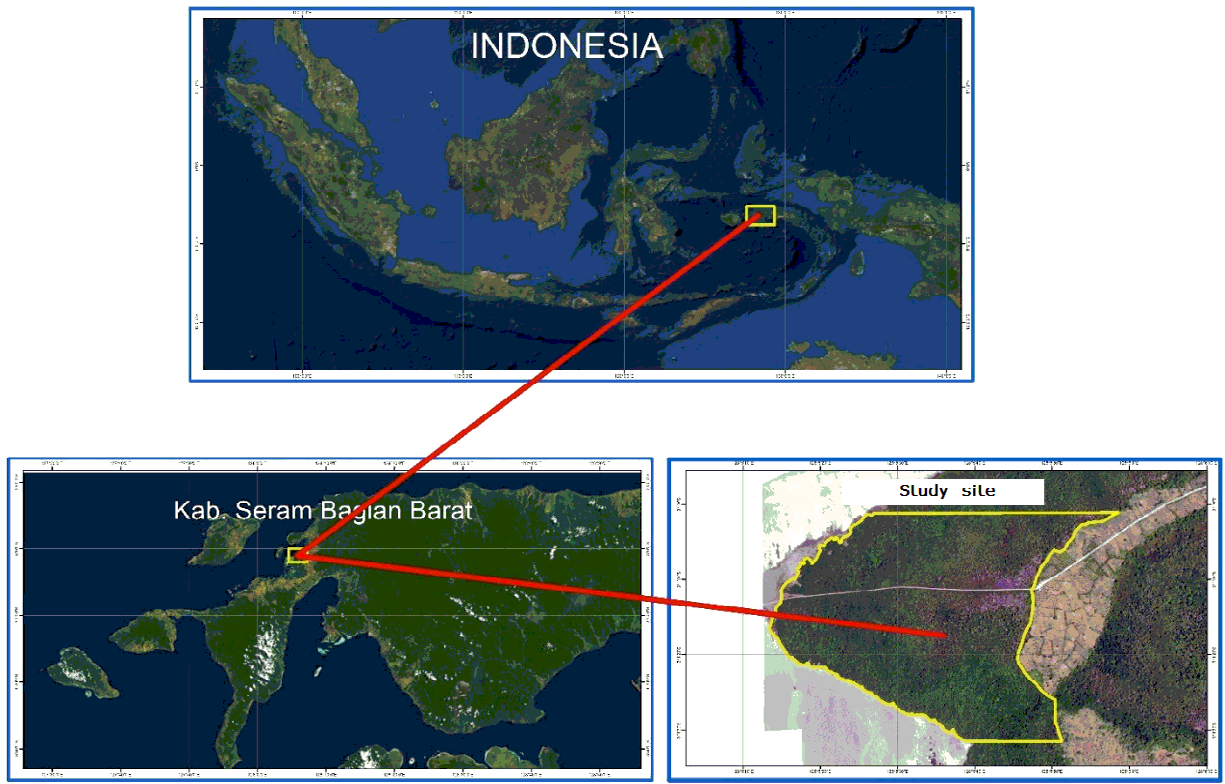
The mangrove forest in West Seram Regency occupied a total land area of 3,823.3 ha, with its distribution covering Kotania (Kotania Bay), Kaibobu, Piru, Aryate (Piru Bay), Rumahkay (Seram Strait), Buano, and Kelang Island [12]. According to the 1993 Landsat-5 Image statistics, the
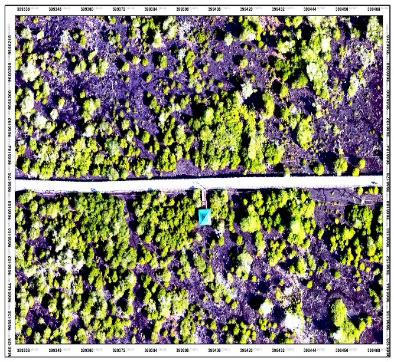
mangrove forest area in Kotania Bay to Pelita Jaya was 1,171.5 ha but reduced to 1,146.7 ha in 1997 [13]. This showed that within a period of four years, there had been a drastic reduction of approximately 6.2 ha/year. Therefore, the study was conducted in Tanjung Lalansoi, Osi Island, which was administratively located in Pelita Jaya Hamlet, Eti Village, Maluku, Eastern Indonesia. The area of the study location based on the delineation results was 40 Ha, as shown in Figure 1.
Mangrove mapping activities with drones began with the establishment of a good flight path plan. Apart from determining the flight path, the flight altitude, terrain conditions, and various factors that could affect the data collection process were considered. Furthermore, this planning was carried out to ensure that the photos obtained had good quality. The data recording process was performed using a DJI Phantom 4 Pro type drone with a camera resolution of 20 MP and the ability to fly for 30 minutes per battery. The Drone Deploy application used was based on iOS and Android and could be used to estimate the number and duration of flights based on the predetermined parameters. The flying height of the device had a significant influence on the quality of the photos taken. Flying altitude gave the photos a wider coverage, thereby making them more economical. In this study, the altitude for flight and recording was 100 m with a pixel resolution or Ground Sample Distance (GSD) of 3.0 cm/px.
The process was continued with the determination of the flight path, including the transect lines, waypoints, and elevation. The distance between the photos in relation to the percentage of overlap as well as the number of photos to be taken were considered. The software for designing routes and monitoring the routes was then selected. Overlapping in the process of making a flight plan included both overlap and sidelap. Due to the variation in vegetation relief, the Front Overlap and Side Overlap were both set at 75%. The drone flight speed was set at 10 m/s with more stable recording, and the data obtained were processed using Agisoft Methashape Professional software. This software was used to process the aerial photos recorded using UAV and then processed to produce a mosaic orthophoto. Furthermore, the data was processed into information on the current condition of the distribution of objects and the environment. The stages involved in the process of making orthophotos and Digital Elevation Model (DEM) dataset included: (1) Photo Import and Airline Reconstruction; (2) Align Photos; (3) Creating Dense Point Cloud (DPC); (4) Making Mesh, and (5) Making Texture Models, DEM, Orthophoto.
An object-based image analysis (OBIA) was used to delineate and classify the composition of mangrove within the study area. This method entailed a classification method rooted in the fusion of segmentation and object analysis. Furthermore, the process hinged on the intricate interplay of spatial, spectral, and temporal scale characteristics. This led to the creation of an image object or segments, which were used for classification [14, 15] and segmentation. Benz [16] stated that the most widely used segmentation was the multi- resolution, bottom-up region aggregation method. In this study, the Multi-Resolution Segmentation (MRS) algorithm was used, with three important parameters, including shape, compactness, and scale [17]. The values used in the shape and compactness parameters ranged from 0-1, while the scale was an abstraction in determining the maximum heterogeneity value to generate an object.
Mangrove species classification scheme used was the Support Vector Machine (SVM) Scheme. Subsequently, these classification models were executed and computerized. SVM was a well-known machine-based core learning method and had proven to be one of the most widely used and efficient classifiers [18]. It was often used to find the optimal classification method, with the primary objective of separating hyperplanes to assume the separability of all groups involved. SVM could also be used to maximize the interval between fields supported by data of each type.
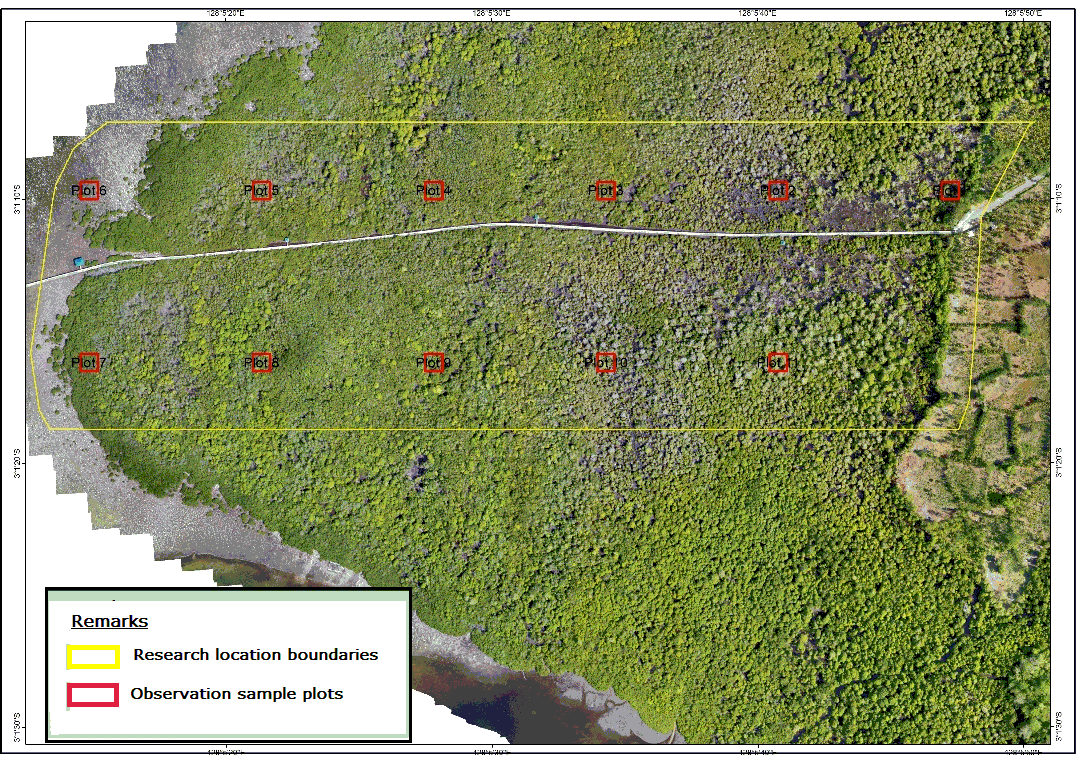
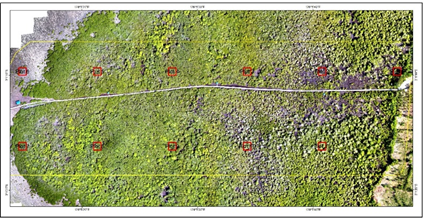
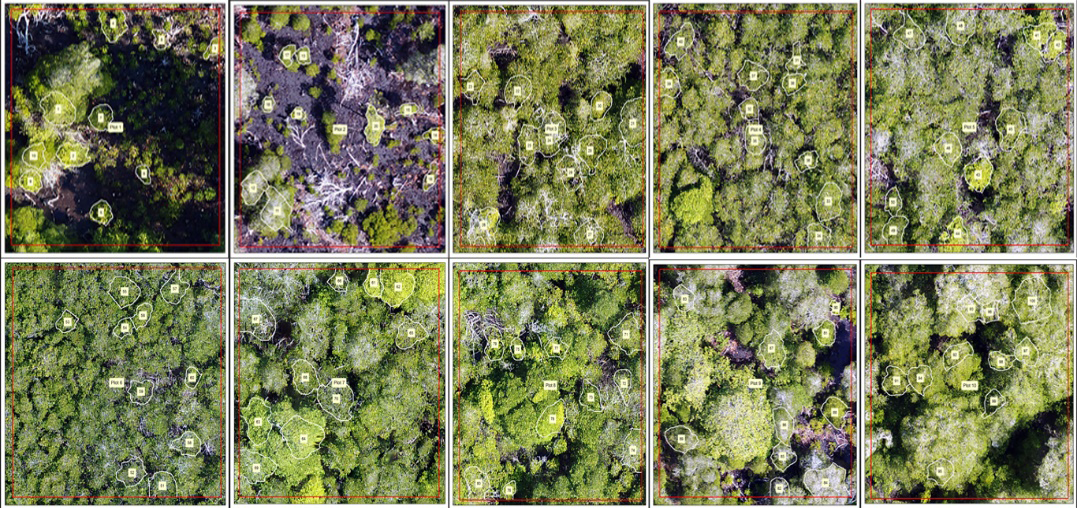
The stratified systematic sampling method was employed for the selection of mangrove on a plot measuring 20 x 20 m2. The area of the study location was 40 hectares, with a sampling intensity of 1%. The distance between the sampling plots was 180 m, with a total of 11 plots and an area of 400 m2/plot. Meanwhile, the purposive sampling method was used for tree height and diameter on 10 sample plots measuring 20 x 20 m, with a total sample of 10 species/ plot. Each sample taken was then measured for the height and diameter of each type of mangrove found in the field. The field sampling plots for the identification of mangrove species are presented in Figure 2.
The accuracy test using the confusion matrix referred to Congalton RG [19] and consisted of overall accuracy accuracy (OA), producer accuracy (PA), and user accuracy (UA). The determination of segmentation results and the best combination of segmentation parameters in determining the composition of mangrove vegetation species was carried out using the principle of the confusion matrix.
The process of crown cover area was performed by manually digitizing each tree in a 20 x 20 m sample plot using UAV ortho-mosaic images from ArcGIS. Subsequently, the area is calculated to represent the canopy cover area and used to produce the crown diameter. The process of calculating tree diameter using the crown area was performed using the appropriate segment area [20, 21], as shown in the formula:
(1) where: D: denotes the diameter of an individual tree, A: represents the header area The results of the header area were digitized manually and then converted into a shape file. This information was used to estimate individual tree parameters. The location of the tree crown was represented by the position of the middle segment of each tree segment. The formula for generating the Canopy Height Model (CHM), which represented the tree height is presented below:
CHM = DSM – DTM [22] (2)
Data analysis was carried out to determine the relationship between crown height at UAV and on the field, as well as crown diameter at UAV and tree diameter in the field. Furthermore, the relationship between tree height at UAV and in the field was analyzed using the Crown Height Model (CHM), which was a product calculated as relative height using the Digital Surface Model (DSM) and Digital Terrain Model (DTM) [23]. Calculation of the diameter of mangrove tree was performed using the area of the canopy that had been visually digitized into segments/polygons with UAV imagery.
Results
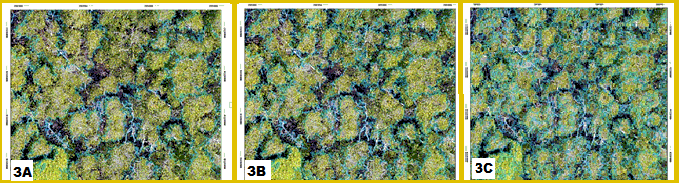
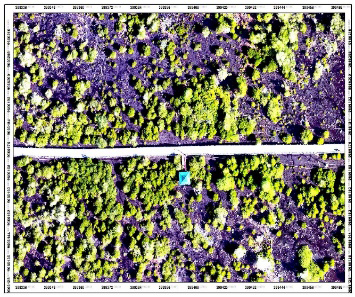
The initial stage in object-oriented image classification was image segmentation. A total of 9,231 objects were obtained from the segmentation process, with Shape 0.1 and the application of 3 scales, namely 100, 150, and 250, as shown in Figure 3.
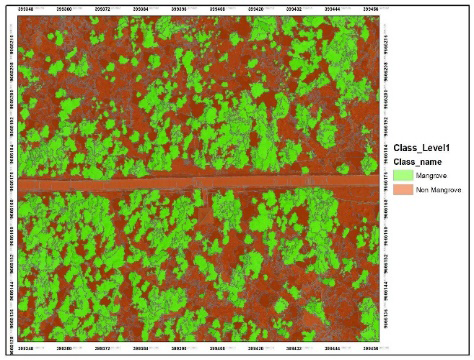
After segmentation, the process continued with classification, which was used to separate mangrove and non-mangrove. The segmentation results at Level 1 obtained
$$ \rightarrow $$
28,937 classified mangrove objects (green color) and 9,231 non-mangrove objects (brown color), as shown in Figure 4.
The next activity was the classification of mangrove species using the SVM algorithm. Based on the results of the segmentation characteristics, 4 classes or types were
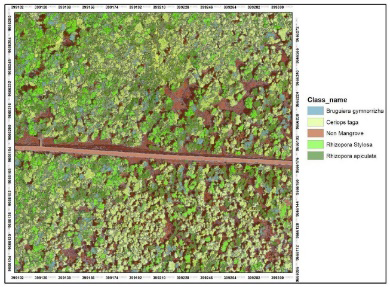

$$ \rightarrow $$ Figure 5: The results of the classification of mangrove species.
obtained, including Ceriops tagal, Bruguiera gymnorrhiza, Rhizophora stylosa, and Rhizophora apiculata. The classification results of mangrove are presented in Figure 5.
$$ \rightarrow $$
The results showed a total of 88, 41, 89, and 67 trees for C. tagal, B. gymnorrhiza, R. stylosa, and R. apiculata, respectively. The number of samples taken from the four mangrove species is presented in Table 1, and their distribution is visually displayed from the drone recording results in Figure 6.
| No | Mangrove Species | Sample Plot | Grand Total | ||||||||||
|---|---|---|---|---|---|---|---|---|---|---|---|---|---|
| 1 | 2 | 3 | 4 | 5 | 6 | 7 | 8 | 9 | 10 | 11 | |||
| 1 | B. gymnorrizha | 8 | 16 | 17 | 41 | ||||||||
| 2 | C. tagal | 13 | 29 | 24 | 22 | 88 | |||||||
| 3 | R. apiculata | 17 | 24 | 5 | 4 | 17 | 67 | ||||||
| 4 | R. stylosa | 19 | 8 | 43 | 19 | 89 | |||||||
| Grand Total | 13 | 29 | 25 | 40 | 24 | 8 | 43 | 23 | 34 | 24 | 22 | 285 |
Table 1: Field sampling results.
Based on the accuracy test results using 285 random validation points, the PA for Bg, Ct, Rs, and Ra was 78%, 97%, 96.63%, and 91.04%. Meanwhile, the UA for Bg, Ct, Rs, and Ra was 88.89%, 97.73%, 97.73%, and 85%, respectively, to obtain a total Overall Accuracy of 92.98%. The Confusion Matrix of mangrove classification results is presented in Table 2.
| Class of image | Sample of the field | Total | UA | ||||
|---|---|---|---|---|---|---|---|
| Bg | Ct | Rs | Ra | NM | |||
| Bg | 32 | - | - | 4 | - | 36 | 88.89 |
| Ct | - | 86 | 1 | 1 | - | 88 | 97.73 |
| Rs | - | 1 | 86 | 1 | - | 88 | 97.73 |
| Ra | 9 | - | 1 | 61 | - | 71 | 85.92 |
| NM | - | 1 | 1 | - | - | 2 | 0 |
| Total | 41 | 88 | 89 | 67 | 0 | 285 | - |
| PA | 78.05 | 97.73 | 96.63 | 91.04 | 0 | OA | 92.98 |
Table 2: Confusion matrix of mangrove classification results. Remarks: _Bg_ = _B. gymnorrizha_ OA = Overal accuracy _Ct_ _= C. ta
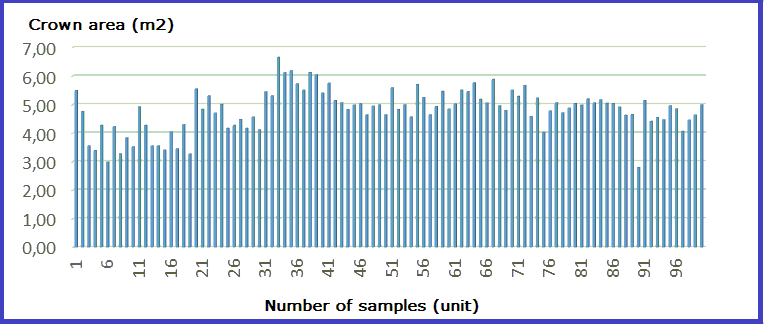
The canopy area extraction process was carried out through manual digitization using UAV imagery on the screen, and the results are presented in Figure 7.
The total area of mangrove canopy cover was 480.80 m2, where the average crown area was 4.81 m2, with a maximum of 6.65 m2 in B. gymnorrhiza plots and a minimum of 2.80 m2 in C. tagal plots. Furthermore, the standard deviation obtained was 0.74 with a standard error of 0.07. This indicated that the value was very small and the data representation was very good, as shown in Figure 8.
The results of calculating the diameter of mangrove crown obtained a value of 1,392.35 cm, with an average of 13.92 cm. The maximum tree diameter of 16.43 cm was found in Plot 4 (B. gymnorrhiza), while the minimum of 10.65 cm was obtained in Plot 9 (C. tagal) with 1.10 Standard Deviation and 0.11 Standard Error. Furthermore, the calculation of tree diameter in the field was performed through direct measurement using UAV imagery. The measurements were carried out with a tape measure against the circumference of each tree type, and the values obtained were converted into the parameter. The total diameter of the samples was 1,661.47 cm, with a maximum of 19.97 cm in Plot 4 (B. gymnorrhiza) and a minimum of 10.88 cm in Plot 9 (C. tagal). Other variables obtained included a 16.61 cm average diameter, 1.84 Standard Deviation, and 0.18 Standard Error. The results of calculating the diameter of UAV and Field Diameter had significant errors or differences. Errors from both data were shown in the gray line in Figure 9. The difference trend data showed the highest point of 4.89 cm in Plot 4 (B. gymnorisa) and the lowest point of 0.23 cm in Plot 9 (C. tagal), with a 2.69 cm average difference, 0.90 Standard Deviation, and 0.09 Standard Error. The distribution of UAV diameters and field diameters are presented in Figure 9A.
Calculation of the tree height parameter could also be performed using drone imagery and DSM subtraction, with the DTM serving as CHM. The CHM was a product of SfM, which was calculated as relative height using DSM and DTM [23]. The estimated total tree height calculation for UAV with CHM was 1,165.76 m, with a maximum value of 21.76 m in Plot 7 (R. apiculata) and a minimum of 4.28 m in Plot 1 (C. tagal). The average yield of UAV tree height was 11.66
m with 4.29m Standard Deviation and 0.43 Standard Error. The measurement of this parameter in the field was also carried out on trees that were determined as samples. The total tree height was 1,023.61 m, with the highest of 16.96 m in Plot 7 (R. apiculata) and the lowest of 3.00 m in Plot 1 (C. tagal). Furthermore, the average field tree height was 10.24 m, with 3.58 m Standard Deviation and 0.36 Standard Error. The distribution of UAV and field tree heights is presented in Figure 9B.
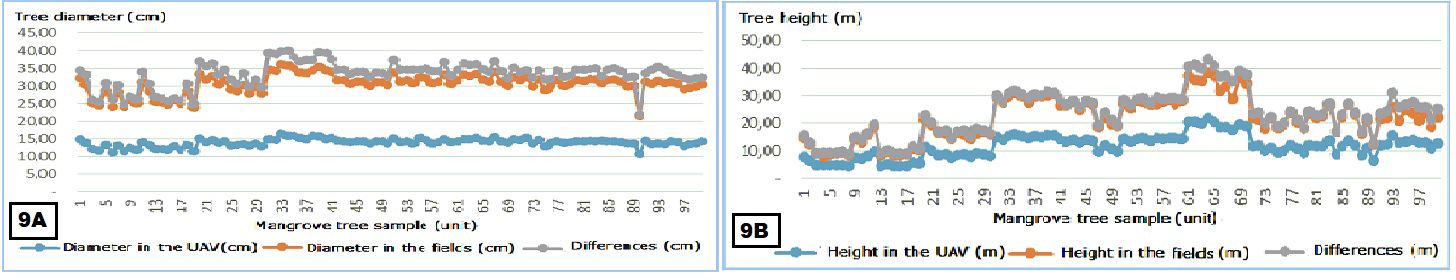
The results of calculating the height of the trees at UAV and the field showed a difference or error. The difference or error between the two data is shown in the gray line. Furthermore, the difference trend data showed the highest point of 6.33 cm in Plot 7 (R. stylosa) with the lowest point of 0.08 cm in Plot 1 (C. tagal). The average difference was 1.42 cm, with 1.46 Standard Deviation and 0.15 Standard Error.
Discussion
This segmentation aimed to obtain optimal compatibility between the images in geographic features that existed in real-world objects. According to Anggoro A [24], the process produced a set of image object layers in a hierarchical network. Furthermore, the algorithm used was multiresolution segmentation, which was considered the best for describing the actual conditions. The algorithm was also a region-merging method that grouped areas with similarities and adjacent pixels into objects. The formation of objects in the segmentation process was carried out at 2 levels, namely Levels 1 and 2. The process was performed by creating segments to separate mangrove and non-mangrove, as well as classifying them based on species. The scale in the segmentation process of ACUBO was used to determine the maximum amount of image object heterogeneity. The 250 scale with a shape index of 0.1 and compactness of 0.5 was selected because it was more efficient and could capture mangrove canopy cover from small to wider areas.
The use of the SVM algorithm showed high accuracy because it could transform data in the input space into a higher dimensional space, and optimization was carried out in the new vector area. Based on the results, SVM was different from general machine learning algorithm solutions, which performed parameter optimization in the transform space with a lower dimension compared to the input space dimension. Apart from its ability to minimize the error factor in the training set, SVM could also minimize one more factor that was influenced by the VC (Vapnik-Chervokinensis) dimension. This strategy was called structural risk minimization (SRM), and it was achieved in SVM by choosing a hyperplane with the largest margin. which functioned as a separator for two classes in the input space. Another important aspect that must be considered was the results of visual observations by observers in the field as well as their ability to analyze and describe the results properly. The proper interpretation of the results was expected to support the classification process using computerized data.
According to Mountrakis G [25], the SVM algorithm in remote sensing had a good ability to handle small amounts of data and could produce better accuracy compared to other classification methods. The main factor influencing the increase in accuracy during its usage was the capacity to distinguish objects properly during the use of data with unknown empirical probability characteristics [26].
Accuracy test results with Confusion Matrix obtained an OA of 92.98%. This showed that the objects in UAV image and their actual state in the field could be accurately detected. However, it was very difficult to measure crown diameter in the field because the process was performed by measuring two orthogonal/perpendicular distances and the average was taken as the parameter. This measurement was also very subjective and was heavily influenced by surveyor errors in measuring the projection of the edge of the canopy. During the measurement, the calculation of mangrove stand parameters was carried out in the form of tree canopy cover area extraction.
The calculation of the Tree Diameter parameter on UAV was largely determined by the results of the onscreen digitization. The results of this study showed the maximum crown area data for each mangrove tree and the species scattered in each sample plot. The data obtained showed that the samples taken were very diverse, as indicated by the Standard Deviation value of each sample digitized from UAV image. Furthermore, the image had a high image resolution (CSRT) of 0.74, a long distance, and an average canopy value of 4.81 cm. The sample representativeness showed representation and this was shown by the small Standard Error value of 0.07. The canopy area data were extracted using various equations [20, 21] to obtain Mangrove Tree Diameter, while the parameter was measured directly and carefully on the same sample in the field. The results of calculating the diameter of the tree at UAV and in the field showed very diverse data, where the Standard Deviation value was far from the average value. The representativeness of the sample was shown to be very good because the Standard Error for both datasets was small. The average data for calculating the diameter of UAV and the field showed that there was a difference or error of 2.69 cm, where the value obtained for UAV was smaller compared to the field. Based on the results, the onscreen digitization process had not been optimally carried out when compared to the results of measurements in the field, which had been carried out carefully and thoroughly using a measuring tape. From these results, it was necessary to optimize the on-screen digitization, which was better or could use a more optimal digital digitization method.
A previous study conducted by Otero V [27] focused on obtaining tree heights from UAV CHM mangrove-protected areas and productive mangrove in the Matang Mangrove Forest Reserve in Peninsular, Malaysia. The results showed that there was little difference between the mean tree heights obtained from CHM (UAV) compared to field measurements in the productive zone, namely 14 m and 13.7 m, respectively. In the protective zone, the average value from CHM at UAV was 15.5 m, with field assessment showing
14.2 m. The parameter of UAV tree height was determined by the CHM produced through the extraction process from DSM and DTM, while data in the field was determined by the precision of field measurements. The distribution of sampling for measuring the parameter at UAV and in the field showed that the samples used were very diverse. This could be seen from the large standard deviation value, which was very far from the sample mean value. Furthermore, the representativeness was very good because the standard error value was small. The average tree height data at both locations showed a difference of 1.42 m, where the results at UAV were higher. This confirmed that the Tree Height Model was very effective because it detected the highest point of the crown in the specified canopy segment, while manual height measurements using a hagameter could not detect the tallest tree. The assessment was also influenced by field conditions, such as access to shooting tree height and wind conditions, leading to instability of the canopy.
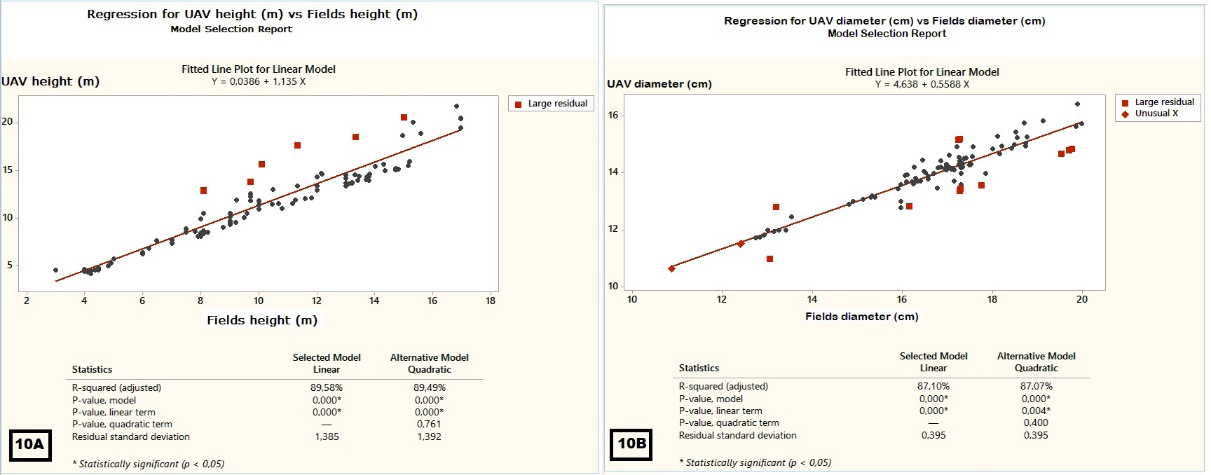
The relationship between tree height at UAV and in the field, as well as the association between UAV and field diameters, was determined using a simple regression line equation. Based on the analysis results, there was a relationship between height from DEM data in the aerial photo processing and UAV, which was then extracted into DSM and DTM. The results of the DSM and DTM extraction, which became UAV tree height data had a strong association with the dataset measured in the field with the regression equation Y = 0.0386 + 1.135X, with R2 = 0.90. The relationship between UAV and field tree height is presented in Figure 10A.
Diameter data on UAV was the result of extraction of the canopy area dataset obtained from the onscreen delineation of the selected sample. Furthermore, the diameter data in the field was obtained from the measurement results using a measuring tape. The relationship between the parameter at UAV and in the field of mangrove species selected as the sample had a strong correlation with the regression equation Y = 4.638 +0.5588 X and R2 = 0.87, as shown in Figure 10B.
The strong relationship between tree height and diameter at UAV and in the field showed that drone mapping gave good results for various activities in forestry sector, specifically in forest inventory and planning. Despite the low resolution of remote sensing products from Sentinel 2 compared to drones alone, the method showed fairly good results between remote sensing-based estimates and laboratory measurement values for most water physicochemical parameters in Danube Delta (Romania) [28].
Conclusion
In conclusion, the ACUBO process, which was carried out by separating the Ortomosaic Data into segments with the Multiresolution segmentation algorithm and then classified into the species level with the SVM algorithm produced four types of mangrove, namely R. apiculata, R. stylosa, B. gymnorrhiza, and C. tagal. Furthermore, the drone mapping results were very effective with an OA value of 92.98%. Calculation of mangrove tree parameters was carried out by extracting DSM and DTM data. These data sources could produce a Tree Height Model with CHM. The results revealed that there was a strong relationship between tree height at UAV and in the field, as well as between diameter at UAV and in the field. Based on these results, mapping with drones provided good results for various activities in forestry sector.
Acknowledgment
The author would like to thank the Director of the Postgraduate Program at Pattimura University for supporting this research so that it can run smoothly and well. Declaration of the authors The authors declare that there is no conflict of interest regarding the publishing of the paper, and this study does not include any form of plagiarism. References
1. Donato DC (2011) Mangroves among the most carbon- rich forests in the tropics. Nature Geoscience 4(5): 293- 297.
2. Giri C (2011) Status and distribution of mangrove forests of the world using earth observation satellite data. Global Ecology and Biogeography 20(1): 154-159.
3. Thomas N (2017) Distribution and drivers of global mangrove forest change, 1996-2010. PLoS ONE 12(6): 1-14.
4. Buzatu A (2023) The use of remote sensing indices derived from Sentinel 2 satellite images for the defoliation damage assessment of Lymantria dispar. Annals of Forest Research 66(1): 3-19.
5. Zahawi RA (2015) Using lightweight unmanned aerial vehicles to monitor tropical forest recovery. Biological Conservation 186: 287-295.
6. Cao J (2018) Object-Based mangrove species classification using unmanned aerial vehicle hyperspectral images and digital surface models. Remote Sensing, 10(1): 89.
7. Pham TD (2019) Remote Sensing Approaches for Monitoring Mangrove Species, Structure, and Biomass. Remote Sensing 11(3): 1-24.
8. Wang D (2018) Artificial mangrove species mapping using Pléiades-1: An evaluation of pixel-based and object-based classifications with selected machine learning algorithms. Remote Sensing 10(2): 1-22.
9. Iii RRL (2005) Ecological engineering for successful management and restoration of mangrove forests Ecological engineering for successful management and restoration of mangrove forests. Ecological Engineering 24(4): 403-418.
10. Heumann BW (2011) Progress in Physical Geography opportunities. Progress in Physical Geography 35(1): 87-108.
11. Kuenzer C (2011) Remote sensing of mangrove ecosystems: A review. Remote Sensing 3(5): 878-928.
12. Pattimahu DV (2016) Analisis Perubahan Penutupan Lahan Mangrove Di Kabupaten Seram Bagian Barat Maluku. Jurnal Hutan Pulau-Pulau Kecil 1(1): 22-27.
13. Tupan CI (2000) Kondisi Potensi dan Pemanfaatan Ekosistem Mangrove di Teluk Pelita Jaya, Seram Barat, Maluku. Institut Pertanian Bogor.
14. Wang L (2004) Integration of object-based and pixel- based classification for mapping mangroves with IKONOS imagery. International Journal of Remote Sensing 25(24): 5655-5668.
15. Blaschke T (2010) Object based image analysis for remote sensing. Journal of Photogrammetry and Remote Sensing 65(1): 2-16.
16. Benz UC (2004) Multi-resolution, object-oriented fuzzy analysis of remote sensing data for GIS-ready information. Journal of Photogrammetry Remote Sensing 58(4): 239-258.
17. La Ode Khairum Mastu, Bisman Nababan, dan JPP (2018) Pemetaan habitat bentik berbasis objek menggunakan citra sentinel-2 di perairan pulau wangi- wangi kabupaten wakatobi. Jurnal Ilmu dan Teknologi Kelautan Tropis 10(2): 381-396.
18. Féret J, Asner GP (2012) Semi-Supervised Methods to Identify Individual Crowns of Lowland Tropical Canopy Species Using Imaging Spectroscopy and LiDAR. Remote Sensing 4(8): 2457-2476.
19. Congalton RG, Green K (2009) Assessing The Accuracy Of Remotely Sensed Data: Principles And Practices. Florida: CRC Press, Boca Raton, Florida.
20. Hyyppä J (2001) A Segmentation-Based Method to Retrieve Stem Volume Estimates from 3-D Tree Height Models Produced by Laser Scanners. A Segmentation- Based Method to Retrieve Stem Volume Estimates from 3-D Tree Height Models Produced by Laser Scanners 39(5): 969-975.
21. La HP (2015) Extraction of individual tree crown using hyperspectral image and LiDAR data. KSCE Journal of Civil Engineering 19(4): 1078-1087.
22. Ota T (2015) Aboveground Biomass Estimation Using Structure from Motion Approach with Aerial Photographs in a Seasonal Tropical Forest. Forests 6(11): 3882-3898.
23. Mohan M (2017) Individual tree detection from unmanned aerial vehicle (UAV) derived canopy height model in an open canopy mixed conifer forest. Forests 8(9): 1-17.
24. Anggoro A, Siregar VP, Agus SB (2017) Klasifikasi Multikskala Untuk Pemetaan Zona Geomorfologi Dan Habitat Bentik Menggunakan Metode Obia Di Pulau Pari (Multiscale Classification For Geomorphic Zone And Benthic Habitats Mapping Using Obia Method In Pari Island). Penginderaan Jauh 14(2): 89-93.
25. Mountrakis G, Im J, Ogole C (2011) ISPRS Journal of Photogrammetry and Remote Sensing Support vector machines in remote sensing : A review. ISPRS Journal of Photogrammetry and Remote Sensing 66(3): 247-259.
26. Zhang C, Xie Z (2013) Object-based Vegetation Mapping in the Kissimmee River Watershed Using HyMap Data and Machine Learning Techniques Object-based Vegetation Mapping in the Kissimmee River Watershed Using HyMap Data and Machine Learning Techniques. Wetlands 33: 233-244.
27. Otero V (2018) Managing mangrove forests from the sky: Forest inventory using field data and Unmanned Aerial Vehicle (UAV) imagery in the Matang Mangrove Forest Reserve, peninsular Malaysia. Forest Ecology and Management 411: 35-45.
28. Necula M (2022) How accurate is the remote sensing based estimate of water physico-chemical parameters in the Danube Delta ( Romania )?. Annals of Forest Research 65(2): 103-118.
- Lessons to Learn: Trees are More than the Lungs of the World
- Community Forestry Enterprises as a Model for Sustainable Forest Development: The Case Of The "Baja Tarahumara" in Chihuahua, Mexico
- Ecological and Socio-Economic Impacts of Chromolaena odorata and Mesosphaerum suaveolens, Two Invasive Alien Species in Central and Southern Benin, West Africa
- Epigenetic Sustainability: Modeling the Human Factor as a Natural Resource through Science 4.0 and the NR3C1 Biological Pilot
- Growth-at-Risk: A Framework for Assessing Economic Vulnerability
- The Rural Territory as a Socioecological System for the Management of Public Policy for Sustainable Rural Development