Assessment of Heavy Metal Pollution in the Surface Sediments of Hadhramout Coast, Yemen
Hadhramout is considered as the industrial and commercial center for fishing in Yemen. Accordingly, Yemen food security depends highly on maritime products of Hadhramout. Consequently, any severe contamination caused by industrial activities would have direct or indirect negative impact on the sea life and marine environment. Sediments samples were collected from Hadhramout Governorate coastal area Yemen at five locations from Augusts of 2013 until May 2014 for an investigation of heavy metals. The study results showed that the concentrations of heavy metals (Ni, Co, Mn, Cd, Fe, Cu, Zn, Cr and Pb) in sediments were in range of4.17-20 μg/g, 2.5-11.67 μg/g, 6.67-27.5 μg/g, 0.1-1.67 μg/g, 27.5-1291.7 μg/g, 3.33-7.5 μg/g, 2-8 μg/g, 2.5-8.33 μg/g and 5.83-17.5 μg/g, respectively. Concentrations of these metals in Sediments of coastal area showed seasonal variations during the study period. In this survey compared to standards, high concentrations of parameters were recorded in the seawater of Burum area, Al-Mukalla area, Al-Shaher, Arryidah area and Ras-Sharma. The present study revealed that the different physicochemical parameters of sediments at the investigated locations and the concentrations of Cu, Zn, Cr and Pb in sediments were below the permissible levels while Ni, Mn, Cd, Fe and Pb except Ras-Sharma were higher than the permissible level by CCME and NOAA.
Nada Mol Aldwila1*, Mohammed Al Wosabi2, Hisham Nagi2 and Nabil Al Shwafi2
Marine Biology, Hadhramout University, Yemen
in Sediments of coastal area showed seasonal variations during the study period.
CCME and NOAA.
ROMPE: Regional organization for the protection of the marine environment; ERL: Effects Range Low.
Introduction
The pollution of the aquatic environment with heavy metals has become a worldwide problem in recent times because they are indestructible and most of them have toxic effects on organisms [1]. Among environmental pollutants, metals are of particular concern, due to their potential toxic effect and ability to bioaccumulation in aquatic ecosystems [2]. The presence of heavy metals in aquatic ecosystems is the result of two main sources of contamination; natural processes or natural occurring deposits and anthropogenic activities. The main sources of heavy metal pollution to life forms are invariably the result of anthropogenic activities [3]. Marine sediments are a major repository of heavy metals in coastal areas [4]. Therefore, sediment analyses play an important role in the quality assessment of the marine environment in so far as metal pollution is concerned. Marine sediments provide useful information for environmental and geochemical research about marine pollution [5]. Therefore, sediments are ecologically important components of the marine environment and have been contaminated by inorganic and organic materials. They are composite minerals consisting of inorganic components, mineral particulates and organic matter in various stages of decomposition [6]. Heavy metal contamination in sediment is a critical factor for evaluating potential environment effects because of the associated bio-toxicity, high environmental stability and high occurrence of bioaccumulation in the food chain. Studies have shown that heavy metal toxicity and accumulation not only depends on metal concentrations but on other factors. These include the form in which the metal component is present, the type and concentration of other materials and the integration of physicochemical parameters, such as temperature, dissolved oxygen (DO), salinity, sediment grain size, pH and organic carbon [7]. The marine environment in the Republic of Yemen coastal area is subjected to contamination by metals from untreated domestic, industrial, and agricultural wastewater, in addition to run-off during rainy periods, ship and boat traffic, oil transportation, oil spillage, and atmospheric fallout [8]. Marine pollution of the Gulf of Aden had recently drawn the attention of national and international agencies as well as public awareness of the enormous increment of pollutants particularly oil and metals. The increase of sewage and industrial effluents discharged in to the Gulf of Aden has seriously endangered the ecosystem. Limited investigation dealing with presence of various pollutants have been carried out in this area [8, 9].
Materials and Methods
Study area
Hadhramout governorate is situated between the latitudes of 14° 30́ and 14
- 56́ N, and longitudes 49
- 07′ and 50° 21˝ E. Its coastline occupies about 750km of the Yemeni coasts. The study area is located in Hadhramout Governorate and includes five sites namely; Burum, Al Mukalla, Al-Sheher, Arryidah and Ras- Sharma. Hadhramout coast Figure 1, complementary considered as part of the Gulf of Aden, occupies nearly one-third of the south Yemeni coast length with an estimated area of the continental shelf of about 70,000 km2 (up to a depth 200 m). As estimated, the Hadhramout coast a productive area (EEZ) is about 13500 km2 (approximately 20%). The coastal strip of the province of Hadhramout consists of a series of sandy beaches punctuated at intervals by configurations of rock protruding and mostly extends into the shallow water. The slope of sea bottom here abrupt, in terms of distance between the beach and the continental shelf, relatively narrow with an average of 15 kilometers, except in the northeast of the coast where it can be up to 60 km in width. The depth of the Gulf in the coast of Hadhramout as average about 1750 meters in the midst of the Gulf with higher depth up to 5370 meters. There are some sandy beaches with a backgrounds consisting of rocky heights, such as the shores of east Bir Ali, east Maifa Hajar, behinds Mukalla and Sharma. The coastline consists of successive environments which are almost identical to a significant degree, such as sandy beaches, narrow coastal plains, rocky heights, sand dunes, proximity to the beach bottoms with a shallow rocky-sandy foundations and deep rocky bottoms. Along the coast there are many areas of environmental concern, such as 1) the coast of Bir Ali and its islands and coral formations with elevated bioenergy; 2) the coast of Broom distinguished by transition from a moderate high bioenergy for the Ras-El-Kalp coast to the high energy that extends along the east Broom area and 3) Halla and behind of Mukalla areas. Hadhramout coast is also characterized by wide sandy basses, which can prolongs the dry sandy beaches to a depth of over 100 meters; but it is often limited between the tide curve and the depth of 30 meters.
Nada Mol Aldwila, et al. Assessment of Heavy Metal Pollution in the Surface Sediments of Hadhramout Coast, Yemen. Adv Clin Toxicol 2018, 3(1): 000123.
inter seasonal periods are represented as for seasonal monsoons, (summer and winter), August 2013 is representative of the summit of summer monsoons. November 2013 represented the period between summer and winter monsoons, February 2014 represented the winter monsoons and May 2014 represents a post-winter monsoon and prior to summer monsoon. Twenty surface sediment samples were collected from the five sampling sites at Hadhramout coastal representing western border - Burum (3-4m depth), and eastern - Arryidah (1-2m depth) and what between them representative of the Al-Mukalla (2-3m depth), Al-Shaher (2-3m depth) and Ras-Sharma (1-2m depth), and transported in labeled plastic bags. Surface sediments were protected from contamination effect by keeping glass wares sealed in the containers (Ice freezer) and immediately transported to the laboratory and stored in frozen until processing, and minimizing the time of atmospheric contact. Sediments samples were analyzed according to the method described by ROMPE [10]. Original sediments samples were spilt and washed to remove the dissolved salts using the distilled water (DW).This step was repeated several times to ensure the complete removal of dissolved salts. Following this step, surface sediments were dried in an oven at 40 C for 12 hours, homogenized in an agate mortar, and stored in polyethylene containers at a room temperature for subsequent analysis. Gloves were used in all handling stages to avoid contamination. From the homogenized dry fine powder sediments, 3 grams of each sample, placed in a beaker, were mixed with and 1.5 ml of concentrated perchloric acid and 4.5 ml of concentrated nitric acid were added for a predigestion overnight. Each beaker was placed in a water bath set at 70 C for 2 hours until the solution in clear. About 2-3 ml deionized water were added to samples. On a hot plate at 70 C, the solutions were reduced to 1-2 ml and adjusted to final volume of 50ml. All sediments samples were analyzed by AAS for the concentrations in (Cd, Mn, Ni, Zn, Pb, Co, Fe, Cr and Cu).
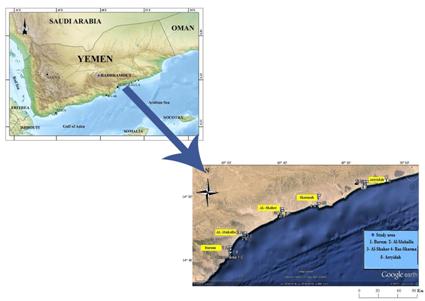
Figure 1: Map of the Hadhramout governorate, showing study area location. Sampling and Analysis Different indicators samples for this study were taken from five locations that have been selected along the Hadhramout coast. These, locations include western border - east Burum and eastern Arryidah - region and the area between them, which is representative of the cape of - Mukalla, Sheher and Ras-Sharma. In order to ensure the inclusion of the largest area of the region, location consists of three sub-stations. The sites location is shown in Table 1. The study area extends from Burum area in the west (14º 35’ N and 48° 59́ 537″E) to Arryidah in the east (14º 89’ N and 49º15’ E) in addition to Ras Sharma as background (protect area). In general, these coasts are irregular in form, but dominated by sandy bays of varying size separated by promontories of limestone or igneous rocks sometimes of substantial height such as Burum area and Al-Mukalla. Sample sediments locations were recorded by Digital GPS Navigator (Model: KGP-913). Samples were collected from the Hadhramout Governorate/Yemen from August 2013 to May 2014 once a month. Over this interval, the
| Location | Station | Latitudes | Longitudes | ||||||||
|---|---|---|---|---|---|---|---|---|---|---|---|
| Ras Sharmah | 1 | 14◦ 49΄ 356˝ N | 50◦ 01΄ 996˝ E | ||||||||
| 2 | 14◦ 49΄ 289˝ N | 50◦ 02΄ 163˝ E | |||||||||
| 3 | 14◦ 49΄ 316˝ N | 50◦ 02΄ 358˝ E | |||||||||
| Burum | 4 | 14◦ 20΄985˝ N | 48◦ 59΄ 023˝ E | ||||||||
| 5 | 14◦ 20΄ 954˝ N | 48◦ 59΄ 135˝ E | |||||||||
| 6 | 14◦ 20΄ 928˝ N | 48◦ 59΄ 238˝ E | |||||||||
| AL-Mukalla | 7 | 14◦ º31 198˝ N | 49◦ 09΄ 986˝ E | ||||||||
| 8 | 14◦ 30΄ 999˝ N | 49◦ º10΄ 145˝ E |
Table 1: Locations of seawater sampling in the study Area
Nada Mol Aldwila, et al. Assessment of Heavy Metal Pollution in the Surface Sediments of Hadhramout Coast, Yemen. Adv Clin Toxicol 2018, 3(1): 000123.
| 9 | 14◦ º30 ΄ 720˝ N | 49◦ 09΄ 615˝ E | |
|---|---|---|---|
| AL-Shaher | 10 | 14◦ 44΄ 960˝ N | 49◦ 35΄ 877˝ E |
| 11 | 14◦ 44΄ 994˝ N | 49◦ 35΄ 983˝ E | |
| 12 | ˝14◦ 44΄ 931˝ N | 49◦ 35΄ 779˝ E | |
| Arryidah | 13 | 15◦ 02΄ 735˝ N | 50◦ 33΄ 397˝ E |
| 14 | 15◦ 02΄ 714˝ N | 50◦ 33΄ 612˝ E | |
| 15 | ˝15◦ 02΄ 689˝ N | 50◦ 33΄ 827˝ E |
Table 2: Locations of seawater sampling in the study Area
materials. They are composite minerals consisting of inorganic components, mineral particulates and organic matter in various stages of decomposition [6]. Marine sediments are a major repository of heavy metals in coastal areas [4]. Therefore, sediment analyses play an important role in the quality assessment of the marine environment in so far as metal pollution is concerned. Heavy metals may enter the sediments from different sources including in sewage, industry, agriculture domestic effluent and urban runoff. Heavy metals (Ni, Co, Mn, Fe, Cd, Cu, Zn and Pb) are common pollutants, which are widely distributed in aquatic environment. The concentrations of the selected metals are listed in (Tables 2-5).
Results and Discussion
Total metals in surface sediments
Assessment of aquatic pollution depend on physico- chemical monitoring to identify and quantify toxicants and to provide data for regulatory purposes, and to compare to allowable concentration for particular recipient water [11]. The concept that water quality criteria are the basis for any kind of water pollution control policy is certainly valid [12]. Marine sediments provide useful information for environmental and geochemical research about marine pollution [13, 5]. Therefore, sediments are ecologically important components of the marine environment and have can be been contaminated by inorganic and organic
| Location stations | Ni | Co | Mn | Cd | Fe | Cu | Zn | Cr | Pb | |||||||||||||||||||
| Ras sharma | 10.00 | 6.67 | 13.33 | >0.10 | 66.67 | 2.5 | 3.33 | 2.50 | 10.83 | |||||||||||||||||||
| Burum | 13.33 | 9.17 | 19.17 | 1.67 | 1266.6 | 6.677 | 6.677 | 4.17 | 15.00 | |||||||||||||||||||
| AL-Mukalla | 15.83 | 10.00 | 19.17 | 1.67 | 100.00 | 7.5 | 8.00 | 4.167 | 17.5 | |||||||||||||||||||
| AL-Shaher | 12.5 | 9.17 | 16.67 | 1.67 | 391.67 | 3.33 | 4.92 | 3.33 | 13.33 | |||||||||||||||||||
| Arryidah | 12.5 | 8.33 | 14.17 | 0.83 | 83.333 | 4.17 | 5.00 | 3.33 | 15.00 | |||||||||||||||||||
| Minimum | 10.00 | 6.67 | 13.33 | >0.10 | 66.67 | 2.5 | 3.33 | 2.50 | 10.83 | |||||||||||||||||||
| Maximum | 15.83 | 10.00 | 19.17 | 1.67 | 1266.7 | 7.5 | 8.00 | 4.17 | 17.50 | |||||||||||||||||||
| Average | 12.86 | 8.57 | 16.43 | 1.39 | 463.1 | 4.88 | 5.61 | 3.45 | 14.28 |
| Location stations | Ni | Co | Mn | Cd | Fe | Cu | Zn | Cr | Pb | |||||||||||||||||||
| Ras sharma | 11.67 | 7.50 | 17.5 | >0.10 | 26.67 | 3.33 | 3.50 | 3.33 | 10.83 | |||||||||||||||||||
| Burum | 14.17 | 9.17 | 27.50 | 1.67 | 175.00 | 5.00 | 7.92 | 8.33 | 14.17 | |||||||||||||||||||
| AL-Mukalla | 20.00 | 10.00 | 24.17 | 1.67 | 216.67 | 6.67 | 7.08 | 5.00 | 16.67 | |||||||||||||||||||
| AL-Shaher | 20.00 | 7.50 | 25.83 | 0.83 | 43.33 | 3.33 | 4.67 | 3.33 | 13.33 | |||||||||||||||||||
| Arryidah | 15.83 | 7.50 | 24.50 | >0.10 | 27.5 | 5.00 | 4.42 | 3.33 | 14.12 | |||||||||||||||||||
| Minimum | 11.67 | 7.50 | 17.50 | >0.10 | 26.67 | 3.33 | 3.50 | 3.33 | 10.83 | |||||||||||||||||||
| Maximum | 20.00 | 10.00 | 27.50 | 1.67 | 216.67 | 6.67 | 7.92 | 8.33 | 16.67 | |||||||||||||||||||
| Average | 16.19 | 8.45 | 23.50 | 1.33 | 104.64 | 4.76 | 5.57 | 4.99 | 13.80 |
Nada Mol Aldwila, et al. Assessment of Heavy Metal Pollution in the Surface Sediments of Hadhramout Coast, Yemen. Adv Clin Toxicol 2018, 3(1): 000123.
| Location stations | Ni | Co | Mn | Cd | Fe | Cu | Zn | Cr | Pb | |||||||||||||||||
| Ras sharma | 1.67 | 2.50 | 3.33 | >0.10 | 9.17 | 1.67 | 1.00 | 2.50 | 3.33 | |||||||||||||||||
| Burum | 10.00 | 6.67 | 8.33 | 1.67 | 233.33 | 4.17 | 5.67 | 8.33 | 9.17 | |||||||||||||||||
| AL-Mukalla | 6.67 | 7.50 | 19.17 | 1.67 | 183.33 | 6.67 | 6.17 | 6.67 | 15.83 | |||||||||||||||||
| AL-Shaher | 10.00 | 5.00 | 18.33 | 0.83 | 125.00 | 5.00 | 6.08 | 3.67 | 5.83 | |||||||||||||||||
| Arryidah | 4.17 | 2.50 | 6.67 | >0.10 | 85.00 | 3.33 | 2.00 | 3.30 | 10.83 | |||||||||||||||||
| Minimum | 1.67 | 2.50 | 3.33 | >0.10 | 9.17 | 1.67 | 1.00 | 2.50 | 3.33 | |||||||||||||||||
| Maximum | 10.00 | 7.50 | 19.17 | 1.67 | 233.33 | 6.67 | 6.17 | 8.33 | 15.83 | |||||||||||||||||
| Average | 6.31 | 4.88 | 11.19 | 1.33 | 125.48 | 4.17 | 4.01 | 4.33 | 9.16 |
| Location stations | Ni | Co | Mn | Cd | Fe | Cu | Zn | Cr | Pb | |||||||||||||||||
| Ras sharma | 10.00 | 7.50 | 12.5 | >0.10 | 158.33 | 4.17 | 2.75 | 4.17 | 10.83 | |||||||||||||||||
| Burum | 12.50 | 10.00 | 24.16 | 1.67 | 625.00 | 5.00 | 8.00 | 9.17 | 13.33 | |||||||||||||||||
| AL-Mukalla | 13.33 | 11.67 | 25.83 | 1.67 | 1291.6 | 5.83 | 7.08 | 7.5 | 17.5 | |||||||||||||||||
| AL-Shaher | 11.67 | 10.83 | 20.83 | 1.67 | 800.00 | 3.33 | 5.83 | 6.67 | 15.00 | |||||||||||||||||
| Arryidah | 11.67 | 10.00 | 18.33 | 0.83 | 375.00 | 3.33 | 4.17 | 5.83 | 12.00 | |||||||||||||||||
| Minimum | 10.00 | 7.50 | 12.5 | >0.10 | 158.33 | 3.33 | 2.75 | 4.17 | 10.83 | |||||||||||||||||
| Maximum | 13.33 | 11.67 | 25.83 | 1.67 | 1291.6 | 5.83 | 8.00 | 9.17 | 17.5 | |||||||||||||||||
| Average | 11.79 | 9.88 | 19.99 | 1.39 | 671.41 | 4.40 | 5.51 | 6.67 | 13.86 |
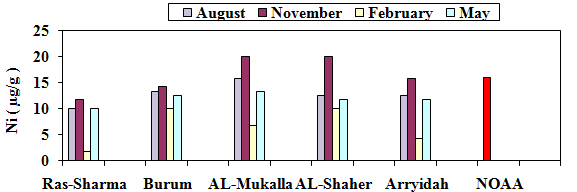
discharge of industrial effluents and domestic sewage in these two cities. The petroleum related activities also a source of nickel can contaminate the environment. The concentration of Ni in sediments at AL-Mukalla and Al- Shaher during November was higher than the permissible levels (15.9µg/g) recommended by NOAA (2009) (Figure 2).
the minimum concentration 2.5 µg/g at Ras-Sharma. The high cobalt concentrations were recorded at sediments of Al-Mukalla because of direct discharge of untreated Nada Mol Aldwila, et al. Assessment of Heavy Metal Pollution in the Surface Sediments of Hadhramout Coast, Yemen. Adv Clin Toxicol 2018, 3(1): 000123.
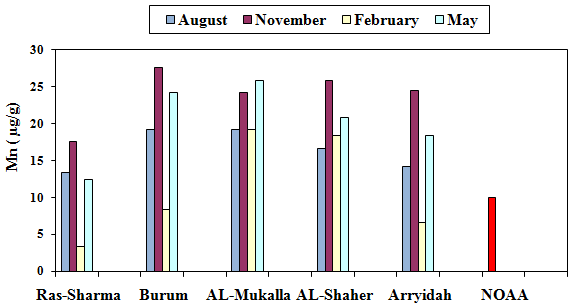
domestic wastes and insufficiently treated industrial wastes. In present study, the concentration of Cobalt in sediments was higher than the results of another study of Abu-Hilal and de Mora, et al., Moreover, the similar finding was observed by Al-Kahali , Jonathan, et al., Al- Alimi & Al-Habashi .The concentration of Co n in present study was lower than its concentration in sediments of the Gulf of Aden in Yemen was observed by Szefer Kasem, et al. Manganese: Manganese (Mn) concentrations in sediments varied between 3.33µg/g to 27.50µg/g. The maximum value was recorded at Burum during November and the minimum was observed in sediments of Ras-Sharma during the study period. Manganese showed high levels in sediments of Burum that are most likely related to the microbial degradation of organic materials leading to a rapid removal of metal adsorbed to the surfaces of clays and detritus particles and/or geological nature of the sediments. The concentration of Mn at Burum, Arryidah and Ras-Sharma lies within the permissive limit (10µg/g) as stated by NOAA (2009) (Figure 3).
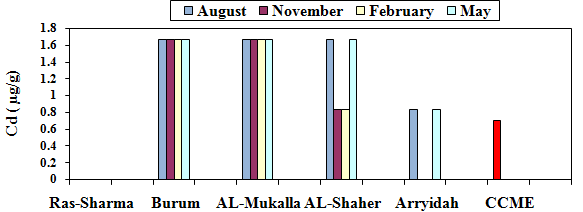
However the lowest concentration in Ras-Sharma, this may be attributed to the removing of this metal by many ways such as adsorption on particulate matter, precipitation or removed by marine organisms. Cd concentrations observed in the present study were higher than the recommended limit of 0.7 µg/g for Cd in sediment except for Arridah during November and February and Ras-Sharma (Figure 4) [14].
Nada Mol Aldwila, et al. Assessment of Heavy Metal Pollution in the Surface Sediments of Hadhramout Coast, Yemen. Adv Clin Toxicol 2018, 3(1): 000123.
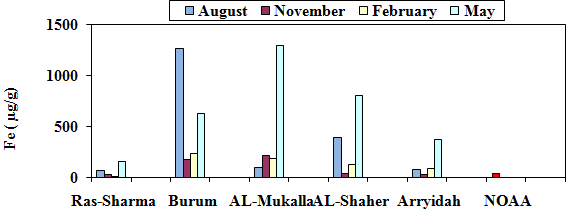
Iron: The present study indicated that the concentration of Fe in sediments collected from the study area ranged between 9.17-1291.7 µg/g with maximum at AL-Mukalla during May and a minimum in Ras-Sharma during November. The highest concentration of iron was detected in sediment of Al-Mukalla in May. Iron is essential in marine sediments and constitutes a source of minerals for different flora and fauna marine species.
Although it is highly difficult to distinguish between anthropogenic and natural source, concentration increases between seasons are an important element for analysis. Concentrations of iron observed during this study area higher than the NOAA (2009) (35.3 µg/g) except for Ras-Sharma which is characterized by low concentrations (Figure 5).
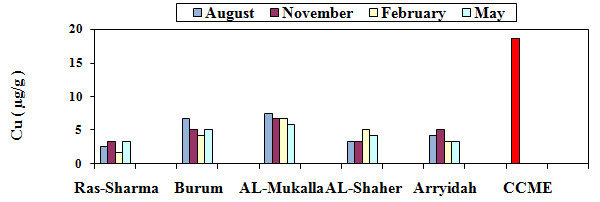
and Sharma related high copper and other elements concentrations in the sediments at the “Sonda de Campeche” in Mexico to the combustion of gasoline and exploration, hydrocarbon production and shipping in the area. In this sense, the studies of Turner, confirm that the geosolids derived from fine particles in paint used for boat maintenance increase the concentration of heavy metals such as copper in sediments and surrounding areas [17, 18]. Copper concentrations in the present study did not exceed the CCME recommended limit of 18.7µg/g (CCME 2001) (Figure 6).
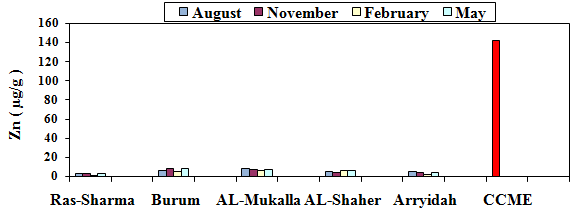
recorded in AL-Mukalla and Burum during August and the lowest values were Ras-Sharma during February. The Nada Mol Aldwila, et al. Assessment of Heavy Metal Pollution in the Surface Sediments of Hadhramout Coast, Yemen. Adv Clin Toxicol 2018, 3(1): 000123.
highest concentration of zinc was observed in sediments of Al-Mukalla and Burum in August and May. Which suggests that Zn is derived from anthropogenic source? It can be from direct input of effluents from industries and communities dumping of wastes from ships and through atmospheric fallout. The Zn concentration observed in the present study is lower than the recommended limit of 142µg/g for Zn in sediments (CCME, 2001) (Figure 7).
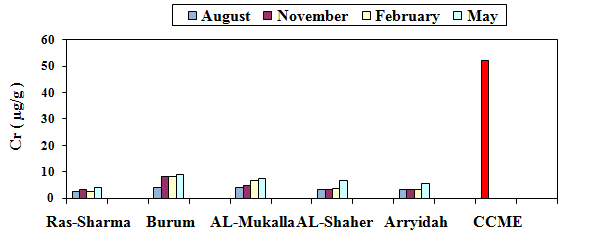
concentrations of Chromium were observed in sediments collected nearby wastewater outlet especially near the Burum. The Cr concentration measured in the present study is lower than the recommended limit of 52.3µg/gfor Cr in sediments (CCME, 2001) (Figure 8).
The highest concentration of lead was detected in sediments of Al-Mukalla and could be attributed to the industrial and agricultural discharge as well as from spill of leaded petrol from fishing boats. Dust which holds a huge amount of lead from the combustion of petrol in automobile cars can increase Pb content in sediments [19]. The Pb concentrations observed in this study were lower than the recommended limit of 30.2µg/g for Pb in sediment (Figure 9).
Nada Mol Aldwila, et al. Assessment of Heavy Metal Pollution in the Surface Sediments of Hadhramout Coast, Yemen. Adv Clin Toxicol 2018, 3(1): 000123.
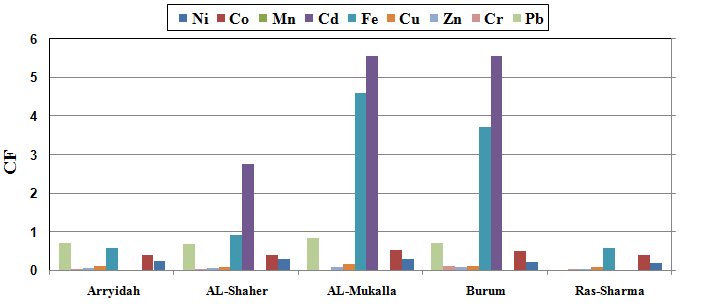
![Figure 9: Lead concentration in sediments samples compared with international standard recorded during the study period. Assessment of Metal Contamination The assessment of contamination in different aquatic environments is possible by analysis of water , sediment and indigenous biota [20,21]. Bioaccumulation studies led to the adoption of the bio-indicator concept. Monitoring networks have been developed in order to evaluate the marine environment quality. In the present study, four approaches were employed to evaluate sediment contamination with metals, (1) contamination Factor, (2) Degree of contamination, (3) Sediment Quality guidelines **Contamination Factor (CF)** To calculate the variations in trace element amount in sediments, we calculated the contamination Factor (CF). The CF is the ratio between the concentrations of each metal in sediments to their concentration in the backgrounds follows:](/fulltextimages/1578/fig_9.png)
Figure 9: Lead concentration in sediments samples compared with international standard recorded during the study period. Assessment of Metal Contamination The assessment of contamination in different aquatic environments is possible by analysis of water , sediment and indigenous biota [20, 21]. Bioaccumulation studies led to the adoption of the bio-indicator concept. Monitoring networks have been developed in order to evaluate the marine environment quality. In the present study, four approaches were employed to evaluate sediment contamination with metals, (1) contamination Factor, (2) Degree of contamination, (3) Sediment Quality guidelines Contamination Factor (CF) To calculate the variations in trace element amount in sediments, we calculated the contamination Factor (CF). The CF is the ratio between the concentrations of each metal in sediments to their concentration in the backgrounds follows:
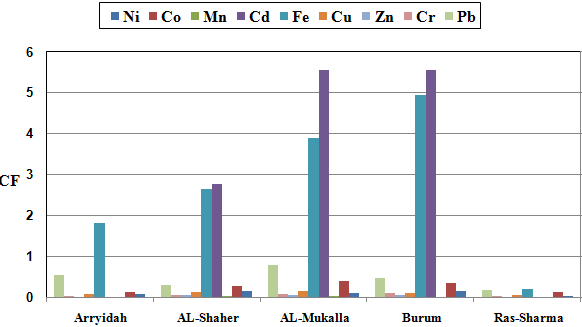
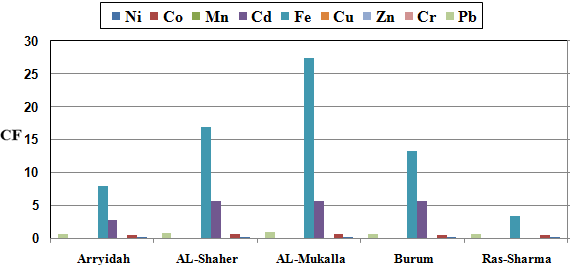
According to (Pekey et al; 2004) the contamination factor was classified into four groups: CF≤ 1 refers to the low (CF); 1≤ CF > 3 refers to moderate (CF); 3≤ CF > 6 refers to considerable (CF) and CF ≥ 6 refers to high (CF). The contamination Factor (CF) of surface sediments of Hadhramout coastal area, are given in the (Figures 10- 13). Sediments of Burum, AL-Mukalla and AL-Sheher in May have the highest CF (about) for Fe, whereas the contamination factor of Cd in sediments of the most samples at different locations can be classified as considerable to moderate. The contamination factor for Ni, Co, Mn, Cu, Cr, Zn and Pb in sediments of all locations are low. Generally, average CF values of metals in sediments of Hadhramout coastal area are low to moderate which is in accordance with the results of Al- Alimi and Al-Habashi.
Nada Mol Aldwila, et al. Assessment of Heavy Metal Pollution in the Surface Sediments of Hadhramout Coast, Yemen. Adv Clin Toxicol 2018, 3(1): 000123.
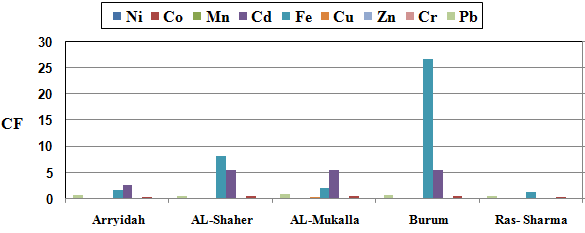
Figure11: Contamination Factors (CF) of surfaces sediments collected during November.
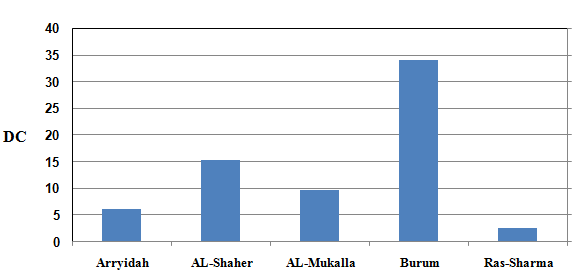
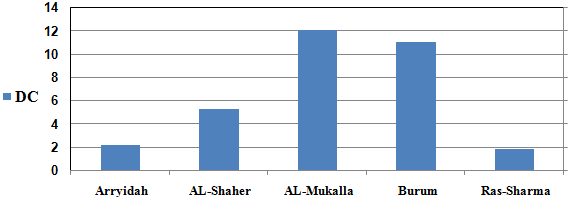
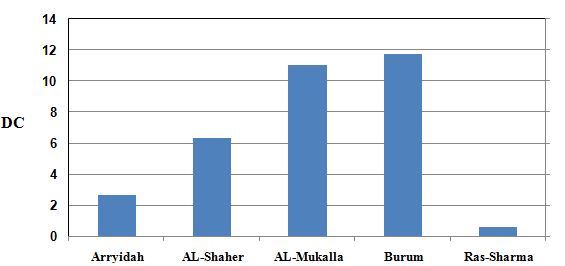
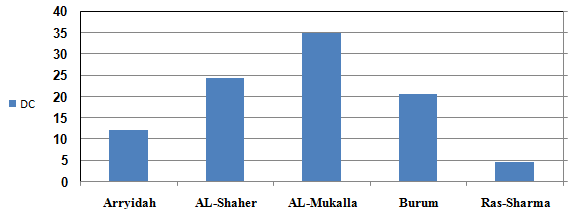
DC= Ʃ CFn n= number of metals For the evaluation of the degree of contamination, the following terminologies have been used: low for DC > 7;
moderate for 7≤ DC> 14; considerable for 14≤ DC> 28 and very high for DC≥ 28. The degrees of contamination of metals in sediments collected during this study are shown in Figures 14-17.
Nada Mol Aldwila, et al. Assessment of Heavy Metal Pollution in the Surface Sediments of Hadhramout Coast, Yemen. Adv Clin Toxicol 2018, 3(1): 000123.
The DC values indicated that the sediments of the most locations are low to moderate, whereas it they are considerable to high in sediments of Burum, Al-Mukalla and Al-Shaher especially in Augusts and May.
Nada Mol Aldwila, et al. Assessment of Heavy Metal Pollution in the Surface Sediments of Hadhramout Coast, Yemen. Adv Clin Toxicol 2018, 3(1): 000123.
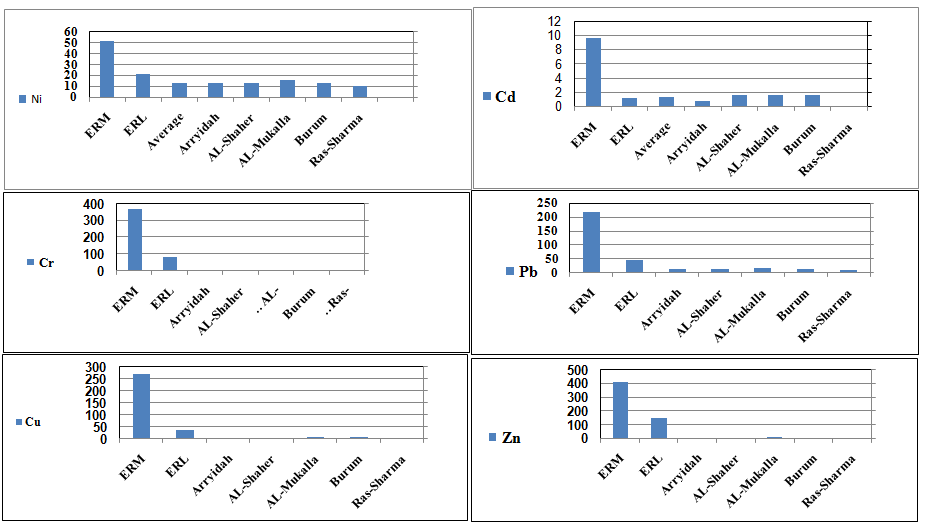
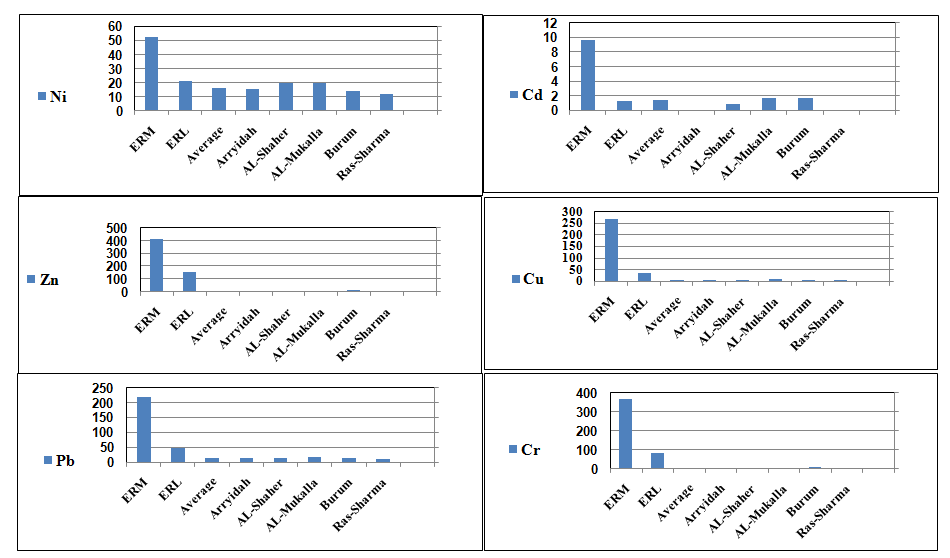
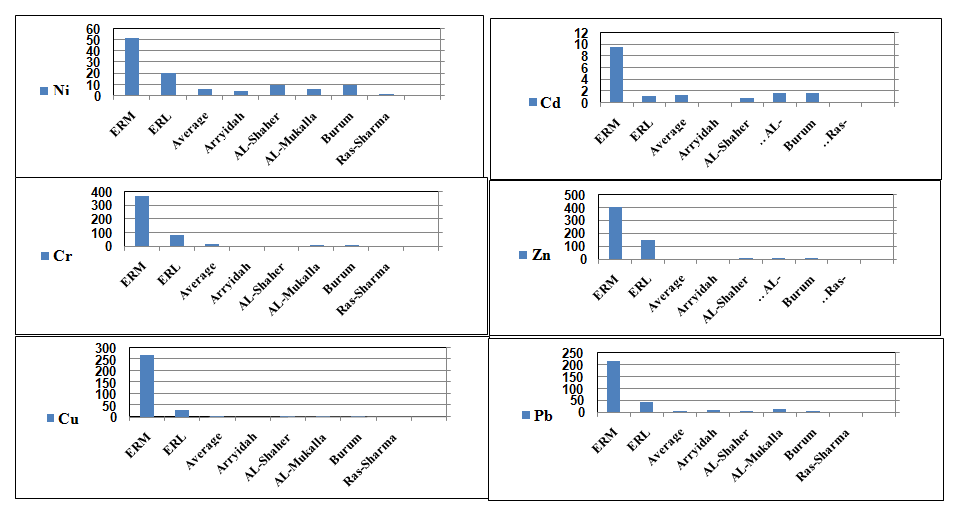
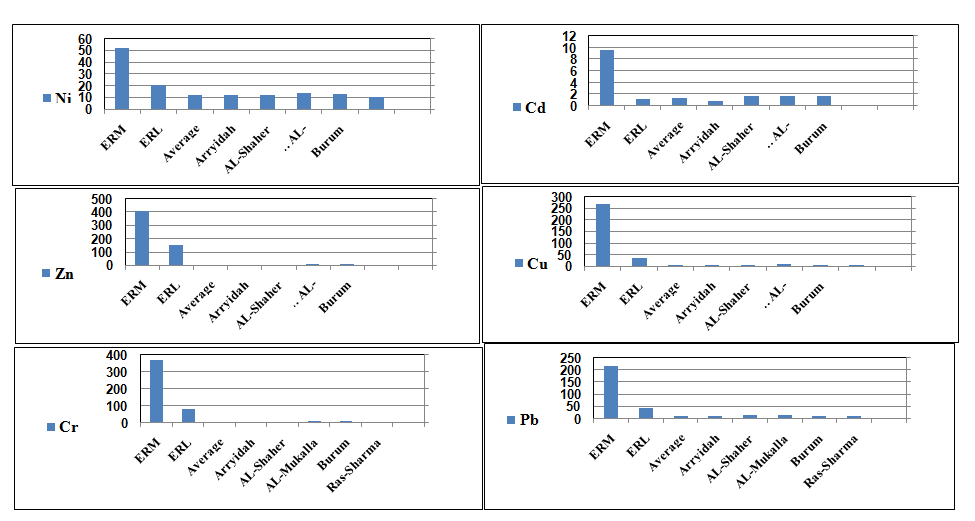
Sediment Quality Guidelines (SQG) Sediment quality guidelines (SQG) derived using these approaches are premised upon the assumption that relationships between sediment chemistry and effect will emerge during analysis of large data seat compiled from many different locations. Such SQGs do not account for factors controlling bioavailability and are expressed on a dry weight- normalized basis. Long et al. conducted an extensive review of articles that provide both concentrations of contaminants in sediments and observed in biological effects. They therefore derive consensus values considering data for all of the reviewed studies. According to previous studies, concentrations of metals in sediment can cause biological effects, and judge valid when degrees are from low to high. A 10th and 50th percentiles were then determined. Metals which typically occur at higher than normal concentrations in anthropogenic effluents include: Cu, Zn, Pb, Co and Fe. At low concentrations some of these are essential for living organisms (e.g. Cu, Fe) but at high concentrations they may be toxic, whereas, others are not essential for metabolic activity (e.g. Pb, Hg) and are toxic to cells even at quite low concentrations [25, 26, 27]. The concentrations of metals in sediments at each location were compared to sediment quality guideline values referred to as the effects range- low (ERL) and effects range-median (ERM) (Figures 14-21) indicates that concentrations below the ERL value are rarely associated with biological effects. Concentrations equal/ or above the ERL, but below the ERM, indicate a possible range in which effects would occasionally occur. The concentrations equivalent to and above ERM value indicate that the effects would occur frequently. At seen in Figures 18-21 with the exception of Cd in sediments of Burum, AL-Mukalla and AL-Shaher, none of metal concentration in the surface sediments of studied area is above ERL value. Whereas, the other metals were below established limits ERL for biological effects.
Nada Mol Aldwila, et al. Assessment of Heavy Metal Pollution in the Surface Sediments of Hadhramout Coast, Yemen. Adv Clin Toxicol 2018, 3(1): 000123.
Nada Mol Aldwila, et al. Assessment of Heavy Metal Pollution in the Surface Sediments of Hadhramout Coast, Yemen. Adv Clin Toxicol 2018, 3(1): 000123.
References
-
Macfarlane GB, Burchett MD (2000) Cellular distribution of Cu, Pb and Zn in the Grey Mangroove Avicemmia marina (Forsk). Vierh Aquatic Botanic 68(1): 45-49.
-
Censi P, Spoto SE, Saiano F, Sprovieri M, Mazzola S, et al. (2006) Heavy metals in coastal water system. A case study from the north western Gulf of Thailand. Chemosphere 64(7): 1167-1176.
-
Ekeanyanwu CR, Ogbuinyi CA, Etienajirhevwe OF (2010) Trace Metals Distribution in Fish Tissues, Bottom Sediments and Water from Okumeshi River in Delta State, Nigeria. Ethiopian Journal of Environmental Studies and Management 3(3).
-
Kim KT, Ra K, Kim ES, Yim UH, Kim JK (2011) Distribution of Heavy Metals in the Surface Sediments of the Han River and its Estuary, Korea. Journal of Coastal Research 64: 903-907.
-
Uluturhan E (2010) Heavy metal concentrations in surface sediments from two regions (Saros and Gökova Gulfs) of the Eastern Aegean Sea. Environ Monit Assess 165(1-4): 675-684.
-
Küçüksezgin F, Kontaş A, Altay O, Uluturhan E, Darılmaz E (2006) Assessment of marine pollution in Izmir Bay: Nutrient heavy metal and total hydrocarbon concentrations. Environment International 32(1): 41-51.
-
Sany SB, Salleh A, Rezayi M, Narimany L (2013) Distribution and Contamination of Heavy Metal in the Coastal Sediments of Port Klang, Selangor, Malaysia. Water air and soil pollution 224(4): 1476
-
Heba H, Al-Mudaffer N (2000) Trace metal in fish, muscles, shrimp and sediment from red sea coast of Yemen. Bulletin of Institute of Oceanography and Fisheries 26: 339-353.
-
Heba HM, Maheub ARS, Nabeel AA, Al-Saad T (2003) Petroleum hydrocarbons and trace metals in mollusca Tivela ponderosa from the Gulf of Aden, Journal of King Adel Aziz University Marine Science 14: 77-85.
-
ROPME (Regional organization for the protection of the marine environment) (1983) Manual of oceanography observation and pollutant analysis method. Kuwait P 45.
-
Mansour SA, Sidky MM (2002) Eco-toxicological studies. Heavy metals contaminating water and fish Nada Mol Aldwila, et al. Assessment of Heavy Metal Pollution in the Surface Sediments of Hadhramout Coast, Yemen. Adv Clin Toxicol 2018, 3(1): 000123. from Fayoum Governorate. Egypt J Food Chemis 78(1): 15-22.
-
FAO (1987) Committee for Inland Fisheries of Africa , Report of first session of the working party on pollution and Fisheries, Accra, Ghana,16-20 June(1986). FAO Fisheries Report 369: 23-36.
-
Saeedi M, Karbassi AR (2006) Heavy Metals Pollution and Speciation in Sediments of Southern Part of the Caspian Sea. Pakistan Journal of Biological Sciences 9(4): 735-740.
-
CCME (Canadian Council of Ministers of the Environment) (2001) Canadian sediment quality guidelines for the protection of aquatic life.
-
González MC, Méndez L, López D, Botello A (2006) Evaluación de la contaminación en sedimentos Del área portuaria y zona costera de Salina Cruz, Oaxaca, México. Interciencia 31(9): 647-656.
-
Zeng H, Wu J (2013) Heavy metal pollution of lakes along the mid-lower reaches of the Yangtze River in China: intensity, sources and spatial patterns. Int J Environ Res Public Health 10(3): 793-807.
-
Vázquez FG, Sharma VK (2004) Major and trace elements in sediments of the Campeche Sound, Southeast Gulf of Mexico. Marine Pollution Bulletin 48(1-2): 87-90.
-
Turner A (2013) Metal contamination of soils, sediments and dusts in the vicinity of marine leisure boat maintenance facilities. Journal of Soils & Sediments 13(6): 1052-1056.
-
Hardman DJ, Mceldowney S, Watte S (1993) Pollution, ecology and biotreatment.
-
Manfra L, Accornero A (2005) Trace metal concentrations in coastal marine waters of the central Mediterranean. Marine Pollution Bulletin 50: 686- 692.
-
Acevedo-Figueroa D, Jiménez BD, Rodriguez-Sierra CJ (2006) Trace Metals in sediments of two estuarine lagoons from Puerto Rico. Environmental Pollution 141(2): 36-342.
-
Lafabrie C, Pergent G, Kantin R, Pergent-Martini C, Gonzalez J L (2007) Trace metals assessment in water, sediment and mussel and seagrass species - Validation of the use of Posidonia oceanica as a metal biomonitor. Chemosphere 68(11): 2033-2039.
-
Goldberg ED, Bertine KK (2000) Beyond the mussel watch-new directions for monitoring marine pollution. Sci Total Environ 247(2-3): 165-174.
-
Ferrat L, Pergent-Martini C, Roméo M (2003) Assessment of the use of biomarkers in aquatic plants for the evaluation of environmental quality: Application to sea grasses. Aquat Toxicol 65(2): 187- 204.
-
Heba H, Maheub A, Al-Shawafi N (2000) Oil pollution in Gulf of Aden/ Arabian Sea Coasts of Yemen. Bulletin National Institute Oceanography and Fisheries Egypt 26: 271-282.
-
Luoma SN (1989) Can we determine the biological availability of sediment- bound trace elements? Hydrobiologia 176(1): 379-396.
-
NOAA (National Oceanic and Atomspheric Administration) (2009) SQUIRT, Screening QUICK Reference Tables in sediment. Nada Mol Aldwila, et al. Assessment of Heavy Metal Pollution in the Surface Sediments of Hadhramout Coast, Yemen. Adv Clin Toxicol 2018, 3(1): 000123.
- Pattern of Gonadal Hormones in Oral Testosterone-Supplimented Male Wistar Rats with Diabetes-Induced Hypogonadism
- Re-Evaluation of the Genotoxicity of Currently Used Food Dyes in Mouse Multiple Organs Via Continuous Administration by Drinking Using the Comet Assay
- Pharmacogenetics of Type 2 Diabetes Mellitus: Linking Genetic Variability to Drug Efficacy and its Cardiovascular Outcomes
- Exploratory Proteomic Profiling of SARS-CoV-2 Infected THP-1 Macrophages Reveals Alterations in Inflammatory Response and Cellular Metabolism
- Study of Genotoxicity of Hepatocarcinogens in Multiple Organs in Mice by Feeding and Drinking Using the Comet Assay
- Spirulina Polypeptides Inhibit the Growth of Human Lung Tumor (H460) Cells