THP-1-Derived Dendritic Cells: A Rapid and Reproducible In Vitro Model for Phagocytosis Assays Involving Tumor Cells
Dendritic cells (DCs) play a vital role in antigen-specific adaptive immunity by serving as sentinels, recognizing and presenting specific pathogenic peptides. Herein, we developed a novel approach for obtaining immature DCs from THP-1 cells. We observed that THP-1-derived DCs express the classical markers CD11c and CD-209 and that their morphology is comparable with that of DCs. Furthermore, THP-1-derived DCs responded to lipopolysaccharides, as demonstrated by the high expression of the costimulatory molecules CD80, CD86, and CD83. Morphological changes were characterized by longer dendrites, and the inflammatory cytokines IL-6, TNF-α, IL-1β, MIP-1α, MIP-1β, and VEGF were released. Moreover, in THP-1-derived DCs, the transcription factors NF-ƙB, STAT1, MYD88, and MDA5 were upregulated. Lastly, these cells removed tumor cell-derived apoptotic bodies via phagocytosis. In summary, we presented a powerful, rapid, and reproducible method to generate THP-1- derived functional DCs, reinforcing THP-1 as a model for in vitro studies and an alternative strategy for using Mo-DCs.
Abbreviations
DCs: Dendritic Cells; ICD: Immunogenic Cell Death; PBMCs: Peripheral Blood Mononuclear Cells; GM-CSF: Granulocyte–Macrophage Colony-Stimulating Factor; LPS: Lipopolysaccharide Stimulation; PAMPs: Pathogen- Associated Molecular Patterns; TLR4: Toll Like Receptor 4; MHC: Major Histocompatibility Complex; FBS: Fetal Bovine Serum.
Introduction
As the most potent antigen-presenting cells in organisms, dendritic cells (DCs) not only promote the interface between innate and adaptive immune responses Banchereau J, et al. [1, 2] but also play a vital role as “sentinels” of the immune system, protecting the host against pathogens [3, 4, 5, 6]. Owing to their critical functions, DCs have substantially impacted several areas of therapeutic research, including cancer immunotherapy Anguille S, et al. [7, 8, 9, 10, 11, 12, 13], such as DC-based cancer vaccine Fu C, et al. [14, 15], nanomedicine and DCs in cancer immunotherapy [16, 17]. Discoveries have been made elucidating the relationship between immunogenic cell death (ICD) and activation of DCs Janssens S, et al. [18], leading to development of anti-tumor drugs that can induce ICD through activation of DCs [19, 20, 21, 22, 23]. Despite their importance in the immune system, the density of these cells is low in the bloodstream Liu K [24], as a result, it is difficult to obtain them for research purposes. However, Sallusto and Lanzavecchia Sallusto F, et al. [5] described a protocol for obtaining DCs from monocytes in peripheral blood mononuclear cells (PBMCs) using the cytokines interleukin 4 (IL-4) and granulocyte–macrophage colony-stimulating factor (GM-CSF) to generate myeloid monocyte-DCs (Mo- DCs) in vitro, making considerable advances for further research. Nevertheless, the application of PBMC-derived monocytes has some limitations, namely requirement of large blood volumes, culture maintenance for a specific period, acquirement of limited number of cells, and donor variability [25, 26], which can be a challenge when considering exploratory studies [25]. THP-1, a human immortalized monocytic cell line derived from the peripheral blood of a child with acute monocytic leukemia (M5 subtype) [27, 28], is similar to PBMC-derived monocytes [29]. This cell line is commonly used as a model to analyze the functions of monocytes and macrophages [27, 28, 29, 30] and DCs using different protocols [31, 32, 33, 34, 35, 36, 37, 38]. Recent studies that have analyzed the different protocols used to obtain THP-1 derived DCs, confirm this cell line as a robust model to obtain DCs and corroborate its wide-use and possible applications [36]. Other studies have demonstrated the applicability of THP-1-derived DCs (THP-1-DCs) in several areas, such as autophagy and vesicle uptake [39, 40, 41]. However, the potential to use this model in cancer research has not been fully explored. In this study we demonstrate a new, faster, functional, and reproducible method to obtain immature DCs (imDCs) from THP-1 cells. These cells were further converted to mature DCs (mDCs) upon lipopolysaccharide (LPS) stimulation, and the conversion was confirmed through the morphology change, expression and activation markers, release of cytokines. This study offers beyond just the ability of our model to phagocytose tumor cells, reinforcing the model’s efficiency and highlighting its applicability in other fields.
Material and Methods
Mediums and Reagents
RPMI 1640 medium (#R6504) and phorbol 12-myristate 13- acetate (PMA) (#P8139) were purchased from Sigma-Aldrich (St. Louis, MO, USA). Fetal bovine serum (FBS) (#26140079), L-glutamine (#A2916801), trypsin (#25300054), and TripleExpress (#12604021) were purchased from Gibco (Grand Island, NY, USA). The cytokines rhIL-4 (#554605) and rhGM-CSF (#55068) along with mouse anti-human antibodies, namely, BB515 anti-CD11c clone B-ly6 (#564490), BV421 anti- CD209 clone DCN46 (#564127), BB515 anti-CD80 clone L307.4 (#565008), PE-Cy7 anti-CD86 clone 2331 (FUN- 1) (#561128), APC anti-CD83 clone HB15e (#551073), and PE-CF594 anti-HLA-DR clone G46-6 (#562304), were purchased from BD Biosciences (New Jersey, USA). Bovine serum albumin (BSA) was purchased from Sigma-Aldrich (#A7606). Alexa Fluor™488 Phalloidin (#A12379) was purchased from Molecular Probes (Carlsbad, CA, USA). Fast SYBR Green Master Mix (#4385612) was purchased from Applied Biosystems (Vilnius, Lithuania). Hoechst 3342 (#H3570) and SuperScript™ III First-Strand Synthesis SuperMix (#18080-400) were acquired from Invitrogen (Carlsbad, CA, USA), and RNAspin Kit (#GE25-0500-72) was acquired from GE Healthcare (Chicago, USA).
Cell Culture and Differentiation
THP-1 cells were acquired from the American Type Culture Collection (Manassas, VA, USA) and cultured in RPMI 1640 medium supplemented with 10% FBS and 2 mM L-glutamine. THP-1-derived macrophages (THP-1-MØ) were obtained using the method described by Oliveira, et al. [42]. THP-1 cells were cultured in RPMI medium supplemented with 25 nM PMA for 48 h, followed by incubation for 24 h in PMA-free medium. For the experiments, cells were collected via centrifugation at 394 x g for 5 min. To produce THP- 1-DCs, THP-1 cells were cultured in RPMI 1640 medium supplemented with 10% FBS, 2 mM L-glutamine, rhIL- 4, and rhGM-CSF (1000 U/mL) for 3 h, followed by the addition of 10 nM PMA. After 24 h, PMA was removed, and adherent cells were carefully washed with PBS and cultured in a medium supplemented with cytokines for 48 h (in the absence of PMA). THP1-DCs were then seeded in T25 cell culture flasks at a confluence of 2 x 10⁶ cells. For the DC activation experiments, after differentiation, THP-1-DCs were stimulated with LPS (1 µg/mL) for 24 h.
Immunophenotyping and Activation via Image Flow Cytometry
To obtain the cells for flow cytometry, THP-1 cells were collected via centrifugation. THP-1-DCs were harvested using 1 mL of trypsin and THP-1-MØ were harvested using 1 mL of TripleExpress in T25 cell culture flasks. The cells were then fixed with 0.25% PBS/paraformaldehyde (PFA) for 40 min at room temperature (24–25°C), washed two times with PBS, and incubated with 1% PBS/BSA (blocking buffer) for
30 min at 4°C. To perform immunophenotyping, the primary antibodies anti-CD11c and anti-CD209, (dilution ratio 1/50 in blocking buffer) were added, followed by overnight incubation. To activate DCs, THP-1-DCs without LPS and those stimulated with LPS were incubated with anti-CD80, anti-CD86, anti-CD83, and anti-HLA-DR antibodies (dilution ratio of 1/50). After washing with PBS, the samples were resuspended in PBS (50 µL).
After staining, the Amnis MKII Imaging Flow Cytometer and INSPIRE v4.1 software (Luminex, Seattle, USA) were used to obtain 10,000 events for each sample. Sample images were captured under 60× objective lens using the following channels: Ch01, Brightfield; Ch02, Laser 488 nm (BB515); Ch04, Laser 488 nm (PE-CF594); Ch06, Laser 561 nm (PE-Cy7); Ch07, Excitation Laser 405 nm (BV421); and Ch11, Laser 642 nm (APC). Laser 785 nm was used to obtain information on internal complexity. To compensate for spectral spillover, a compensation matrix was developed using single-color markers and applied to each file. IDEAS® v6.2 was used to perform the analysis.
Morphological Analysis via High-Content Screening
Cells were seeded in 96-well Black Polystyrene Advanced TC Microplates (#655986; Greiner, Kremsmünster, Austria) at a density of 2 × 10⁴ cells/well. After 24 h, cells were fixed with PHEM solution (2 mM HEPES, 10 mM EGTA, 2 mM MgCl2, and 60 mM PIPES at pH 6.9) supplemented with 4% PFA (PHEM/PFA) for 30 min, permeabilized with PHEM/ PFA supplemented with 0.5% TRITON, and washed three times with PHEM supplemented with 0.1 M glycine for 5 min. Thereafter, cells were incubated with Alexa Fluor™488 Phalloidin (1/1000) and Hoechst (5 µM) for 30 min and washed three times with PBS. ImageXpress Micro Confocal High-Content Screening System (Molecular Device, San Jose, CA, USA) was used to acquire the images. The 60× objective lens was used in the confocal mode, with 50 steps and 0.3 µM step size in the DAPI (1500 ms) and FITC (1750 ms) channels. MetaXpress® 6 Software Guide was used to obtain the images.
Cytokine Profile Analysis via Multiplex
For cytokine analysis, the cells were cultured for 24 h, followed by the collection of the cell-free supernatants of all THP-1-DCs stimulated or not with LPS. Multiplex analysis was performed using the Milliplex MAP Human Cytokine/ Chemokine Magnetic Bead Panel (#HCYTOMAGHUMAN- 60K-13 Kit; Millipore) according to the manufacturer’s instructions. Detection and analysis were performed using the Luminex-200 system (Millipore), with Luminex xPONENT software 4.3 for acquisition and MILLIPLEX Analyst 5.1 for analysis. The following inflammatory and anti-inflammatory cytokines were analyzed: TNF-α, IFN-y, IL-1β, IL-6, IL-8, CXCL10, CCL2, CCL3, CCL4, IL-4, IL-10, VEGF, and CCL22. The level of each cytokine was expressed as pg/mL.
Time-Lapse and Phagocytosis Analyses via Confocal Microscopy
To evaluate the phagocytic ability of differentiated THP- 1-DCs, time-lapse analysis was performed by using these cells to phagocytose the apoptotic bodies of tumor cells, as described in the supplementary material (SM1 and SV1). imDCs have greater phagocytic abilities than mDCs [43, 44]. Therefore, we evaluated the phagocytic ability of imDCs and stimulated THP-1-DCs by quantitatively analyzing phagocytic cells. For this, THP-1-DCs were stimulated with LPS for 4 h, followed by nuclear labeling with Hoechst (5 µM) for 30 min at 37°C under a 5% CO2 atmosphere. The medium was changed, and the apoptotic human melanoma cells (SK-MEL-28) labeled with propidium iodide (1 µg/mL; Invitrogen) were added at a 1:2 ratio. LPS stimulation was maintained in the DCs that were previously stimulated. After centrifugation at 201 x g for 3 min, the plates were incubated for 2 and 6 h. Then, cells were fixed with 4% PBS/PFA for 30 min, permeabilized with 0.5% PBS/PFA/TRITON for 5 min, washed two times, and labeled with Alexa Fluor™488 Phalloidin (1/1000) for 30 min. Following another washing step, 200 µL of PBS/glycerol (50%) was added to the wells.
A confocal microscope with 20×/0.75 and 40×/1.10 objectives lens and excitation lasers at 405, 488, and 552 nm (TCS SP8, Leica Microsystems) was used to scan the cells along the x-,y-, and z-axes. The respective modules of Las X software were used to acquire images and phagocytic events. For quantitative analyses, around ten sites per well were randomly selected to obtain at least 500–1000 events (cells). The percentage of phagocytic events were calculated using the following formula: (n° phagocytic events / n° total events) x 100%. The experiment was performed in triplicate and as two independent experiments.
RNA Isolation and RT-qPCR
Total RNA was extracted from 1.2–1.5 × 10⁶ cells using Trizol® according to the manufacturer’s instructions. RNA was purified using the RNAspin Kit following the manufacturer’s instructions. Total RNA was quantified using NanoDrop ND-100 (Thermo Fisher Scientific, Wilmington, USA). SuperScript III Reverse Transcriptase was used according to the manufacturer’s instructions to synthesize cDNA from 1 µg of total RNA. For RT-qPCR, 10 µL of the master mix (3.12 µL of RNAse
free-water, 6 µL of Fast SyberTM Green Master Mix, and 0.44 µL of each forward and reverse primer (Thermo Fisher Scientific; 1600 nM working solution) was distributed per reaction into a 96-well plate. Then, 1 µL of cDNA (1:10) was added to the appropriate well. The PCR cycling conditions were 40 cycles at 95°C for 15s, 60°C for 1 min. The QuantStudio 3 relative PCR instrument was used to perform PCR analysis. The comparative cycle threshold (2−ΔΔCt) method was used to measure relative expression. The following transcription factors were evaluated: NF-ƙB, STAT1, MDA5, STAT3, and MYD88. RPL37 served as an endogenous control [14]. Table S1 lists the primer sequences.
Statistical Analysis
One-way analysis of variance (ANOVA), Dunn’s test for multiple comparisons, and nonparametric Mann–Whitney test were used to perform statistical analyses. GraphPad Prism 6 version was used to perform statistical analysis at a significant level of p<0.05. Individual experiments were independently performed at least three times in duplicate.
Results
Phenotyping
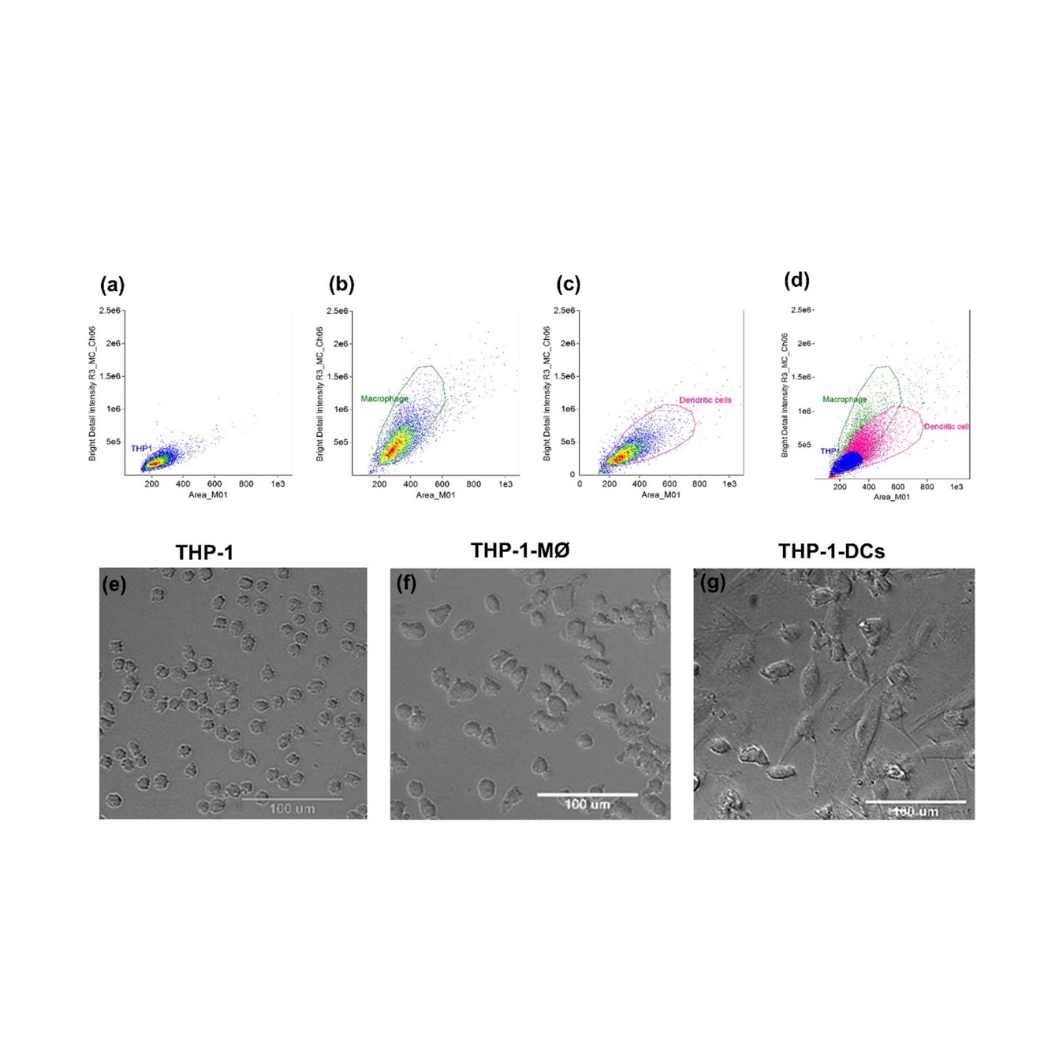
Since cell markers and morphology can differentiate macrophages (MØ) and DCs, we evaluated these parameters using typical markers for MØ and DCs (CD11c and DC-SIGN; C-type lectin receptors are present on the surface of both MØ and DCs) to confirm the differentiation of THP-1 cells in these cells (called THP-1-MØ and THP-1-DCs for macrophages and DCs, respectively). Flow cytometry revealed that THP-1-MØ and THP-1- DCs are larger and more complex than THP-1 cells, with THP-1-DCs being slightly larger than THP-1-MØ (Figures 1a-d). Furthermore, morphological analysis revealed that compared with THP-1 cells (Figure 1e), THP-1-MØ contain a more regular, spherical cytoplasm and strong adherence (Figure 1f). Contrastingly, THP-1-DCs have an irregular shape with larger cytoplasmic areas and protrusions (Figure 1g); however, they were larger than THP-1 cells (Figures S1a-c).
THP-1-DCs and THP-1-MØ presented similar but higher CD11c levels than THP-1 cells (8.8×10⁵ ± 3.6×10⁵ MFI and 1.0×10⁶ ± 4.1×10⁵ MFI for THP-1-MØ and THP-1-DCs, respectively) (Figure 2a); however, the expression of the lectin CD209 (also called DC-SIGN) was higher in THP-1-DCs (5.0×10⁵ ± 1.2×10⁵ MFI) than in THP-1 cells (1.0×10⁴ MFI) and THP-1-MØ (1.0×10⁵ ± 5.8×10⁴ MFI) (Figure 2b), with 90% of the cells in the analyzed population expressing this marker (Figure 2d), suggesting a high rate of differentiation. Finally, in the differentiated cells, expression of CD11c was similar (Figure 2c).
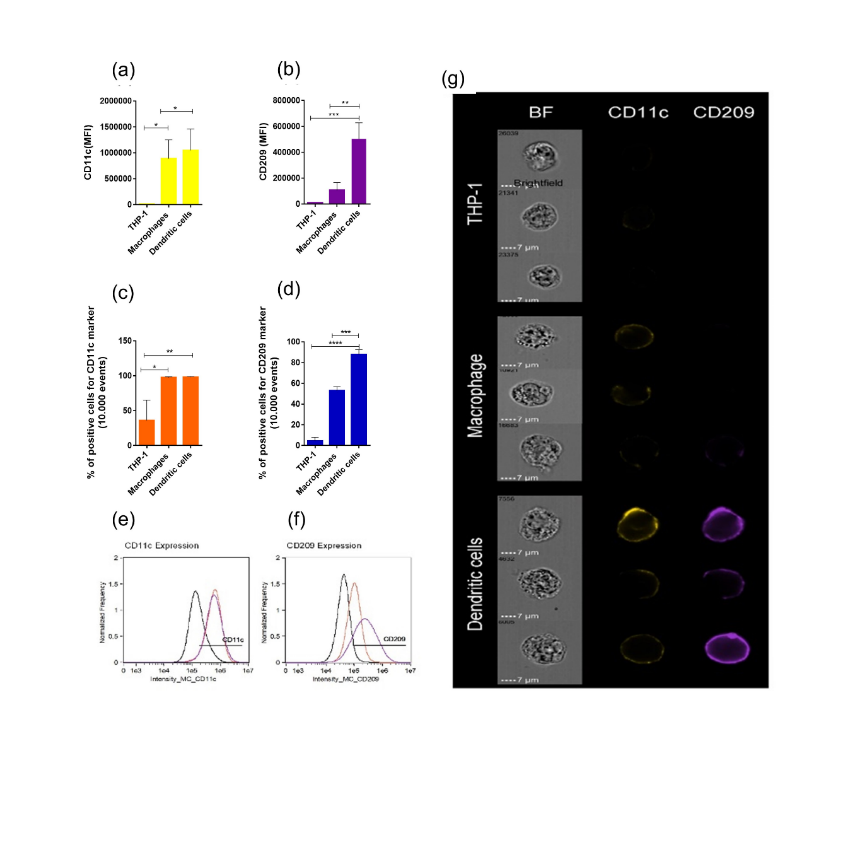
Figure 2: Immunophenotyping of THP-1 by image flow cytometry. Mean fluorescence intensity (MFI) of CD11c (a) and CD209 (b). Percentage of positive cells for CD11c (c) and CD209 (d). Flow cytometry histogram of CD11c (e) and CD209 (f) expression in THP-1 (black), THP-1-MØ (red), and THP-1-DCs (purple). Representative image of flow cytometry CD11c (yellow) and CD209 (purple) (g). All data are representative of three independent experiments. *p<0.05; p<0.01; *p<0.001 as determined using One-way analysis of variance followed by nonparametric Mann–Whitney U-test as a post-hoc test. MØ: macrophages; DCs: dendritic cells.
Maturation Under LPS Stimulation
After 6 h of LPS stimulation, mDCs presented a more starlit shape (Figures 3a & S2a) than imDCs (Figures 3b & S2b). Furthermore, after LPS stimulation for 24 h, the expression of the costimulatory molecules CD80 (MFI
3.6×10⁵ ± 8.0×10⁴ vs. 6.7×10⁴ ± 2.9×10⁴ for mDCs and imDCs, respectively), CD86 (MFI 4.2×10⁴ ± 2.1×10⁴ vs. 2.8×10⁴ ± 2.0×10⁴ for mDCs and imDCs, respectively), and CD83 (MFI 3.4×10⁴ ± 1.7×10⁴ vs. 1.2×10⁴ ±1.3×10⁴ for mDCs and imDCs, respectively) was high (Figures 3c-f). However, HLA-DR levels were not significant in imDCs (Figure 3g).
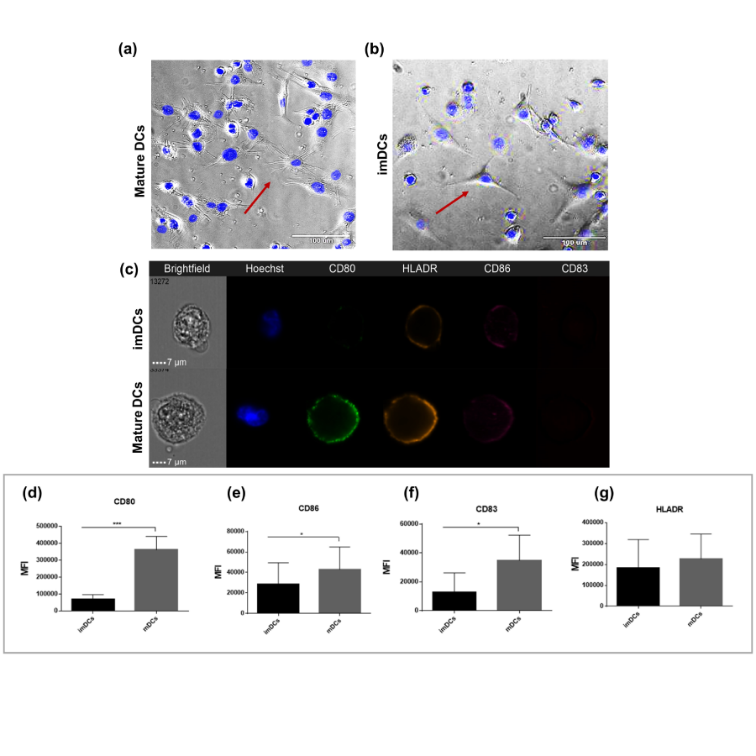
Figure 3: THP-1-DCs express costimulatory markers and specific morphology. Morphological shape of mDCs (a) and imDCs (b). Representative image of Amnis image flow cytometry of nucleus (Hoescht), CD80 (green), HLA-DR (orange), CD86 (pink), and CD83 (red) (c). Mean fluorescence intensity (MFI) of CD80 (d), CD86 (e), CD83 (f), and HLA-DR (g). All data are representative of at least six independent experiments. p<0.01 *p<0.001 as determined by One-way analysis of variance followed by nonparametric Mann–Whitney U-test as a post-hoc test. DCs: dendritic cells; mDCs: mature dendritic cells; imDCs: immature dendritic cells.
Cytokines Release
To confirm the functionality of LPS-stimulated mature THP-1-DCs (mDCs), we examined the cytokines released by these cells. In the microenvironment, mDCs released higher levels of proinflammatory cytokines and chemokines compared with imDCs: IL-6 (474.34±300.0 vs. 1.2±0.5 pg/ mL for mDCs and imDCs, respectively), TNF-α (7675.5±4208 vs. 27.5±10.2 pg/mL for mDCs and imDCs, respectively),
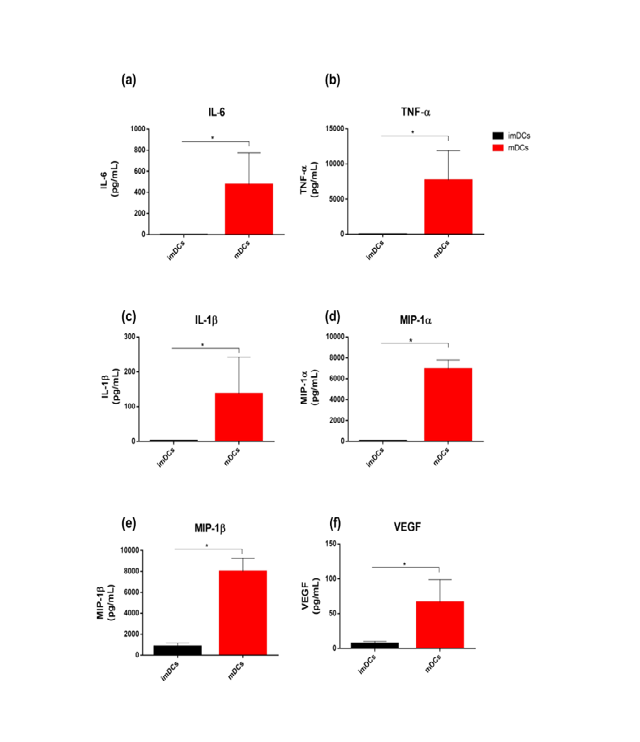
Figure 4: Mature THP-1-DCs release proinflammatory cytokines in response to LPS. Secretion of IL-6 (a), TNF-α (b), IL-1β (c), MIP-1α (d), MIP-1β (e), and VEGF (f) evaluated using the Millipore Multiplex Assay after stimulation for 24 h. The data are shown as the mean ± SD of four independent experiments. *p<0.05 as determined using One-way analysis of variance followed by nonparametric Mann–Whitney U-test as a post-hoc test. Lipopolysaccharide: LPS.
Expression of Innate Immunity-Related Transcription Factors in LPS-Stimulated THP-1- DCs
The mRNAs expression of innate immunity-related transcription factors increased in mDCs compared with IL-1β (137.42±105.35 vs. 2.7±0.5 pg/mL for mDCs and imDCs, respectively) (Figures 4a-c), MIP-1α (6944±869.0 vs. 77.0±34.1 pg/mL for mDCs and imDCs, respectively), MIP-1β (8001.25±1283.5 vs. 856.5±313.6 pg/mL for mDCs and imDCs, respectively) (Figures 4d & e), and VEGF, a proangiogenic factor (65.7±32.4 vs. 7.0±2.3 pg/mL for mDCs and imDCs, respectively) (Figure 4f).
imDCs (Figure 5) dotted red line: STAT1 (4.20±1.90), MDA5 (5.62±4.35), and MYD88 (3.19±1.58) after LPS stimulation for 6 h and NF-ƙB (5.65±4.0), STAT1 (6.05±3.34), and MDA5 (9.72±4.91) after 24 h. Interestingly, STAT3 expression did not significantly increase at any of the evaluated time points (Figure 5).
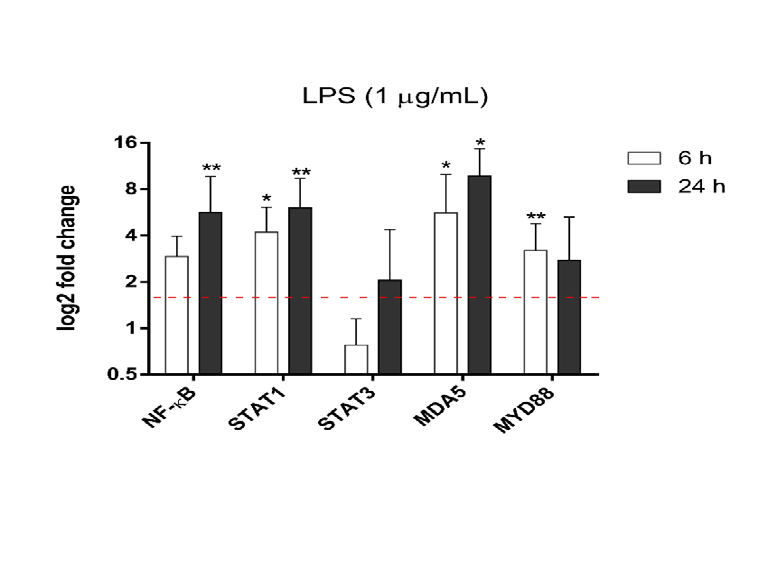
Figure 5: Mature THP-1-DCs at 6 and 24 h post stimulation with LPS. mRNA expression of inflammatory response (NF-ƙB, STAT1, STAT3, MDA5 and MYD88). RPL37 was used as a housekeeping gene. The data are as the mean SD of fold change compared to the control and representative of five independent experiments. *p<0.05 **p<0.001 as determined by One-way analysis of variance on ranks with Dunn’s post-hoc test. DCs: dendritic cells; LPS: lipopolysaccharide.
Diminished Ability of LPS-Stimulated THP-1- DCs to Phagocytose the Apoptotic Bodies of Tumor Cells
When incubated with the apoptotic bodies of tumor cells for 2 h, LPS-stimulated THP-1-DCs presented with phagocytotic abilities similar to imDCs (19.60±6.0 vs. 16.98±4.11 for LPS-stimulated THP-1-DCs and imDCs, respectively) (Figure 6). However, after 6 h, their phagocytic activity significantly decreased compared with that of imDCs (18.98±3.57 vs. 26.69±4.51 for LPS-stimulated THP-1-DCs and imDCs, respectively) (Figure 6).
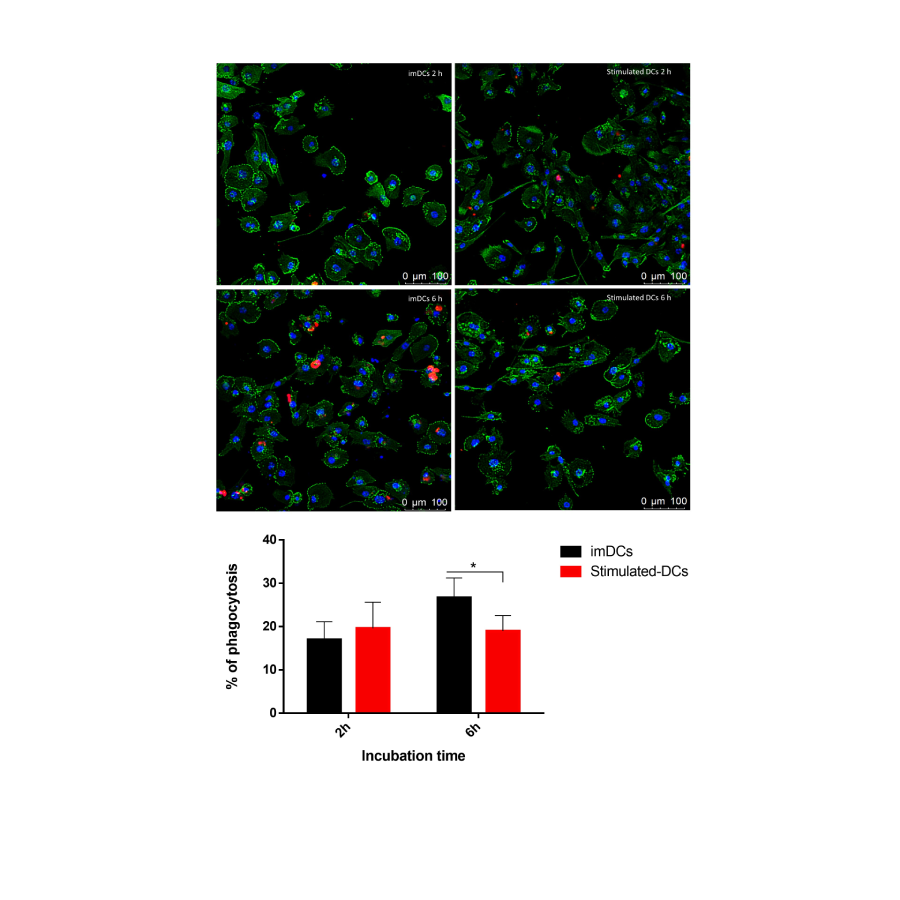
Figure 6: Capacity of DCs to phagocytose apoptotic bodies of SK-MEL-28. The microscope images depict phagocytosing apoptotic bodies SK-MEL-28. Nucleus (blue), actin (green) and apoptotic bodies (red). The data are representative of two independent experiments performed in triplicate and presented as the mean ± SD. *p<0.05 as determined by One-way analysis of variance followed by nonparametric Mann–Whitney U-test as a post-hoc test. DCs: dendritic cells.
Discussion
In studies involving monocytes and macrophages, there is a need to use THP-1 cells in vitro as a model for primary human monocytes ex vivo [27].
In the present study, we produced immature THP-1- DCs using rhIL-4, rhGM-CSF, and PMA. The differentiation of these cells was confirmed by both THP-1-DCs and THP-1- MØ (differentiated cells) expressing similar levels of CD11c; however, THP-1-DCs expressed a higher level of CD209. Inflammatory monocytes and macrophages express the integrin CD11c Guermonprez P, et al. [45], whereas Mo-DCs express DC-SIGN, a phenotypically extended marker of Mo- DCs [46]. Furthermore, morphological shape can be a robust method for distinguishing DCs; it confirmed that THP-1 cells can differentiate into macrophages and DCs, reinforcing that this cell line can be used to obtain DCs. Studies involving DCs, show that these cells undergo maturation in response to several stimuli, including damage- associated molecular patterns and pathogen-associated molecular patterns (PAMPs) such as LPS, dsRNA viruses, or inflammatory cytokines binding to receptors on the DCs surface [47, 48, 49]. This process involves intracellular signaling, leading to transcription factor activation and costimulatory molecule enhancement [44]. Since DCs can present immunogenic or tolerogenic functions at immature, semi- mature, and fully mature stages, the profile of the cytokines released from DCs in distinct microenvironments is vital for indicating the type and stage of maturation of these cells [50, 51]. LPS is the major component of membrane in Gram- negative bacteria and is a widely studied and well- characterized PAMP, recognized by Toll Like Receptor 4 (TLR4) [52, 53]. Recognition of the bacterial LPS leads to initiation of a complex process in DCs, termed “maturation” or “activation”, involving morphological and phenotypical changes [53]. Furthermore, in response to LPS, DCs produces pro-inflammatory cytokines such as TNF- α, IL-12, IL-6 Abdi K, et al. [54], IL-1a, IL-1b and MIP genes [55]. Besides that, have been shown that the change from the immature stage to a mature stage in DCs is characterized by specific functional stages, with a few hours after LPS activation, these cells gradually lose their ability to uptake antigen [56]. In agreement with the above studies focusing on Mo- DCs, our study demonstrated THP-1-DCs similarly attaining a fully mature state in response to LPS, with high expression of CD80, CD86, and CD83 and a more starlit morphology. Moreover, in compliance with recent studies involving imDCs and mDCs derived from THP-1, our results also showed similar levels of HLA-DR [36]. In addition, inflammatory transcription factors such as NF-ƙB, STAT1, MyD88, and MDA5 were genetically modulated, however, STAT3 was not, which may negatively regulate DC maturation [57]. Similarly, we also observed the release of proinflammatory cytokines such as IL-6, TNF-α, and IL-1β; chemokines such as MIP-1α and MIP-1β; and an increase in the proangiogenic factor VEGF following LPS stimulation, stimulated by DCs under proinflammatory conditions [58].
Monocytes are considered to be more responsive to LPS than THP-1 cells because of the high level of CD14, which binds to LPS, presents it to the complex TLR4/MD2, and triggers intracellular signaling [59]. Other protocols to obtain THP-1-DCs have failed to produce mDCs under LPS stimulation; this could be attributed to the absence of TLR4 [32]. However, certain studies have revealed the presence of TLR4 in PMA-stimulated THP-1 cells [60, 61, 62]. Moreover, differentiated THP-1-MØ - PMA are more responsive to LPS Schwende H, et al. [63] and express MD2, CD14, and MyD88 in response to LPS stimulation [30]. Therefore, we speculate that using PMA and cytokines can increase the responsiveness of DCs to LPS. To the best of our knowledge, a combination of these three factors has not been previously considered in this translational model.
Furthermore, the ability of DCs to internalize antigens and present their antigenic peptides via major histocompatibility complex (MHC) molecules for T cell recognition is also a key factor to induce immune responses [64]. The phagocytic ability of these cells is vital for their function, allowing DCs to acquire samples from the microenvironment and deliver them to endocytic compartments for clearance, degradation, and MHC molecule presentation [64]. In the mature stage, the phagocytic ability of DCs decreases owing to changes in the expression of receptors such as Cdc42 and Rac [44, 65]. DC subpopulations present distinct antigen uptake owing to the expression of different phagocytic receptors [45]. In this context, the phagocytosis of Mo-DCs can be described based on their ability to kill tumor cells, fungi, and protozoans [66, 67, 68, 69]. Similarly, we showed that our model of THP-1-DCs could also phagocytose the apoptotic bodies of human melanoma cells; and this ability was decreased when THP-1-DCs were previously stimulated with this proinflammatory agonist. Since investigation to further enhance the ability of these cells to phagocytic apoptotic bodies of tumor cells seems to be relevant for efficient anti-tumor response Chen Z, et al. [15, 20, 70] our data suggests that our proposed model can be useful in studies involving phagocytic cells such as Mo- DCs and be utilized to understand the mechanism related to phagocytic process. Furthermore, CD11c was expressed in our model. This marker is involved in cell-adhesion and clearance of pathogens, tumor and apoptotic cells by phagocytosis [71]. As a limitation, we did not compare our model with Mo- DCs, the usual model used in phagocytosis studies of tumor cells, nor did we evaluate whether this model is capable of active lymphocytes in co-culture assays, a significant characteristic of DCs. Further studies should consider whether the model can support other abilities of DCs. However, our study shows a new approach to obtain THP-1- DCs, demonstrates our model’s ability to phagocytose tumor cells, and specifies a field this model can be most efficiently utilized in. Recent studies have highlighted THP-1 as a robust model to obtain DCs and the novel findings are in regards to DCs obtained with this model [36, 39, 40]. We reinforce THP-1 cells as an alternative model for obtention of DCs through a faster, functional, and reproducible method in vitro, thereby decreasing the challenges and limitations observed when using human samples for predictive studies with these cells.
Acknowledgments
We would like to thank Fundação de Amparo à Pesquisa do Estado de São Paulo (FAPESP) grant number (2015/50040- 4) (FAPESP/GSK/Instituto Butantan) and FAPESP-CETICs grant number (2013/07467-1) that supported this research, and Coordenação de Aperfeiçoamento de Pessoal de Nível Superior (Capes) that provided P.S.C a fellowship for research development.
We thank Carlos DeOcesano-Pereira for kindly donating the primer sequences used in the gene expression experiments and for providing technical assistance with MetaXpress® 6 Software.
Supplementary Material
SM1: Time lapse protocol. SV1 Video: Time lapse video. S1 Table: Forward e reverse sequence of primers. S1 Figure: THP1 (a) THP-1-Macrophages (b) and THP-1-DCs (c). Imagens were obtained with 10x inverted microscopy (Nikon TS100). Scale bars are 100µm; Figure S2: non-stimulated THP1-DCS (a) and stimulated for 6 h with LPS (b). Images were obtained with 20x inverted microscopy (Nikon TS100). Scales bars are 100 µm.
Author Contributions
Conceptualization, P.S.C, J.G.S.; Methodology, Resources; writing-original draft preparation, P.S.C., M.M.de S., D.S.O., R.N.G.; Writing-review and editing, P.S.C., M.P.A.-F., T.C.M.; Project administration, A.M.C.-T.; All authors have read and agreed to the published version of the manuscript.
Institutional Review Board Statement
Not applicable.
Informed Consent Statement
Not applicable.
Data Availability Statement
The data are available within the article and supplementary material.
Conflicts of Interest
The authors declare no conflicts of interest.
References
-
Banchereau J, Briere F, Caux C, Davoust J, Lebecque S, et al. (2000) Immunobiology of Dendritic Cells. Annu Rev Immunol 18(1): 767-811.
-
Pearce EJ, Everts B (2015) Dendritic Cell Metabolism. Nat Rev Immunol 15(1): 18-29.
-
Heath WR, Carbone FR (2009) Dendritic Cell Subsets in Primary and Secondary T Cell Responses at Body Surfaces. Nat Immunol 10(12): 1237-1244.
-
Vyas JM (2012) The Dendritic Cell: The General of the Army. Virulence 3(7): 601-602.
-
Sallusto F, Lanzavecchia A (1994) Efficient Presentation of Soluble Antigen by Cultured Human Dendritic Cells is Maintained by Granulocyte/Macrophage Colony- Stimulating Factor Plus Interleukin 4 and Downregulated by Tumor Necrosis Factor Alpha. J Exp Med 179(4): 1109-1118.
-
Worbs T, Hammerschmidt SI, Forster R (2017) Dendritic Cell Migration in Health and Disease. Nat Rev Immunol 17(1): 30-48.
-
Anguille S, Smits EL, Lion E, Tendeloo VFV, Berneman ZN (2014) Clinical use of Dendritic Cells for Cancer Therapy. Lancet Oncol 15(7): e257-e267.
-
Palucka K, Banchereau J (2012) Cancer Immunotherapy via Dendritic Cells. Nat Rev Cancer 12(4): 265-277.
-
Scheuerpflug A, Ahmetlic F, Bauer V, Riedel T, Rocken M, et al. (2021) The Role of Dendritic Cells for Therapy of B-Cell Lymphoma with Immune Checkpoint Inhibitors. Cancer Immunol Immunother 70(5): 1343-1350.
-
Steinman RM, Banchereau J (2007) Taking Dendritic Cells into Medicine. Nature 449(7161): 419-426.
-
Wylie B, Macri C, Mintern J, Waithman J (2019) Dendritic Cells and Cancer: From Biology to Therapeutic Intervention. Cancers (Basel) 11(4): 521.
-
Salah A, Wang H, Li Y, Ji M, Ou WB, et al. (2021) Insights Into Dendritic Cells in Cancer Immunotherapy: From Bench to Clinical Applications. Front Cell Dev Biol 9: 686544.
-
Anguille S, Smits EL, Bryant C, Acker HHV, Goossens H, et al. (2015) Dendritic Cells as Pharmacological Tools for Cancer Immunotherapy. Pharmacol Rev 67(4): 731-753.
-
Fu C, Zhou L, Mi QS, Jiang A (2020) DC-Based Vaccines for Cancer Immunotherapy. Vaccines (Basel) 8(4): 706.
-
Chen Z, Moyana T, Saxena A, Warrington R, Jia Z, et al. (2001) Efficient Antitumor Immunity Derived from Maturation of Dendritic Cells that had Phagocytosed Apoptotic/Necrotic Tumor Cells. Int J Cancer 93(4): 539- 548.
-
Hashemi V, Farhadi S, Chaleshtari MG, Seashore-Ludlow B, Masjedi A, et al. (2020) Nanomedicine for Improvement of Dendritic Cell-Based Cancer Immunotherapy. Int Immunopharmacol 83: 106446.
-
Qin X, Zhang M, Zhao Z, Du Q, Li Q, et al. (2022) A Carrier- Free Photodynamic Nanodrug to Enable Regulation of Dendritic Cells for Boosting Cancer Immunotherapy. Acta Biomater 147: 366-376.
-
Janssens S, Rennen S, Agostinis P (2024) Decoding Immunogenic Cell Death from a Dendritic Cell Perspective. Immunol Rev 321(1): 350-370.
-
Fang H, Ang B, Xu X, Huang X, Wu Y, et al. (2014) TLR4 is Essential for Dendritic Cell Activation and Anti-Tumor T-Cell Response Enhancement by DAMPs Released from Chemically Stressed Cancer Cells. Cell Mol Immunol 11(2): 150-159.
-
Correale P, Botta C, Cusi MG, Vecchio MTD, Santi MMD, et al. (2012) Cetuximab ± Chemotherapy Enhances Dendritic Cell‐Mediated Phagocytosis of Colon Cancer Cells and Ignites a Highly Efficient Colon Cancer Antigen‐ Specific Cytotoxic T‐Cell Response in Vitro. Int J Cancer 130(7): 1577-1589.
-
Matsushita M, Kashiwazaki S, Kamiko S, Kobori M, Osada M, et al. (2023) Immunomodulatory Effect of Proteasome Inhibitors via the Induction of Immunogenic Cell Death in Myeloma Cells. Pharmaceuticals (Basel) 16(10): 1367.
-
Spisek R, Charalambous A, Mazumder A, Vesole DH, Jagannath S (2007) Bortezomib Enhances Dendritic Cell (DC)–Mediated Induction of Immunity to Human Myeloma via Exposure of Cell Surface Heat Shock Protein 90 on Dying Tumor Cells: Therapeutic Implications. Blood 109(11): 4839-4845.
-
Liu P, Zhao L, Zitvogel L, Kepp O, Kroemer G (2024) Immunogenic Cell Death (ICD) Enhancers-Drugs that Enhance the Perception of ICD by Dendritic Cells. Immunol Rev 321(1): 7-19.
-
Liu K (2016) Dendritic Cells. Encyclopedia of Cell Biology, pp: 741-749.
-
Maess MB, Sendelbach S, Lorkowski S (2010) Selection of Reliable Reference Genes during THP-1 Monocyte Differentiation into Macrophages. BMC Mol Biol 11(1): 90.
-
Tietze C, Blomeke B (2008) Sensitization Assays: Monocyte-Derived Dendritic Cells Versus a Monocytic Cell Line (THP-1). J Toxicol Environ Health A 71(13-14): 965-968.
-
Bosshart H, Heinzelmann M (2016) THP-1 cells as a model for human monocytes. Ann Transl Med 4(21): 438.
-
Tsuchiya S, Yamabe M, Yamaguchi Y, Kobayashi Y, Konno T, et al. (1980) Establishment and characterization of a human acute monocytic leukemia cell line (THP-1). Int J Cancer 26(2): 171-176.
-
Chanput W, Mes JJ, Wichers HJ (2014) THP-1 cell line: an in vitro cell model for immune modulation approach. Int Immunopharmacol 23(1): 37-45.
-
Lund ME, To J, Brien BA, Donnelly S (2016) the choice of phorbol 12-myristate 13-acetate differentiation protocol influences the response of THP-1 macrophages to a pro- inflammatory stimulus. J Immunol Methods 430: 64-70.
-
Li L, Wang S, Zou Z, Tao A, Ai Y (2018) Activation profile of THP-1 derived dendritic cells stimulated by allergen Mal f 1 beyond its IgE-binding ability. Int Immunopharmacol 62:139-146.
-
Berges C, Cord N, Sarah T, Hubert W, Alexandra H, et al. (2005) A cell line model for the differentiation of human dendritic cells. Biochem Biophys Res Commun 333(3): 896-907.
-
Katayama S, Kukita T, Ishikawa E, Nakashima S, Masuda S, et al. (2013) Apple polyphenols suppress antigen presentation of ovalbumin by THP-1-derived dendritic cells. Food Chem 138(2-3): 757-761.
-
Ogasawara N, Takashi K, Mitsuru G, Fuchimoto J, Kamekura R et al. (2009) Induction of JAM-A during differentiation of human THP-1 dendritic cells. Biochem Biophys Res Commun 389(3): 543-549.
-
Larsson K, Lindstedt M, Borrebaeck CAK (2006) Functional and transcriptional profiling of MUTZ‐3, a myeloid cell line acting as a model for dendritic cells. Immunology 117(2): 156-166.
-
Holken JM, Teusch N (2023) the Monocytic Cell Line THP-1 as a Validated and Robust Surrogate Model for Human Dendritic Cells. Int J Mol Sci 24(2): 1452.
-
Choi J, Ki CS (2024) Differentiation, maturation, and collection of THP-1-derived dendritic cells based on a PEG hydrogel culture platform. Biotechnol Lett 46(2): 235-247.
-
Deng Y, Govers C, Beest ET, Van D, Hettinga K, et al. (2021) A THP-1 Cell Line-Based Exploration of Immune Responses Toward Heat-Treated BLG. Front Nutr 7: 612397.
-
Prins MMC, Roast M, Jacqueline LM, Sandra GT, Koelink PJ, et al. (2021) Applicability of different cell line-derived dendritic cell-like cells in autophagy research. J Immunol Methods 497: 113106.
-
Galbiati V, Marinovich M, Corsini E (2020) Mechanistic understanding of dendritic cell activation in skin sensitization: additional evidences to support potency classification. Toxicol Lett 322: 50-57.
-
Czernek L, Chworos A, Duechler M (2015) The Uptake of Extracellular Vesicles is Affected by the Differentiation Status of Myeloid Cells. Scand J Immunol 82(6): 506-514.
-
Oliveira DS, de Souza JG, Alvarez-Flores MP, Cunegundes PS, DeOcesano-Pereira C, et al. (2021) Lonomia obliqua Venom Induces NF-κB Activation and a Pro-Inflammatory Profile in THP-1-Derived Macrophage. Toxins 13(7): 462.
-
Kim MK, Kim J (2019) Properties of immature and mature dendritic cells: phenotype, morphology, phagocytosis, and migration. RSC Adv 9(20): 11230-11238.
-
Savina A, Amigorena S (2007) Phagocytosis and antigen presentation in dendritic cells. Immunol Rev 219(1): 143-156.
-
Guermonprez P, Bourdely P, Vaivode K, Gerber-Ferder Y, Helft J (2019) Origin and development of classical dendritic cells. Int Rev Cell Mol Biol 349: 1-54.
-
Belz GT, Nutt SL (2012) Transcriptional programming of the dendritic cell network. Nat Rev Immunol 12(2): 101- 113.
-
Mbongue JC, Nieves HA, Torrez TW, Langridge WHR (2017) The Role of Dendritic Cell Maturation in the Induction of Insulin-Dependent Diabetes Mellitus. Front Immunol 8: 327.
-
Lund JM, Linehan MM, Iijima N, Iwasaki A (2006) Cutting Edge: Plasmacytoid Dendritic Cells Provide Innate Immune Protection against Mucosal Viral Infection In Situ. J Immunol 177(11): 7510-7514.
-
Ali OA, Tayalia P, Shvartsman D, Lewin S, Mooney DL (2013) Inflammatory Cytokines Presented from Polymer Matrices Differentially Generate and Activate DCs In Situ. Adv Funct Mater 23(36): 4621-4628.
-
Lutz MB, Schuler G (2002) Immature, semi-mature and fully mature dendritic cells: which signals induce tolerance or immunity?. Trends Immunol 23(9): 445- 449.
-
Tisch R (2010) Immunogenic versus tolerogenic dendritic cells: a matter of maturation. Int Rev Immunol 29(2): 111-118.
-
Akira S, Uematsu S, Takeuchi O (2006) Pathogen Recognition and Innate Immunity. Cell 124(4): 783-801.
-
Biscari L, Kaufman CD, Farre C, Huhn V, Pacini MF, et al. (2022) Immunization With Lipopolysaccharide- Activated Dendritic Cells Generates a Specific CD8+ T Cell Response That Confers Partial Protection Against Infection With Trypanosoma cruzi. Front Cell Infect Microbiol 12: 897133.
-
Abdi K, Singh NJ, Matzinger P (2012) Lipopolysaccharide- Activated Dendritic Cells: ‘Exhausted’ or Alert and Waiting?. J Immunol 188(12): 5981-5989.
-
Morelli E, Zahorchak AF, Larregina AT, Colvin BL, Logar AJ, et al. (2001) Cytokine production by mouse myeloid dendritic cells in relation to differentiation and terminal maturation induced by lipopolysaccharide or CD40 ligation. Blood 98(5): 1512-1523.
-
Granucci F, Ferrero E, Foti M, Aggujaro D, Vettoretto K, et al. (1999) Early events in dendritic cell maturation induced by LPS. Microbes Infect 1(13): 1079-1084.
-
Nefedova Y, Cheng P, Gilkes D, Blaskovich M, Beg AA, et al. (2005) Activation of Dendritic Cells via Inhibition of Jak2/STAT3 Signaling. J Immunol 175(7): 4338-4346.
-
Bosisio D, Ronca R, Salvi V, Presta M, Sozzani S (2018) Dendritic cells in inflammatory angiogenesis and lymphangiogenesis. Curr Opin Immunol 53: 180-186.
-
Kim JI, Lee CJ, Jin MS, Lee CH, Paik SG, et al. (2005) Crystal structure of CD14 and its implications for lipopolysaccharide signaling. J Biol Chem 280(12): 11347-11351.
-
Liu SP (2012) Octanoylated Ghrelin Inhibits the Activation of the Palmitic Acid-Induced TLR4/NF- κ B Signaling Pathway in THP-1 Macrophages. ISRN Endocrinol pp: 1-8.
-
Kong F, Ye B, Lin Lu, Cai X, Huang W, et al. (2016) Atorvastatin suppresses NLRP3 inflammasome activation via TLR4/MyD88/NF-κB signaling in PMA- stimulated THP-1 monocytes. Biomed Pharmacother Biomedecine Pharmacother 82: 167-172.
-
Al-Rashed F, Sindhu S, Arefanian H, Alghaith A, Al-Mulla F, et al. (2020) Repetitive Intermittent Hyperglycemia Drives the M1 Polarization and Inflammatory Responses in THP-1 Macrophages Through the Mechanism Involving the TLR4-IRF5 Pathway. Cells 9(8): 1892.
-
Schwende H, Fitzke E, Ambs P, Dieter P (1996) Differences in the state of differentiation of THP-1 cells induced by phorbol ester and 1,25-dihydroxyvitamin D3. J Leukoc Biol 59(4): 555-561.
-
Blander JM (2007) Signalling and phagocytosis in the orchestration of host defence. Cell Microbiol 9(2): 290- 299.
-
Nobes C and Marsh M (2000) Dendritic cells: new roles for Cdc42 and Rac in antigen uptake?. Curr Biol CB 10(20): 739-741.
-
Nouri-Shirazi M, Banchereau J, Bell D, Burkeholder S, Kraus ET, et al. (2000) Dendritic Cells Capture Killed Tumor Cells and Present Their Antigens to Elicit Tumor- Specific Immune Responses. J Immunol 165(7): 3797- 3803.
-
Kiama SG, Cochand L, Karlsson L, Nicod LP, Gehr P (2001) Evaluation of phagocytic activity in human monocyte- derived dendritic cells. J Aerosol Med 14(3): 289-299.
-
Lother J, Breitschopf T, Krappmann S, Morton CO, Bouzani M, et al. (2014) Human dendritic cell subsets display distinct interactions with the pathogenic mould Aspergillus fumigatus. Int J Med Microbiol 304(8): 1160- 1168.
-
Argueta-Donohué J, Wilkins-Rodríguez AA, Aguirre- García M, Gutiérrez-Kobeh L (2016) Differential phagocytosis of Leishmania mexicana promastigotes and amastigotes by monocyte-derived dendritic cells: L. mexicana phagocytosis by DCs. Microbiol Immunol 60(6): 369-381.
-
Dalgaard J, Beckstrøm KJ, Jahnsen FL, Brinchmann JE (2005) Differential capability for phagocytosis of apoptotic and necrotic leukemia cells by human peripheral blood dendritic cell subsets. J Leukoc Biol 77(5): 689-698.
-
Lukácsi S, Nagy-Baló Z, Erdei A, Sándor N, Bajtay Z (2017) The role of CR3 (CD11b/CD18) and CR4 (CD11c/CD18) in complement-mediated phagocytosis and podosome formation by human phagocytes. Immunol Lett 189: 64- 72.
- Pattern of Gonadal Hormones in Oral Testosterone-Supplimented Male Wistar Rats with Diabetes-Induced Hypogonadism
- Re-Evaluation of the Genotoxicity of Currently Used Food Dyes in Mouse Multiple Organs Via Continuous Administration by Drinking Using the Comet Assay
- Pharmacogenetics of Type 2 Diabetes Mellitus: Linking Genetic Variability to Drug Efficacy and its Cardiovascular Outcomes
- Exploratory Proteomic Profiling of SARS-CoV-2 Infected THP-1 Macrophages Reveals Alterations in Inflammatory Response and Cellular Metabolism
- Study of Genotoxicity of Hepatocarcinogens in Multiple Organs in Mice by Feeding and Drinking Using the Comet Assay
- Spirulina Polypeptides Inhibit the Growth of Human Lung Tumor (H460) Cells